Zip Codes with the Highest Percentage of Immigrants from Central America in Lenexa, KS
RELATED REPORTS & OPTIONS
Central America
Lenexa
Compare Zip Codes
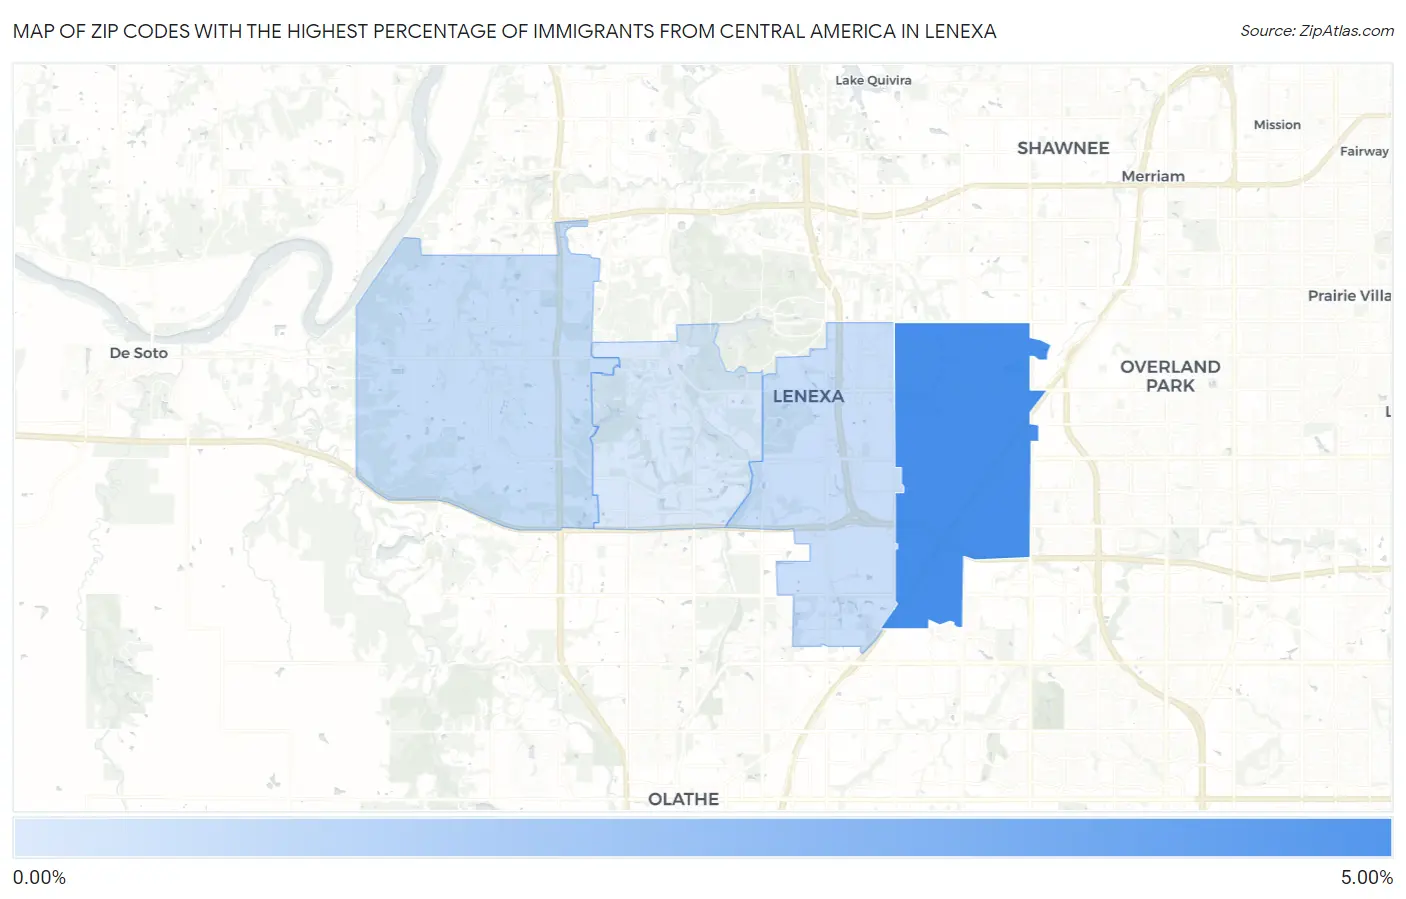
Map of Zip Codes with the Highest Percentage of Immigrants from Central America in Lenexa
0.00%
5.00%
Zip Codes with the Highest Percentage of Immigrants from Central America in Lenexa, KS
| Zip Code | Central America | vs State | vs National | |
| 1. | 66215 | 4.11% | 3.33%(+0.781)#-1 | 4.37%(-0.259)#0 |
| 2. | 66227 | 0.59% | 3.33%(-2.74)#0 | 4.37%(-3.78)#1 |
| 3. | 66219 | 0.59% | 3.33%(-2.75)#1 | 4.37%(-3.78)#2 |
| 4. | 66220 | 0.11% | 3.33%(-3.22)#2 | 4.37%(-4.26)#3 |
1
Common Questions
What are the Top 3 Zip Codes with the Highest Percentage of Immigrants from Central America in Lenexa, KS?
Top 3 Zip Codes with the Highest Percentage of Immigrants from Central America in Lenexa, KS are:
What zip code has the Highest Percentage of Immigrants from Central America in Lenexa, KS?
66215 has the Highest Percentage of Immigrants from Central America in Lenexa, KS with 4.11%.
What is the Percentage of Immigrants from Central America in Lenexa, KS?
Percentage of Immigrants from Central America in Lenexa is 2.16%.
What is the Percentage of Immigrants from Central America in Kansas?
Percentage of Immigrants from Central America in Kansas is 3.33%.
What is the Percentage of Immigrants from Central America in the United States?
Percentage of Immigrants from Central America in the United States is 4.37%.