Zip Codes with the Highest Percentage of Population with a Degree in Social Sciences in Lenexa, KS
RELATED REPORTS & OPTIONS
Social Sciences
Lenexa
Compare Zip Codes
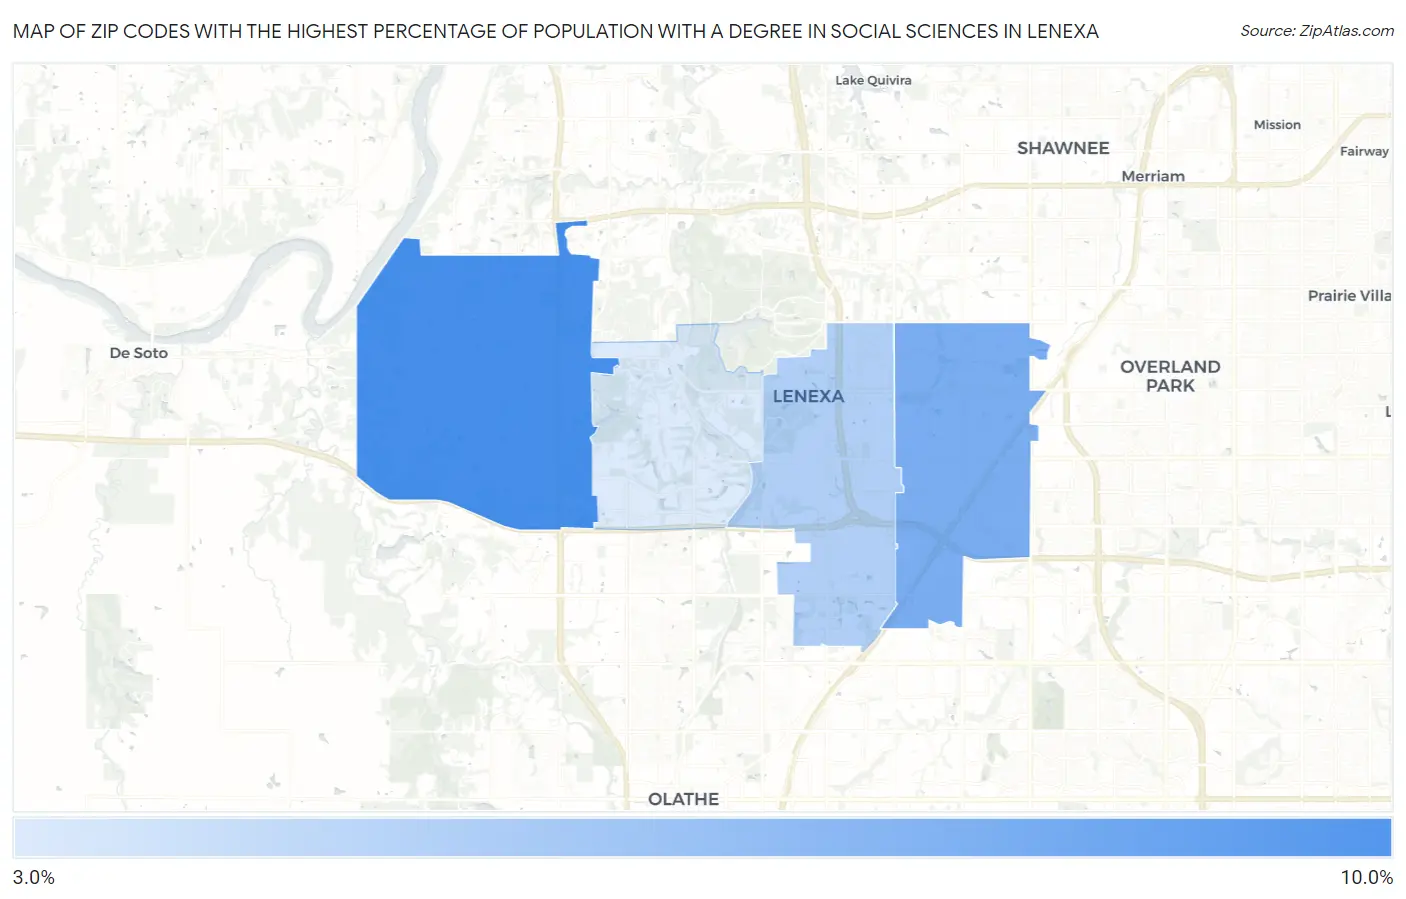
Map of Zip Codes with the Highest Percentage of Population with a Degree in Social Sciences in Lenexa
0.0%
10.0%
Zip Codes with the Highest Percentage of Population with a Degree in Social Sciences in Lenexa, KS
| Zip Code | % Graduates | vs State | vs National | |
| 1. | 66227 | 9.2% | 5.6%(+3.58)#76 | 8.1%(+1.08)#6,706 |
| 2. | 66215 | 7.1% | 5.6%(+1.53)#110 | 8.1%(-0.968)#10,682 |
| 3. | 66219 | 5.0% | 5.6%(-0.570)#204 | 8.1%(-3.07)#15,859 |
| 4. | 66220 | 3.3% | 5.6%(-2.29)#301 | 8.1%(-4.79)#19,779 |
1
Common Questions
What are the Top 3 Zip Codes with the Highest Percentage of Population with a Degree in Social Sciences in Lenexa, KS?
Top 3 Zip Codes with the Highest Percentage of Population with a Degree in Social Sciences in Lenexa, KS are:
What zip code has the Highest Percentage of Population with a Degree in Social Sciences in Lenexa, KS?
66227 has the Highest Percentage of Population with a Degree in Social Sciences in Lenexa, KS with 9.2%.
What is the Percentage of Population with a Degree in Social Sciences in Lenexa, KS?
Percentage of Population with a Degree in Social Sciences in Lenexa is 5.8%.
What is the Percentage of Population with a Degree in Social Sciences in Kansas?
Percentage of Population with a Degree in Social Sciences in Kansas is 5.6%.
What is the Percentage of Population with a Degree in Social Sciences in the United States?
Percentage of Population with a Degree in Social Sciences in the United States is 8.1%.