Zip Codes with the Highest Percentage of Population Employed in Administrative & Support Services in Lenexa, KS
RELATED REPORTS & OPTIONS
Administrative & Support Services
Lenexa
Compare Zip Codes
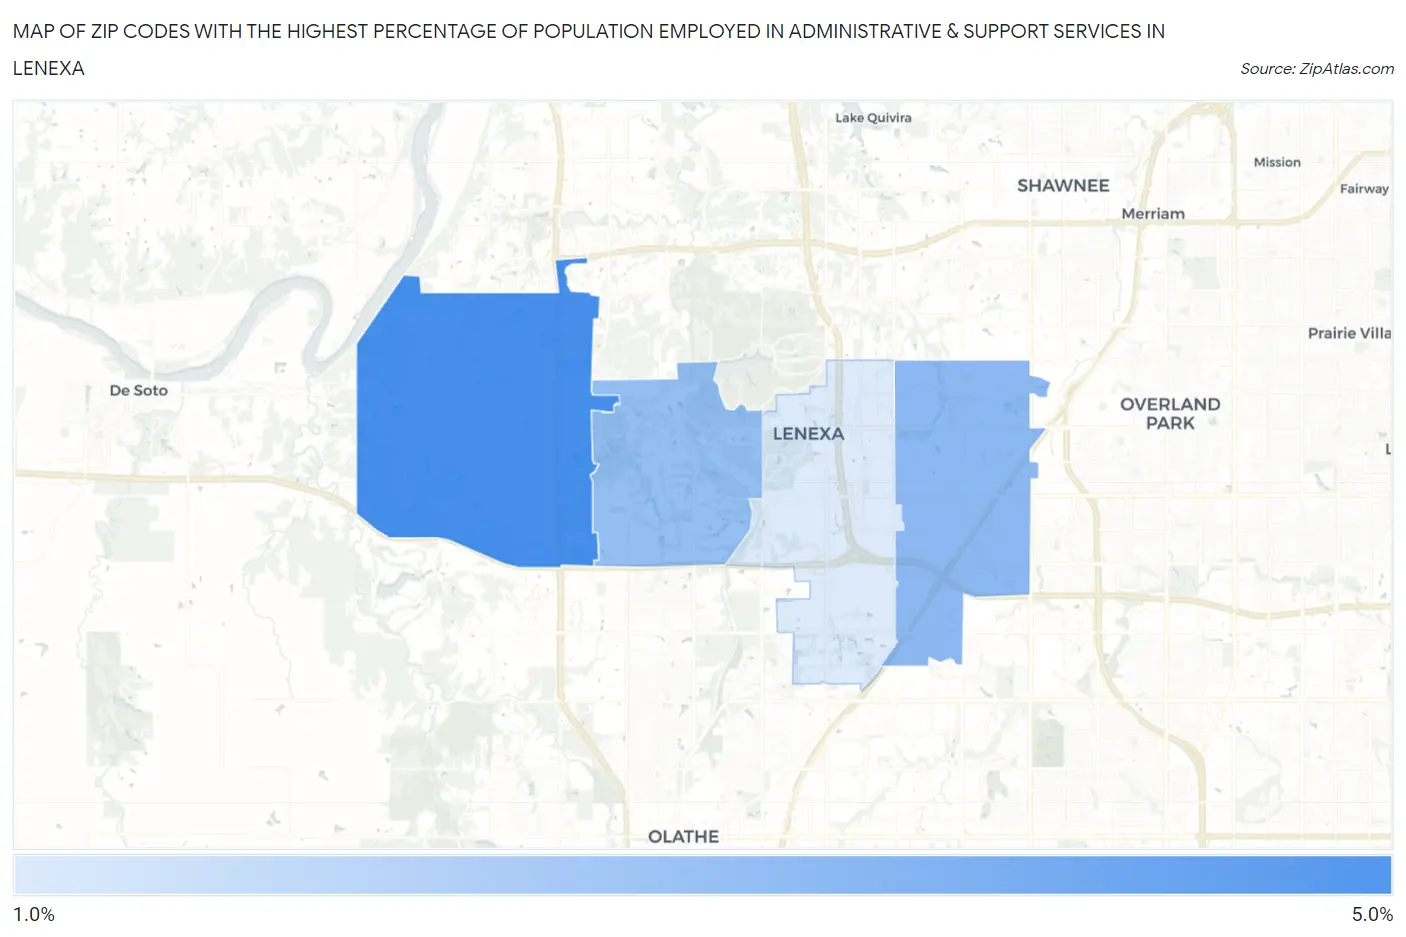
Map of Zip Codes with the Highest Percentage of Population Employed in Administrative & Support Services in Lenexa
0.0%
5.0%
Zip Codes with the Highest Percentage of Population Employed in Administrative & Support Services in Lenexa, KS
| Zip Code | % Employed | vs State | vs National | |
| 1. | 66227 | 4.2% | 3.2%(+1.00)#107 | 4.1%(+0.039)#9,873 |
| 2. | 66215 | 3.1% | 3.2%(-0.088)#196 | 4.1%(-1.05)#15,002 |
| 3. | 66220 | 2.9% | 3.2%(-0.242)#217 | 4.1%(-1.20)#15,760 |
| 4. | 66219 | 1.8% | 3.2%(-1.35)#339 | 4.1%(-2.31)#21,350 |
1
Common Questions
What are the Top 3 Zip Codes with the Highest Percentage of Population Employed in Administrative & Support Services in Lenexa, KS?
Top 3 Zip Codes with the Highest Percentage of Population Employed in Administrative & Support Services in Lenexa, KS are:
What zip code has the Highest Percentage of Population Employed in Administrative & Support Services in Lenexa, KS?
66227 has the Highest Percentage of Population Employed in Administrative & Support Services in Lenexa, KS with 4.2%.
What is the Percentage of Population Employed in Administrative & Support Services in Lenexa, KS?
Percentage of Population Employed in Administrative & Support Services in Lenexa is 3.0%.
What is the Percentage of Population Employed in Administrative & Support Services in Kansas?
Percentage of Population Employed in Administrative & Support Services in Kansas is 3.2%.
What is the Percentage of Population Employed in Administrative & Support Services in the United States?
Percentage of Population Employed in Administrative & Support Services in the United States is 4.1%.