Zip Codes with the Highest Percentage of Immigrants from Latin America in Lenexa, KS
RELATED REPORTS & OPTIONS
Latin America
Lenexa
Compare Zip Codes
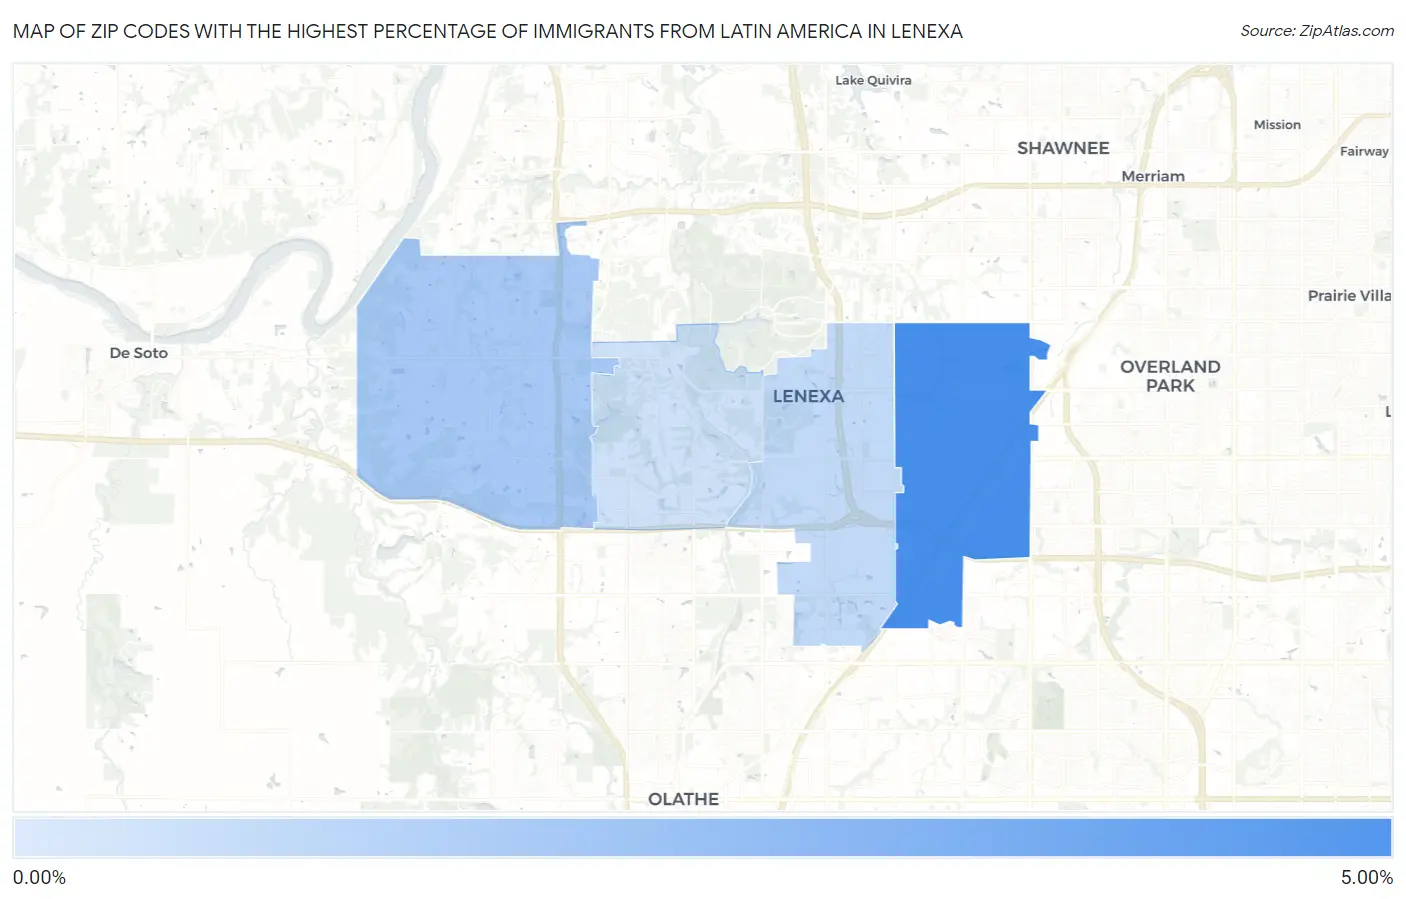
Map of Zip Codes with the Highest Percentage of Immigrants from Latin America in Lenexa
0.00%
5.00%
Zip Codes with the Highest Percentage of Immigrants from Latin America in Lenexa, KS
| Zip Code | Latin America | vs State | vs National | |
| 1. | 66215 | 4.72% | 3.71%(+1.01)#42 | 6.84%(-2.13)#3,302 |
| 2. | 66227 | 1.71% | 3.71%(-2.00)#43 | 6.84%(-5.13)#3,303 |
| 3. | 66219 | 0.82% | 3.71%(-2.89)#44 | 6.84%(-6.02)#3,304 |
| 4. | 66220 | 0.44% | 3.71%(-3.27)#45 | 6.84%(-6.40)#3,305 |
1
Common Questions
What are the Top 3 Zip Codes with the Highest Percentage of Immigrants from Latin America in Lenexa, KS?
Top 3 Zip Codes with the Highest Percentage of Immigrants from Latin America in Lenexa, KS are:
What zip code has the Highest Percentage of Immigrants from Latin America in Lenexa, KS?
66215 has the Highest Percentage of Immigrants from Latin America in Lenexa, KS with 4.72%.
What is the Percentage of Immigrants from Latin America in Lenexa, KS?
Percentage of Immigrants from Latin America in Lenexa is 2.73%.
What is the Percentage of Immigrants from Latin America in Kansas?
Percentage of Immigrants from Latin America in Kansas is 3.71%.
What is the Percentage of Immigrants from Latin America in the United States?
Percentage of Immigrants from Latin America in the United States is 6.84%.