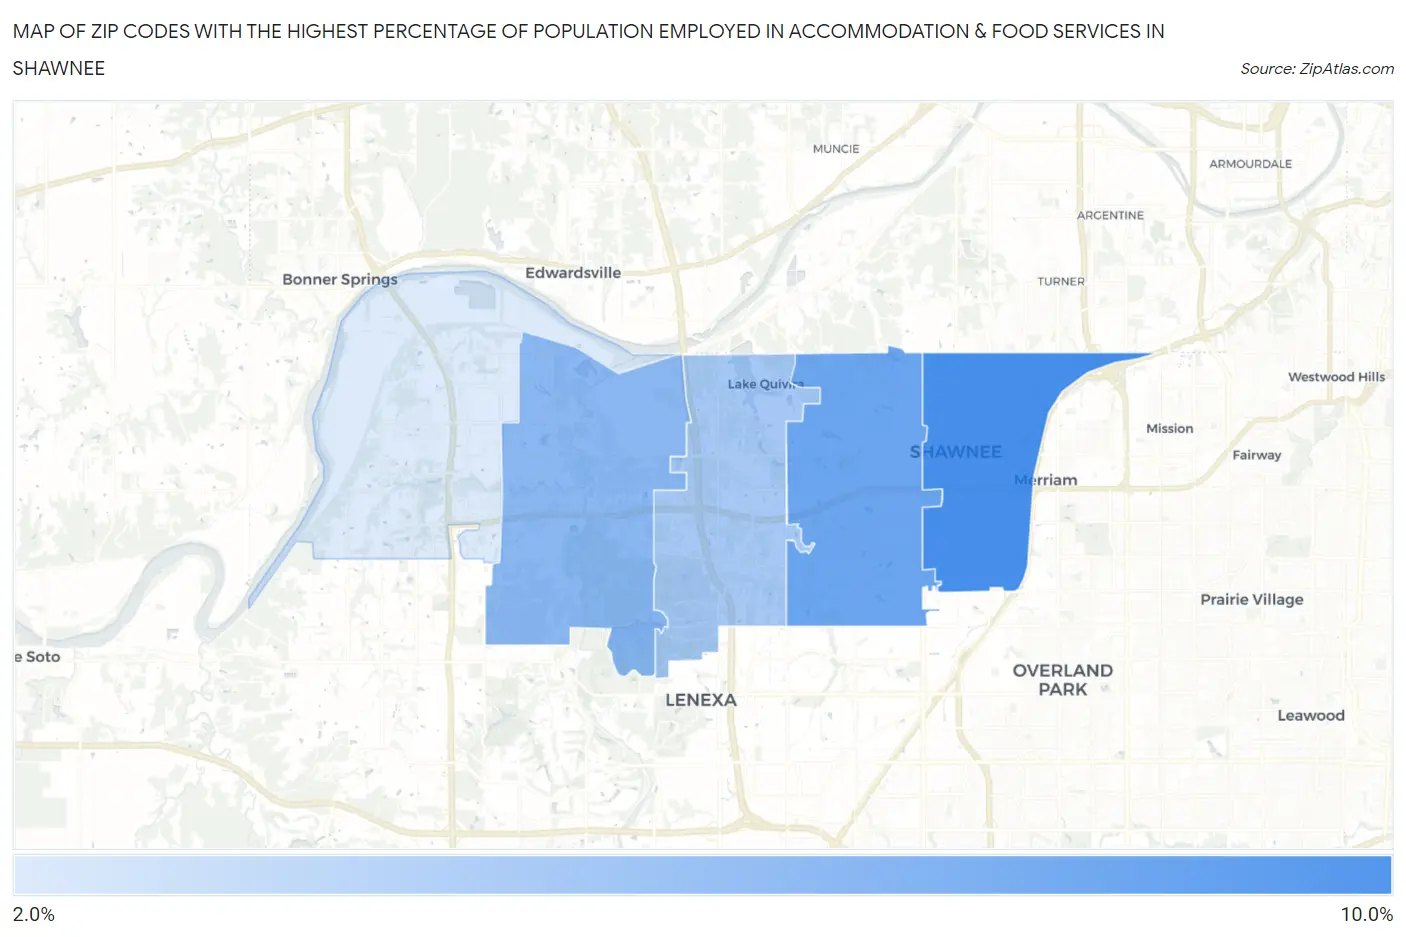
Zip Codes with the Highest Percentage of Population Employed in Accommodation & Food Services in Shawnee, KS
RELATED REPORTS & OPTIONS
Accommodation & Food Services
Shawnee
Compare Zip Codes
Map of Zip Codes with the Highest Percentage of Population Employed in Accommodation & Food Services in Shawnee
0.0%
10.0%
Zip Codes with the Highest Percentage of Population Employed in Accommodation & Food Services in Shawnee, KS
| Zip Code | % Employed | vs State | vs National | |
| 1. | 66203 | 8.6% | 6.2%(+2.39)#79 | 6.9%(+1.73)#6,624 |
| 2. | 66216 | 7.1% | 6.2%(+0.846)#121 | 6.9%(+0.189)#10,131 |
| 3. | 66218 | 5.9% | 6.2%(-0.364)#189 | 6.9%(-1.02)#13,916 |
| 4. | 66217 | 4.8% | 6.2%(-1.38)#240 | 6.9%(-2.04)#17,342 |
| 5. | 66226 | 2.6% | 6.2%(-3.58)#396 | 6.9%(-4.24)#24,148 |
1
Common Questions
What are the Top 3 Zip Codes with the Highest Percentage of Population Employed in Accommodation & Food Services in Shawnee, KS?
Top 3 Zip Codes with the Highest Percentage of Population Employed in Accommodation & Food Services in Shawnee, KS are:
What zip code has the Highest Percentage of Population Employed in Accommodation & Food Services in Shawnee, KS?
66203 has the Highest Percentage of Population Employed in Accommodation & Food Services in Shawnee, KS with 8.6%.
What is the Percentage of Population Employed in Accommodation & Food Services in Shawnee, KS?
Percentage of Population Employed in Accommodation & Food Services in Shawnee is 6.0%.
What is the Percentage of Population Employed in Accommodation & Food Services in Kansas?
Percentage of Population Employed in Accommodation & Food Services in Kansas is 6.2%.
What is the Percentage of Population Employed in Accommodation & Food Services in the United States?
Percentage of Population Employed in Accommodation & Food Services in the United States is 6.9%.