Zip Codes with the Highest Percentage of Population Employed in Accommodation & Food Services in Mission, KS
RELATED REPORTS & OPTIONS
Accommodation & Food Services
Mission
Compare Zip Codes
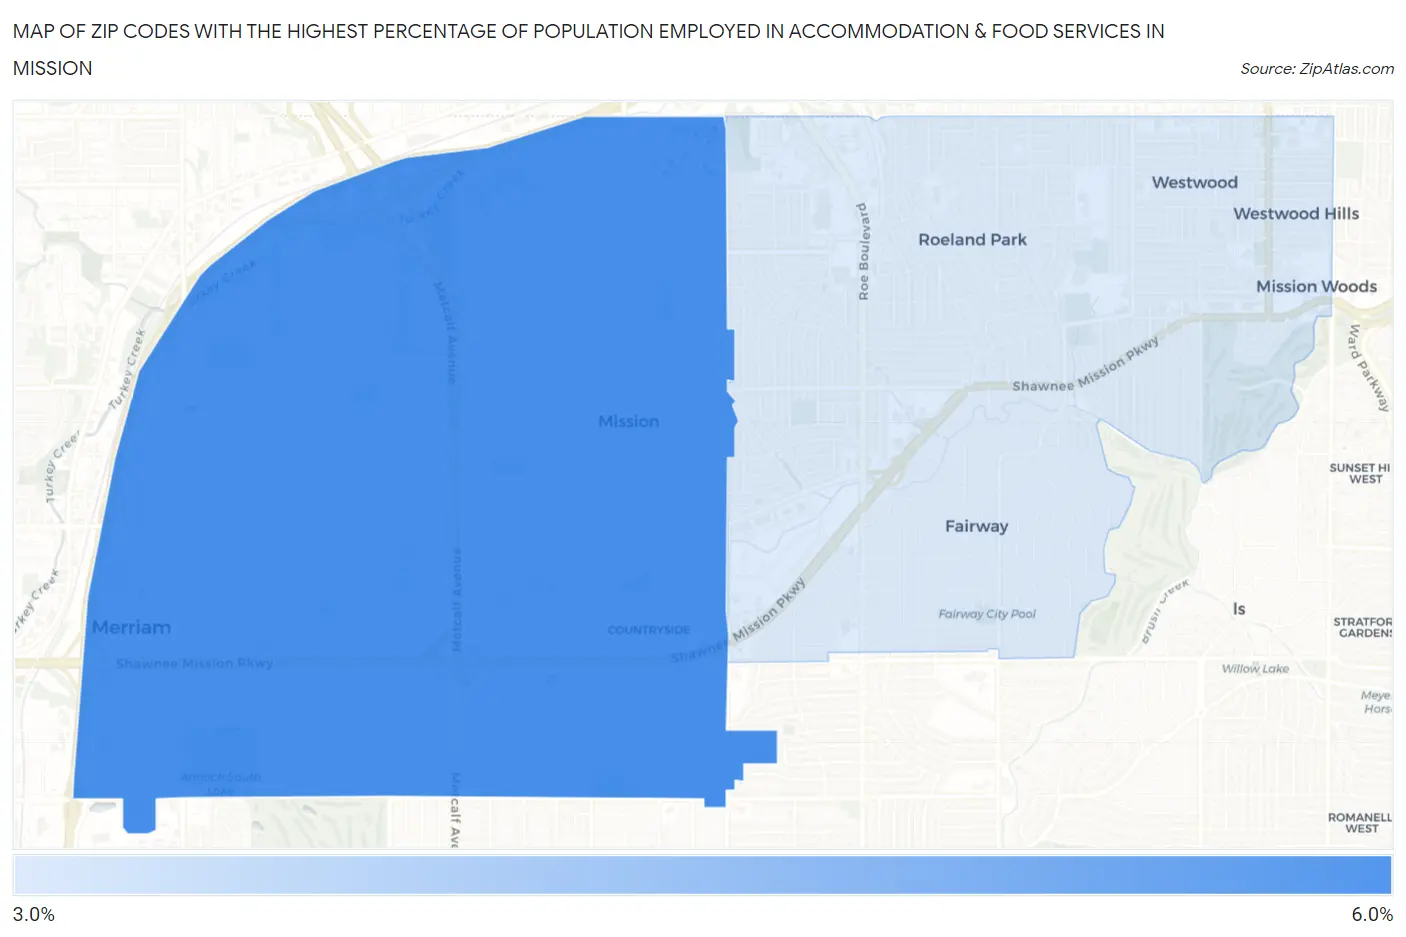
Map of Zip Codes with the Highest Percentage of Population Employed in Accommodation & Food Services in Mission
0.0%
6.0%
Zip Codes with the Highest Percentage of Population Employed in Accommodation & Food Services in Mission, KS
| Zip Code | % Employed | vs State | vs National | |
| 1. | 66202 | 5.2% | 6.2%(-1.06)#222 | 6.9%(-1.72)#16,240 |
| 2. | 66205 | 3.8% | 6.2%(-2.45)#309 | 6.9%(-3.11)#20,882 |
1
Common Questions
What are the Top Zip Codes with the Highest Percentage of Population Employed in Accommodation & Food Services in Mission, KS?
Top Zip Codes with the Highest Percentage of Population Employed in Accommodation & Food Services in Mission, KS are:
What zip code has the Highest Percentage of Population Employed in Accommodation & Food Services in Mission, KS?
66202 has the Highest Percentage of Population Employed in Accommodation & Food Services in Mission, KS with 5.2%.
What is the Percentage of Population Employed in Accommodation & Food Services in Mission, KS?
Percentage of Population Employed in Accommodation & Food Services in Mission is 2.6%.
What is the Percentage of Population Employed in Accommodation & Food Services in Kansas?
Percentage of Population Employed in Accommodation & Food Services in Kansas is 6.2%.
What is the Percentage of Population Employed in Accommodation & Food Services in the United States?
Percentage of Population Employed in Accommodation & Food Services in the United States is 6.9%.