Zip Codes with the Highest Percentage of Population Employed in Accommodation & Food Services in Manhattan, KS
RELATED REPORTS & OPTIONS
Accommodation & Food Services
Manhattan
Compare Zip Codes
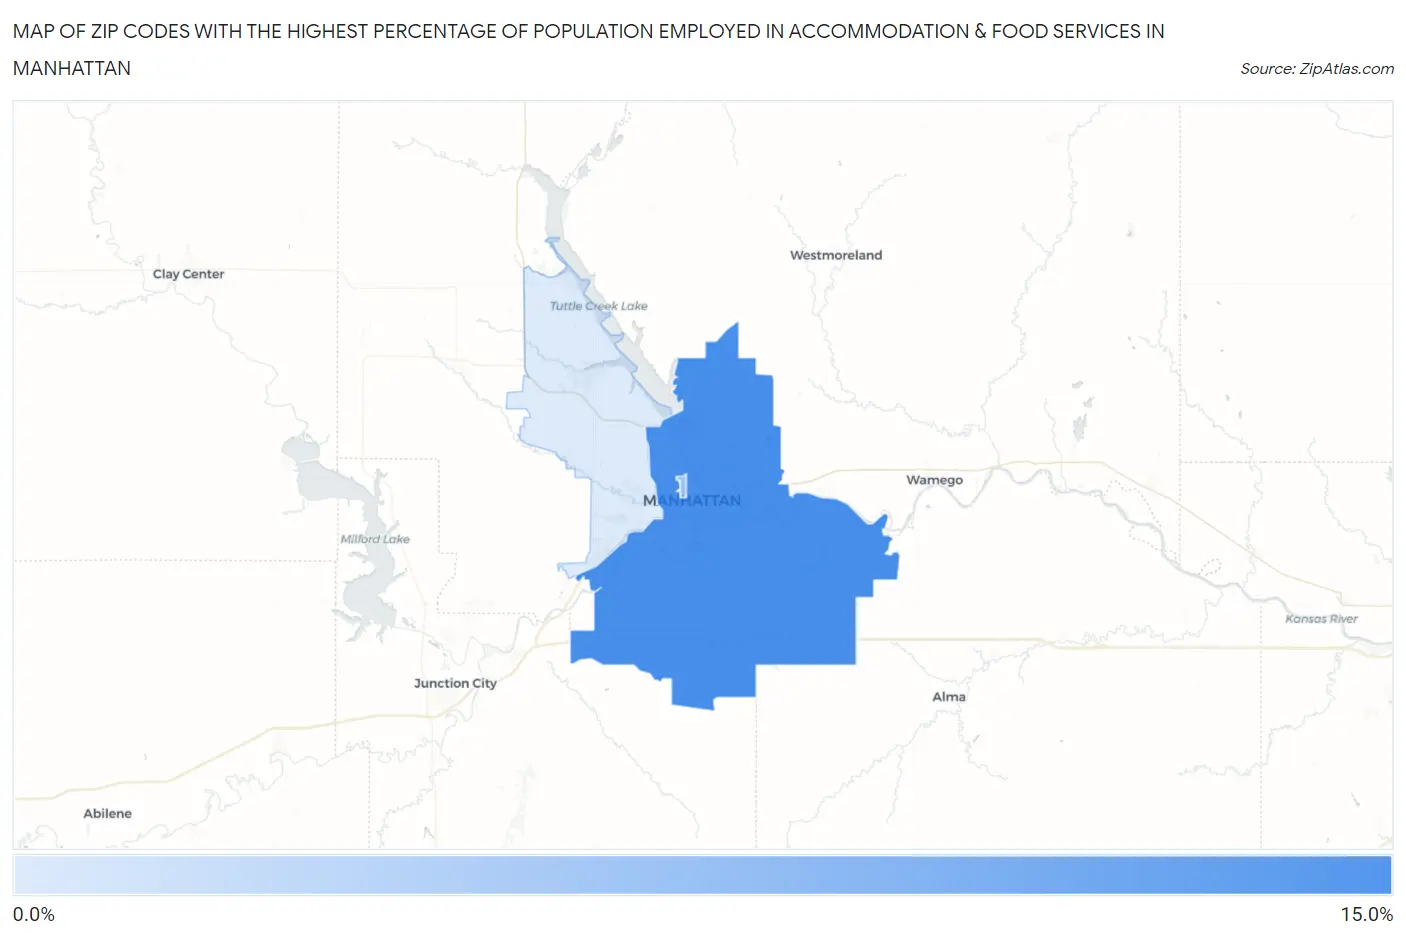
Map of Zip Codes with the Highest Percentage of Population Employed in Accommodation & Food Services in Manhattan
0.0%
15.0%
Zip Codes with the Highest Percentage of Population Employed in Accommodation & Food Services in Manhattan, KS
| Zip Code | % Employed | vs State | vs National | |
| 1. | 66502 | 11.3% | 6.2%(+5.07)#48 | 6.9%(+4.41)#3,328 |
| 2. | 66506 | 5.6% | 6.2%(-0.630)#202 | 6.9%(-1.29)#14,724 |
| 3. | 66503 | 1.7% | 6.2%(-4.57)#463 | 6.9%(-5.23)#26,216 |
1
Common Questions
What are the Top Zip Codes with the Highest Percentage of Population Employed in Accommodation & Food Services in Manhattan, KS?
Top Zip Codes with the Highest Percentage of Population Employed in Accommodation & Food Services in Manhattan, KS are:
What zip code has the Highest Percentage of Population Employed in Accommodation & Food Services in Manhattan, KS?
66502 has the Highest Percentage of Population Employed in Accommodation & Food Services in Manhattan, KS with 11.3%.
What is the Percentage of Population Employed in Accommodation & Food Services in Manhattan, KS?
Percentage of Population Employed in Accommodation & Food Services in Manhattan is 9.7%.
What is the Percentage of Population Employed in Accommodation & Food Services in Kansas?
Percentage of Population Employed in Accommodation & Food Services in Kansas is 6.2%.
What is the Percentage of Population Employed in Accommodation & Food Services in the United States?
Percentage of Population Employed in Accommodation & Food Services in the United States is 6.9%.