White/Caucasian vs Immigrants from Argentina Median Female Earnings
COMPARE
White/Caucasian
Immigrants from Argentina
Median Female Earnings
Median Female Earnings Comparison
Whites/Caucasians
Immigrants from Argentina
$37,531
MEDIAN FEMALE EARNINGS
1.1/ 100
METRIC RATING
254th/ 347
METRIC RANK
$41,554
MEDIAN FEMALE EARNINGS
97.9/ 100
METRIC RATING
103rd/ 347
METRIC RANK
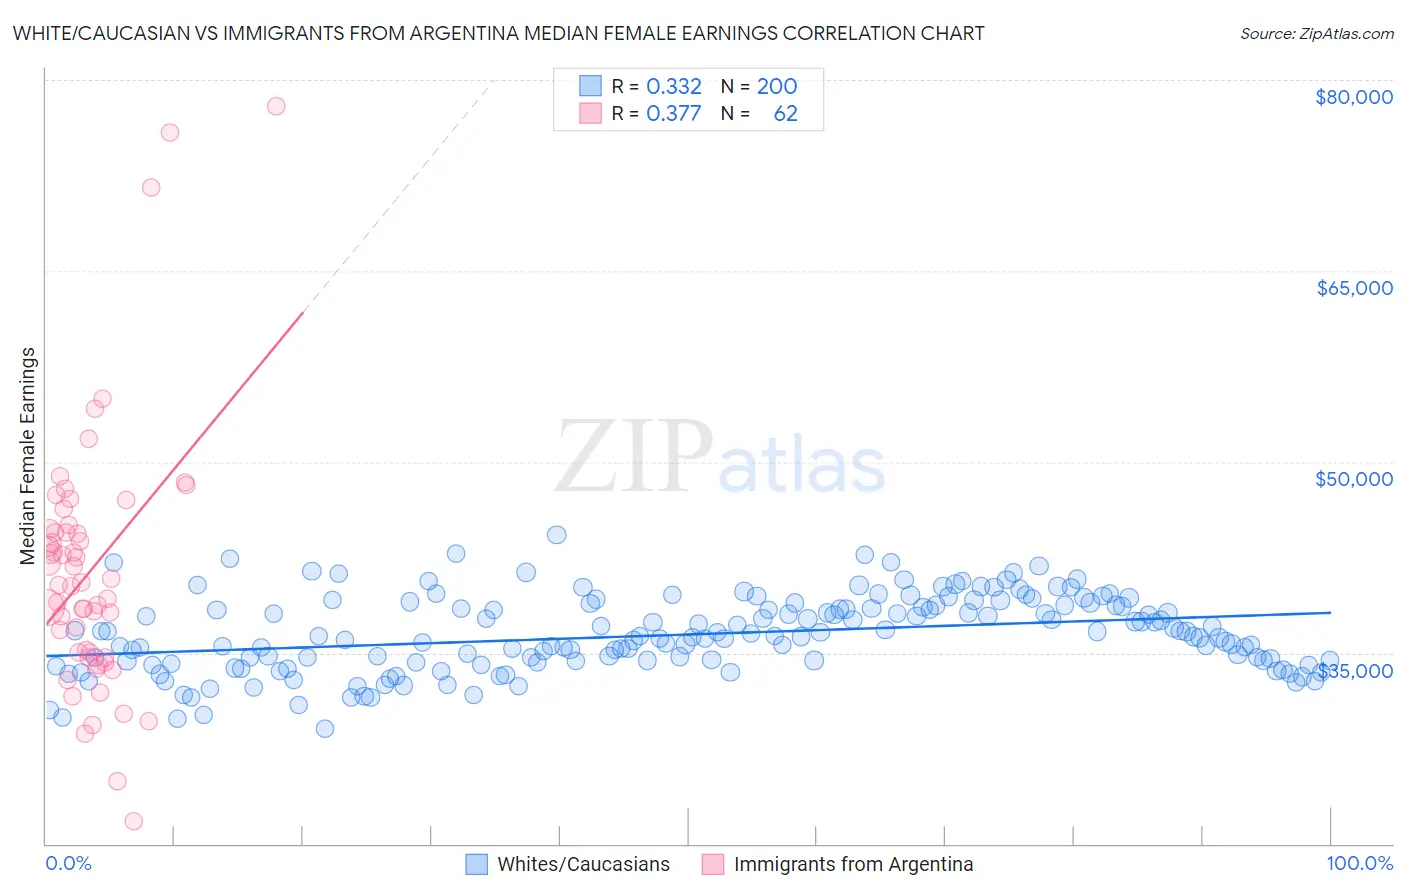
White/Caucasian vs Immigrants from Argentina Median Female Earnings Correlation Chart
The statistical analysis conducted on geographies consisting of 581,839,033 people shows a mild positive correlation between the proportion of Whites/Caucasians and median female earnings in the United States with a correlation coefficient (R) of 0.332 and weighted average of $37,531. Similarly, the statistical analysis conducted on geographies consisting of 264,373,843 people shows a mild positive correlation between the proportion of Immigrants from Argentina and median female earnings in the United States with a correlation coefficient (R) of 0.377 and weighted average of $41,554, a difference of 10.7%.
Median Female Earnings Correlation Summary
| Measurement | White/Caucasian | Immigrants from Argentina |
| Minimum | $29,061 | $21,743 |
| Maximum | $44,249 | $77,902 |
| Range | $15,187 | $56,159 |
| Mean | $36,445 | $41,489 |
| Median | $36,298 | $40,427 |
| Interquartile 25% (IQ1) | $34,375 | $34,985 |
| Interquartile 75% (IQ3) | $38,681 | $44,732 |
| Interquartile Range (IQR) | $4,306 | $9,747 |
| Standard Deviation (Sample) | $2,956 | $10,181 |
| Standard Deviation (Population) | $2,949 | $10,099 |
Similar Demographics by Median Female Earnings
Demographics Similar to Whites/Caucasians by Median Female Earnings
In terms of median female earnings, the demographic groups most similar to Whites/Caucasians are Colville ($37,514, a difference of 0.040%), Samoan ($37,498, a difference of 0.090%), Hawaiian ($37,497, a difference of 0.090%), Belizean ($37,429, a difference of 0.27%), and Scotch-Irish ($37,383, a difference of 0.39%).
| Demographics | Rating | Rank | Median Female Earnings |
| Immigrants | Somalia | 2.4 /100 | #247 | Tragic $37,914 |
| Alaskan Athabascans | 2.3 /100 | #248 | Tragic $37,905 |
| Swiss | 2.3 /100 | #249 | Tragic $37,904 |
| Immigrants | Iraq | 2.2 /100 | #250 | Tragic $37,864 |
| Welsh | 2.1 /100 | #251 | Tragic $37,856 |
| Immigrants | Dominica | 2.0 /100 | #252 | Tragic $37,825 |
| Danes | 1.6 /100 | #253 | Tragic $37,730 |
| Whites/Caucasians | 1.1 /100 | #254 | Tragic $37,531 |
| Colville | 1.1 /100 | #255 | Tragic $37,514 |
| Samoans | 1.0 /100 | #256 | Tragic $37,498 |
| Hawaiians | 1.0 /100 | #257 | Tragic $37,497 |
| Belizeans | 0.9 /100 | #258 | Tragic $37,429 |
| Scotch-Irish | 0.8 /100 | #259 | Tragic $37,383 |
| Dutch | 0.7 /100 | #260 | Tragic $37,339 |
| Malaysians | 0.7 /100 | #261 | Tragic $37,298 |
Demographics Similar to Immigrants from Argentina by Median Female Earnings
In terms of median female earnings, the demographic groups most similar to Immigrants from Argentina are Immigrants from Zimbabwe ($41,527, a difference of 0.060%), Italian ($41,505, a difference of 0.12%), Immigrants from Eritrea ($41,485, a difference of 0.17%), Palestinian ($41,484, a difference of 0.17%), and Immigrants from Poland ($41,630, a difference of 0.18%).
| Demographics | Rating | Rank | Median Female Earnings |
| South Africans | 98.8 /100 | #96 | Exceptional $41,825 |
| Immigrants | Hungary | 98.8 /100 | #97 | Exceptional $41,820 |
| Immigrants | Scotland | 98.7 /100 | #98 | Exceptional $41,771 |
| Immigrants | Barbados | 98.4 /100 | #99 | Exceptional $41,685 |
| Romanians | 98.3 /100 | #100 | Exceptional $41,663 |
| Immigrants | Fiji | 98.3 /100 | #101 | Exceptional $41,656 |
| Immigrants | Poland | 98.2 /100 | #102 | Exceptional $41,630 |
| Immigrants | Argentina | 97.9 /100 | #103 | Exceptional $41,554 |
| Immigrants | Zimbabwe | 97.8 /100 | #104 | Exceptional $41,527 |
| Italians | 97.7 /100 | #105 | Exceptional $41,505 |
| Immigrants | Eritrea | 97.6 /100 | #106 | Exceptional $41,485 |
| Palestinians | 97.6 /100 | #107 | Exceptional $41,484 |
| Jordanians | 97.5 /100 | #108 | Exceptional $41,464 |
| Chinese | 97.5 /100 | #109 | Exceptional $41,461 |
| Immigrants | Western Asia | 97.0 /100 | #110 | Exceptional $41,375 |