White/Caucasian vs Tsimshian Median Family Income
COMPARE
White/Caucasian
Tsimshian
Median Family Income
Median Family Income Comparison
Whites/Caucasians
Tsimshian
$99,800
MEDIAN FAMILY INCOME
18.7/ 100
METRIC RATING
202nd/ 347
METRIC RANK
$101,543
MEDIAN FAMILY INCOME
35.9/ 100
METRIC RATING
182nd/ 347
METRIC RANK
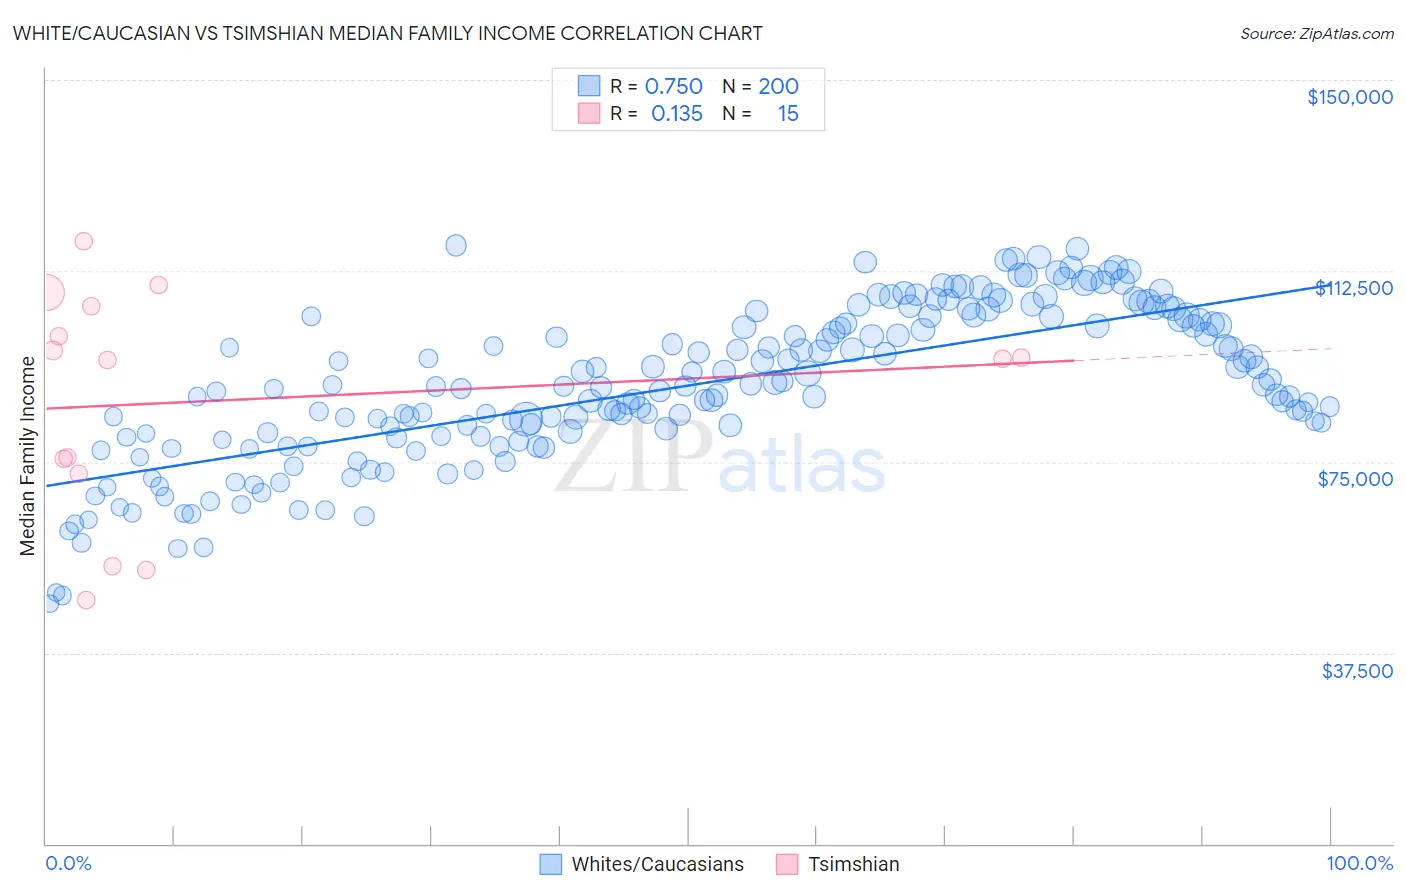
White/Caucasian vs Tsimshian Median Family Income Correlation Chart
The statistical analysis conducted on geographies consisting of 582,814,142 people shows a strong positive correlation between the proportion of Whites/Caucasians and median family income in the United States with a correlation coefficient (R) of 0.750 and weighted average of $99,800. Similarly, the statistical analysis conducted on geographies consisting of 15,626,544 people shows a poor positive correlation between the proportion of Tsimshian and median family income in the United States with a correlation coefficient (R) of 0.135 and weighted average of $101,543, a difference of 1.8%.
Median Family Income Correlation Summary
| Measurement | White/Caucasian | Tsimshian |
| Minimum | $47,087 | $47,917 |
| Maximum | $117,539 | $118,333 |
| Range | $70,452 | $70,416 |
| Mean | $89,997 | $86,976 |
| Median | $89,813 | $95,278 |
| Interquartile 25% (IQ1) | $80,036 | $72,646 |
| Interquartile 75% (IQ3) | $102,904 | $105,493 |
| Interquartile Range (IQR) | $22,868 | $32,847 |
| Standard Deviation (Sample) | $15,237 | $22,202 |
| Standard Deviation (Population) | $15,199 | $21,449 |
Demographics Similar to Whites/Caucasians and Tsimshian by Median Family Income
In terms of median family income, the demographic groups most similar to Whites/Caucasians are Immigrants from Thailand ($99,840, a difference of 0.040%), Spanish ($99,977, a difference of 0.18%), Yugoslavian ($100,119, a difference of 0.32%), Immigrants from Africa ($100,256, a difference of 0.46%), and Immigrants from Cameroon ($100,289, a difference of 0.49%). Similarly, the demographic groups most similar to Tsimshian are Kenyan ($101,417, a difference of 0.12%), Immigrants from Costa Rica ($101,354, a difference of 0.19%), Dutch ($101,192, a difference of 0.35%), Celtic ($101,139, a difference of 0.40%), and Tlingit-Haida ($101,092, a difference of 0.45%).
| Demographics | Rating | Rank | Median Family Income |
| Tsimshian | 35.9 /100 | #182 | Fair $101,543 |
| Kenyans | 34.5 /100 | #183 | Fair $101,417 |
| Immigrants | Costa Rica | 33.7 /100 | #184 | Fair $101,354 |
| Dutch | 31.9 /100 | #185 | Fair $101,192 |
| Celtics | 31.3 /100 | #186 | Fair $101,139 |
| Tlingit-Haida | 30.8 /100 | #187 | Fair $101,092 |
| Guamanians/Chamorros | 30.5 /100 | #188 | Fair $101,061 |
| Immigrants | Portugal | 29.6 /100 | #189 | Fair $100,984 |
| Immigrants | Immigrants | 29.4 /100 | #190 | Fair $100,962 |
| Colombians | 27.2 /100 | #191 | Fair $100,750 |
| Immigrants | Kenya | 26.5 /100 | #192 | Fair $100,679 |
| Iraqis | 26.3 /100 | #193 | Fair $100,658 |
| Uruguayans | 26.3 /100 | #194 | Fair $100,656 |
| Immigrants | South America | 23.9 /100 | #195 | Fair $100,414 |
| Samoans | 23.3 /100 | #196 | Fair $100,344 |
| Immigrants | Cameroon | 22.8 /100 | #197 | Fair $100,289 |
| Immigrants | Africa | 22.5 /100 | #198 | Fair $100,256 |
| Yugoslavians | 21.3 /100 | #199 | Fair $100,119 |
| Spanish | 20.1 /100 | #200 | Fair $99,977 |
| Immigrants | Thailand | 19.0 /100 | #201 | Poor $99,840 |
| Whites/Caucasians | 18.7 /100 | #202 | Poor $99,800 |