Zip Codes with the Highest Percentage of Population Employed in Arts, Media & Entertainment in Indianapolis, IN
RELATED REPORTS & OPTIONS
Arts, Media & Entertainment
Indianapolis
Compare Zip Codes
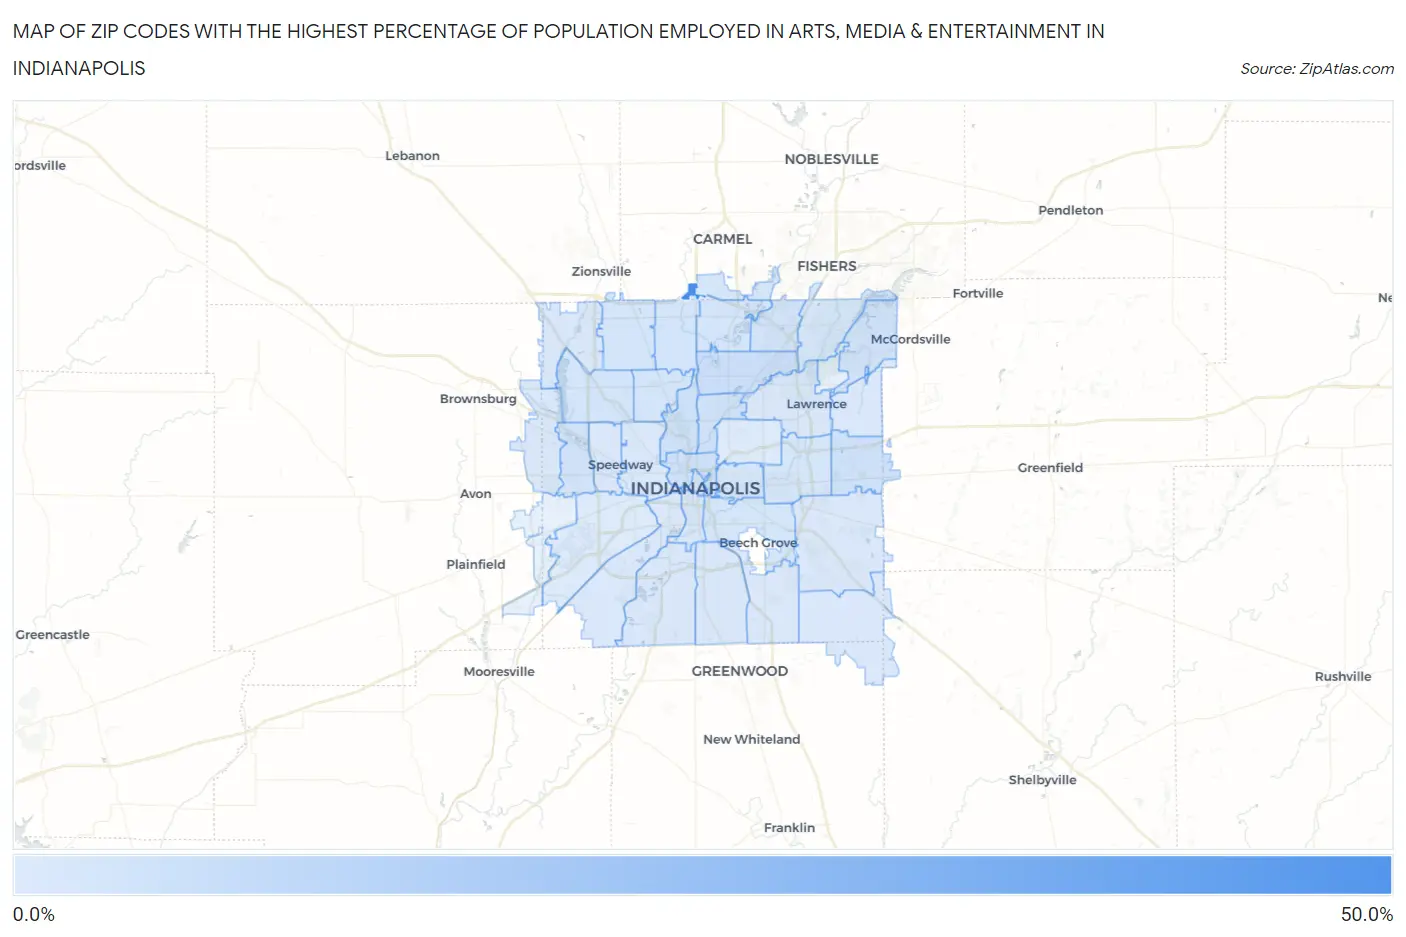
Map of Zip Codes with the Highest Percentage of Population Employed in Arts, Media & Entertainment in Indianapolis
0.0%
50.0%
Zip Codes with the Highest Percentage of Population Employed in Arts, Media & Entertainment in Indianapolis, IN
| Zip Code | % Employed | vs State | vs National | |
| 1. | 46290 | 44.8% | 1.4%(+43.4)#1 | 2.1%(+42.8)#18 |
| 2. | 46220 | 4.7% | 1.4%(+3.24)#14 | 2.1%(+2.59)#1,729 |
| 3. | 46205 | 3.8% | 1.4%(+2.43)#24 | 2.1%(+1.78)#2,566 |
| 4. | 46229 | 3.8% | 1.4%(+2.42)#25 | 2.1%(+1.77)#2,582 |
| 5. | 46202 | 3.6% | 1.4%(+2.15)#30 | 2.1%(+1.50)#2,977 |
| 6. | 46208 | 3.6% | 1.4%(+2.14)#31 | 2.1%(+1.49)#2,985 |
| 7. | 46250 | 3.3% | 1.4%(+1.86)#41 | 2.1%(+1.21)#3,472 |
| 8. | 46214 | 3.0% | 1.4%(+1.62)#53 | 2.1%(+0.969)#4,015 |
| 9. | 46236 | 2.9% | 1.4%(+1.50)#63 | 2.1%(+0.851)#4,316 |
| 10. | 46240 | 2.7% | 1.4%(+1.24)#73 | 2.1%(+0.591)#5,056 |
| 11. | 46254 | 2.6% | 1.4%(+1.22)#76 | 2.1%(+0.568)#5,145 |
| 12. | 46204 | 2.6% | 1.4%(+1.15)#79 | 2.1%(+0.500)#5,365 |
| 13. | 46228 | 2.2% | 1.4%(+0.835)#99 | 2.1%(+0.187)#6,616 |
| 14. | 46260 | 2.2% | 1.4%(+0.829)#100 | 2.1%(+0.180)#6,645 |
| 15. | 46268 | 2.2% | 1.4%(+0.825)#101 | 2.1%(+0.176)#6,659 |
| 16. | 46201 | 2.1% | 1.4%(+0.696)#108 | 2.1%(+0.048)#7,228 |
| 17. | 46280 | 2.0% | 1.4%(+0.629)#114 | 2.1%(-0.020)#7,590 |
| 18. | 46203 | 2.0% | 1.4%(+0.569)#118 | 2.1%(-0.080)#7,906 |
| 19. | 46219 | 2.0% | 1.4%(+0.546)#120 | 2.1%(-0.103)#8,041 |
| 20. | 46256 | 1.9% | 1.4%(+0.492)#128 | 2.1%(-0.157)#8,349 |
| 21. | 46234 | 1.6% | 1.4%(+0.223)#164 | 2.1%(-0.425)#10,097 |
| 22. | 46225 | 1.5% | 1.4%(+0.102)#180 | 2.1%(-0.547)#10,892 |
| 23. | 46278 | 1.5% | 1.4%(+0.051)#194 | 2.1%(-0.597)#11,234 |
| 24. | 46217 | 1.5% | 1.4%(+0.042)#195 | 2.1%(-0.607)#11,324 |
| 25. | 46227 | 1.4% | 1.4%(-0.036)#207 | 2.1%(-0.685)#11,875 |
| 26. | 46226 | 1.2% | 1.4%(-0.235)#239 | 2.1%(-0.884)#13,378 |
| 27. | 46239 | 1.0% | 1.4%(-0.373)#272 | 2.1%(-1.02)#14,509 |
| 28. | 46259 | 1.0% | 1.4%(-0.374)#273 | 2.1%(-1.02)#14,513 |
| 29. | 46235 | 0.97% | 1.4%(-0.443)#290 | 2.1%(-1.09)#15,067 |
| 30. | 46237 | 0.94% | 1.4%(-0.469)#298 | 2.1%(-1.12)#15,293 |
| 31. | 46224 | 0.82% | 1.4%(-0.596)#323 | 2.1%(-1.24)#16,281 |
| 32. | 46221 | 0.74% | 1.4%(-0.671)#345 | 2.1%(-1.32)#16,901 |
| 33. | 46222 | 0.67% | 1.4%(-0.745)#368 | 2.1%(-1.39)#17,521 |
| 34. | 46241 | 0.40% | 1.4%(-1.01)#437 | 2.1%(-1.66)#19,623 |
| 35. | 46218 | 0.21% | 1.4%(-1.20)#482 | 2.1%(-1.85)#20,914 |
1
Common Questions
What are the Top 10 Zip Codes with the Highest Percentage of Population Employed in Arts, Media & Entertainment in Indianapolis, IN?
Top 10 Zip Codes with the Highest Percentage of Population Employed in Arts, Media & Entertainment in Indianapolis, IN are:
What zip code has the Highest Percentage of Population Employed in Arts, Media & Entertainment in Indianapolis, IN?
46290 has the Highest Percentage of Population Employed in Arts, Media & Entertainment in Indianapolis, IN with 44.8%.
What is the Percentage of Population Employed in Arts, Media & Entertainment in Indianapolis, IN?
Percentage of Population Employed in Arts, Media & Entertainment in Indianapolis is 2.0%.
What is the Percentage of Population Employed in Arts, Media & Entertainment in Indiana?
Percentage of Population Employed in Arts, Media & Entertainment in Indiana is 1.4%.
What is the Percentage of Population Employed in Arts, Media & Entertainment in the United States?
Percentage of Population Employed in Arts, Media & Entertainment in the United States is 2.1%.