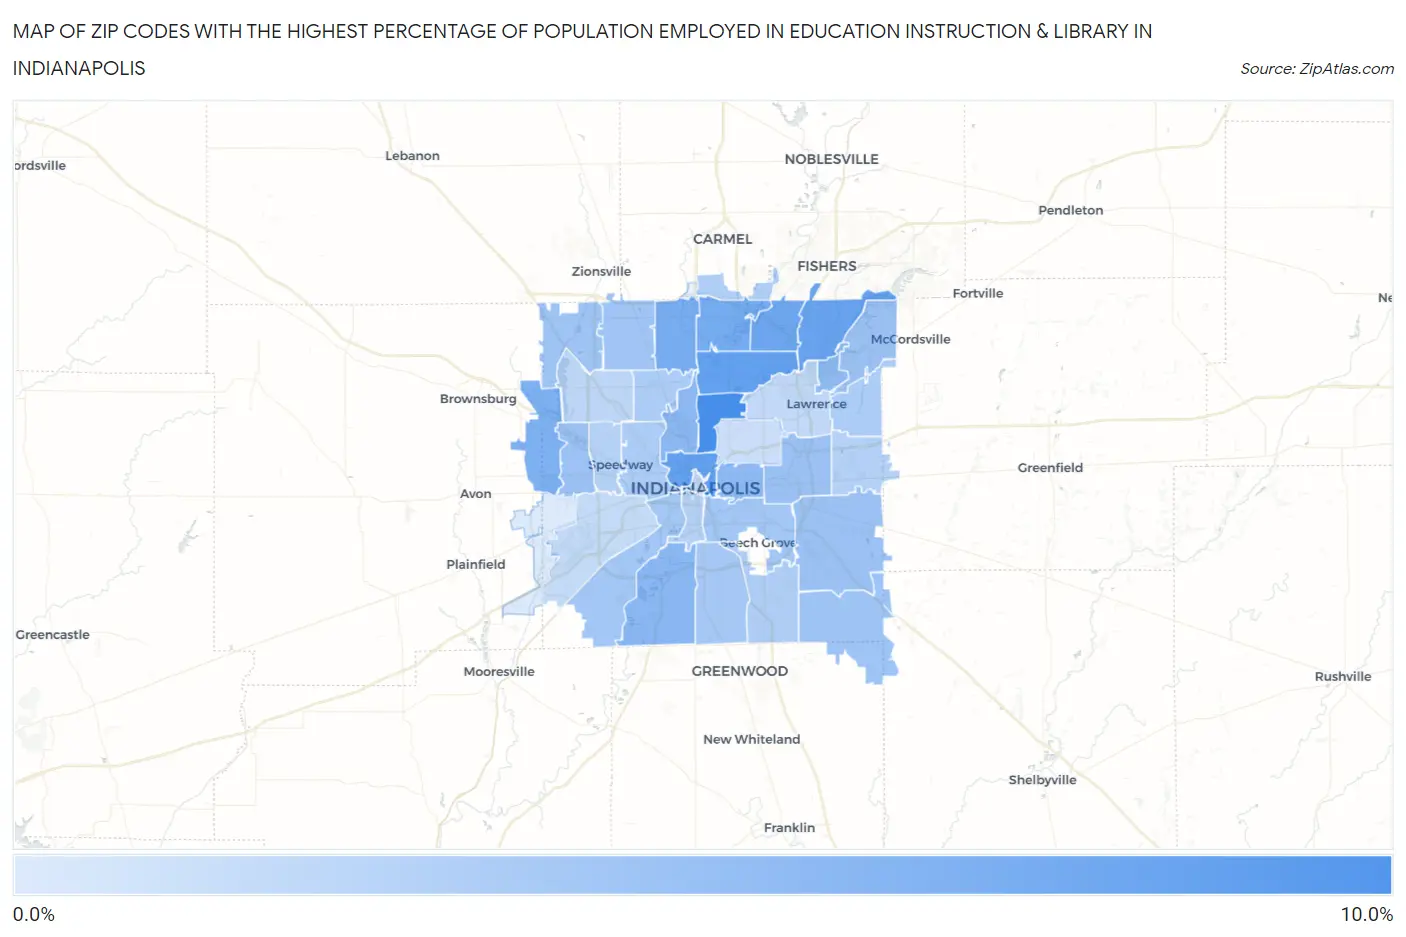
Zip Codes with the Highest Percentage of Population Employed in Education Instruction & Library in Indianapolis, IN
RELATED REPORTS & OPTIONS
Education Instruction & Library
Indianapolis
Compare Zip Codes
Map of Zip Codes with the Highest Percentage of Population Employed in Education Instruction & Library in Indianapolis
0.0%
10.0%
Zip Codes with the Highest Percentage of Population Employed in Education Instruction & Library in Indianapolis, IN
| Zip Code | % Employed | vs State | vs National | |
| 1. | 46205 | 9.6% | 5.8%(+3.88)#58 | 6.2%(+3.45)#4,350 |
| 2. | 46220 | 8.0% | 5.8%(+2.29)#94 | 6.2%(+1.86)#7,062 |
| 3. | 46202 | 8.0% | 5.8%(+2.27)#97 | 6.2%(+1.84)#7,095 |
| 4. | 46256 | 7.7% | 5.8%(+1.99)#107 | 6.2%(+1.57)#7,761 |
| 5. | 46250 | 7.4% | 5.8%(+1.69)#125 | 6.2%(+1.26)#8,574 |
| 6. | 46240 | 7.1% | 5.8%(+1.32)#144 | 6.2%(+0.900)#9,659 |
| 7. | 46260 | 6.9% | 5.8%(+1.11)#160 | 6.2%(+0.684)#10,322 |
| 8. | 46234 | 6.5% | 5.8%(+0.770)#179 | 6.2%(+0.345)#11,521 |
| 9. | 46217 | 5.9% | 5.8%(+0.159)#226 | 6.2%(-0.266)#13,813 |
| 10. | 46208 | 5.8% | 5.8%(+0.090)#230 | 6.2%(-0.335)#14,113 |
| 11. | 46201 | 5.7% | 5.8%(-0.056)#245 | 6.2%(-0.482)#14,728 |
| 12. | 46216 | 5.6% | 5.8%(-0.162)#259 | 6.2%(-0.587)#15,169 |
| 13. | 46236 | 5.0% | 5.8%(-0.722)#315 | 6.2%(-1.15)#17,491 |
| 14. | 46219 | 5.0% | 5.8%(-0.741)#317 | 6.2%(-1.17)#17,570 |
| 15. | 46239 | 5.0% | 5.8%(-0.800)#322 | 6.2%(-1.22)#17,832 |
| 16. | 46214 | 4.9% | 5.8%(-0.857)#329 | 6.2%(-1.28)#18,047 |
| 17. | 46278 | 4.8% | 5.8%(-0.947)#342 | 6.2%(-1.37)#18,451 |
| 18. | 46259 | 4.8% | 5.8%(-0.966)#345 | 6.2%(-1.39)#18,524 |
| 19. | 46268 | 4.7% | 5.8%(-1.08)#360 | 6.2%(-1.50)#19,005 |
| 20. | 46221 | 4.6% | 5.8%(-1.20)#376 | 6.2%(-1.63)#19,512 |
| 21. | 46203 | 4.5% | 5.8%(-1.27)#379 | 6.2%(-1.69)#19,751 |
| 22. | 46227 | 4.5% | 5.8%(-1.29)#382 | 6.2%(-1.71)#19,859 |
| 23. | 46222 | 4.0% | 5.8%(-1.75)#440 | 6.2%(-2.17)#21,622 |
| 24. | 46235 | 4.0% | 5.8%(-1.75)#441 | 6.2%(-2.18)#21,638 |
| 25. | 46228 | 4.0% | 5.8%(-1.78)#442 | 6.2%(-2.20)#21,735 |
| 26. | 46237 | 4.0% | 5.8%(-1.80)#447 | 6.2%(-2.23)#21,821 |
| 27. | 46280 | 3.9% | 5.8%(-1.89)#456 | 6.2%(-2.31)#22,137 |
| 28. | 46229 | 3.6% | 5.8%(-2.13)#474 | 6.2%(-2.55)#22,942 |
| 29. | 46224 | 3.5% | 5.8%(-2.24)#483 | 6.2%(-2.67)#23,318 |
| 30. | 46225 | 3.5% | 5.8%(-2.25)#484 | 6.2%(-2.68)#23,357 |
| 31. | 46254 | 3.2% | 5.8%(-2.56)#511 | 6.2%(-2.99)#24,365 |
| 32. | 46204 | 3.2% | 5.8%(-2.58)#513 | 6.2%(-3.01)#24,403 |
| 33. | 46226 | 2.9% | 5.8%(-2.89)#542 | 6.2%(-3.31)#25,146 |
| 34. | 46241 | 2.8% | 5.8%(-2.94)#545 | 6.2%(-3.36)#25,240 |
| 35. | 46218 | 2.4% | 5.8%(-3.37)#579 | 6.2%(-3.80)#26,240 |
| 36. | 46231 | 1.5% | 5.8%(-4.29)#640 | 6.2%(-4.72)#27,720 |
1
Common Questions
What are the Top 10 Zip Codes with the Highest Percentage of Population Employed in Education Instruction & Library in Indianapolis, IN?
Top 10 Zip Codes with the Highest Percentage of Population Employed in Education Instruction & Library in Indianapolis, IN are:
What zip code has the Highest Percentage of Population Employed in Education Instruction & Library in Indianapolis, IN?
46205 has the Highest Percentage of Population Employed in Education Instruction & Library in Indianapolis, IN with 9.6%.
What is the Percentage of Population Employed in Education Instruction & Library in Indianapolis, IN?
Percentage of Population Employed in Education Instruction & Library in Indianapolis is 5.1%.
What is the Percentage of Population Employed in Education Instruction & Library in Indiana?
Percentage of Population Employed in Education Instruction & Library in Indiana is 5.8%.
What is the Percentage of Population Employed in Education Instruction & Library in the United States?
Percentage of Population Employed in Education Instruction & Library in the United States is 6.2%.