Zip Codes with the Highest Percentage of Population with a Degree in Education in Indianapolis, IN

RELATED REPORTS & OPTIONS

Education
Population
Families and Households
Female Fertility
Female Fertility (Unmarried)
Race (Community Size)
Race (Percentage)
Ancestry (Community Size)
AfghanAfricanAlaskan AthabascanAlbanianAlsatianAmericanApacheArabArgentineanArmenianAustralianAustrianBahamianBangladeshiBarbadianBasqueBelgianBelizeanBhutaneseBlackfeetBolivianBrazilianBritishBritish West IndianBulgarianBurmeseCajunCanadianCelticCentral AmericanCentral American IndianCherokeeChickasawChileanChippewaChoctawColombianCosta RicanCroatianCrowCubanCzechCzechoslovakianDanishDominicanDutchEastern EuropeanEcuadorianEgyptianEnglishEstonianEthiopianEuropeanFilipinoFinnishFrenchFrench CanadianGermanGerman RussianGhanaianGreekGuamanian / ChamorroGuatemalanGuyaneseHaitianHonduranHopiHungarianIcelanderIndian (Asian)IndonesianInupiatIranianIraqiIrishIroquoisIsraeliItalianJamaicanJapaneseJordanianKenyanKoreanLaotianLatvianLebaneseLiberianLithuanianLuxembourgerMacedonianMalaysianMenomineeMexicanMexican American IndianMongolianMoroccanNative HawaiianNavajoNew ZealanderNicaraguanNigerianNorthern EuropeanNorwegianPakistaniPalestinianPanamanianPennsylvania GermanPeruvianPolishPortuguesePotawatomiPuerto RicanRomanianRussianSalvadoranSamoanScandinavianScotch-IrishScottishSeminoleSenegaleseSerbianSierra LeoneanSiouxSlavicSlovakSloveneSouth AfricanSouth AmericanSouth American IndianSpaniardSpanishSri LankanSubsaharan AfricanSudaneseSwedishSwissSyrianThaiTonganTrinidadian and TobagonianTurkishUgandanUkrainianUruguayanVenezuelanVietnameseWelshWest IndianYugoslavianZimbabwean
Ancestry (Percentage)
AfghanAfricanAlaskan AthabascanAlbanianAlsatianAmericanApacheArabArgentineanArmenianAustralianAustrianBahamianBangladeshiBarbadianBasqueBelgianBelizeanBhutaneseBlackfeetBolivianBrazilianBritishBritish West IndianBulgarianBurmeseCajunCanadianCelticCentral AmericanCentral American IndianCherokeeChickasawChileanChippewaChoctawColombianCosta RicanCroatianCrowCubanCzechCzechoslovakianDanishDominicanDutchEastern EuropeanEcuadorianEgyptianEnglishEstonianEthiopianEuropeanFilipinoFinnishFrenchFrench CanadianGermanGerman RussianGhanaianGreekGuamanian / ChamorroGuatemalanGuyaneseHaitianHonduranHopiHungarianIcelanderIndian (Asian)IndonesianInupiatIranianIraqiIrishIroquoisIsraeliItalianJamaicanJapaneseJordanianKenyanKoreanLaotianLatvianLebaneseLiberianLithuanianLuxembourgerMacedonianMalaysianMenomineeMexicanMexican American IndianMongolianMoroccanNative HawaiianNavajoNew ZealanderNicaraguanNigerianNorthern EuropeanNorwegianPakistaniPalestinianPanamanianPennsylvania GermanPeruvianPolishPortuguesePotawatomiPuerto RicanRomanianRussianSalvadoranSamoanScandinavianScotch-IrishScottishSeminoleSenegaleseSerbianSierra LeoneanSiouxSlavicSlovakSloveneSouth AfricanSouth AmericanSouth American IndianSpaniardSpanishSri LankanSubsaharan AfricanSudaneseSwedishSwissSyrianThaiTonganTrinidadian and TobagonianTurkishUgandanUkrainianUruguayanVenezuelanVietnameseWelshWest IndianYugoslavianZimbabwean
Immigrant Origin (Total)
AfghanistanAfricaArgentinaAsiaAustraliaAustriaBahamasBangladeshBarbadosBelarusBoliviaBosnia and HerzegovinaBrazilBulgariaBurma / MyanmarCambodiaCameroonCanadaCaribbeanCentral AmericaChileChinaColombiaCongoCosta RicaCubaDenmarkDominican RepublicEastern AfricaEastern AsiaEastern EuropeEcuadorEgyptEl SalvadorEnglandEritreaEthiopiaEuropeFranceGermanyGhanaGreeceGuatemalaGuyanaHaitiHondurasHong KongHungaryIndiaIndonesiaIranIraqIrelandIsraelItalyJamaicaJapanJordanKenyaKoreaLaosLatin AmericaLatviaLebanonLiberiaMalaysiaMexicoMiddle AfricaMoldovaMoroccoNepalNetherlandsNicaraguaNigeriaNorth MacedoniaNorthern AfricaNorthern EuropeNorwayOceaniaPakistanPanamaPeruPhilippinesPolandPortugalRomaniaRussiaSaudi ArabiaScotlandSenegalSerbiaSierra LeoneSingaporeSouth AfricaSouth AmericaSouth Central AsiaSouth Eastern AsiaSouthern EuropeSpainSt. Vincent and the GrenadinesSudanSyriaTaiwanThailandTrinidad and TobagoTurkeyUgandaUkraineUzbekistanVenezuelaVietnamWest IndiesWestern AfricaWestern AsiaWestern EuropeYemenZaireZimbabwe
Immigrant Origin (Percentage)
AfghanistanAfricaArgentinaAsiaAustraliaAustriaBahamasBangladeshBarbadosBelarusBoliviaBosnia and HerzegovinaBrazilBulgariaBurma / MyanmarCambodiaCameroonCanadaCaribbeanCentral AmericaChileChinaColombiaCongoCosta RicaCubaDenmarkDominican RepublicEastern AfricaEastern AsiaEastern EuropeEcuadorEgyptEl SalvadorEnglandEritreaEthiopiaEuropeFranceGermanyGhanaGreeceGuatemalaGuyanaHaitiHondurasHong KongHungaryIndiaIndonesiaIranIraqIrelandIsraelItalyJamaicaJapanJordanKenyaKoreaLaosLatin AmericaLatviaLebanonLiberiaMalaysiaMexicoMiddle AfricaMoldovaMoroccoNepalNetherlandsNicaraguaNigeriaNorth MacedoniaNorthern AfricaNorthern EuropeNorwayOceaniaPakistanPanamaPeruPhilippinesPolandPortugalRomaniaRussiaSaudi ArabiaScotlandSenegalSerbiaSierra LeoneSingaporeSouth AfricaSouth AmericaSouth Central AsiaSouth Eastern AsiaSouthern EuropeSpainSt. Vincent and the GrenadinesSudanSyriaTaiwanThailandTrinidad and TobagoTurkeyUgandaUkraineUzbekistanVenezuelaVietnamWest IndiesWestern AfricaWestern AsiaWestern EuropeYemenZaireZimbabwe
Income
Income (Families)
Income (Households)
Poverty
Poverty (Families)
Unemployment
Employment Occupations
Employment Industries
Employer Class
Commute Time
Commute Means
School Enrollment
Education by Degree Field
Occupancy
Finances
Physical Characteristics
Indianapolis
Compare Zip Codes
Comparison Subject

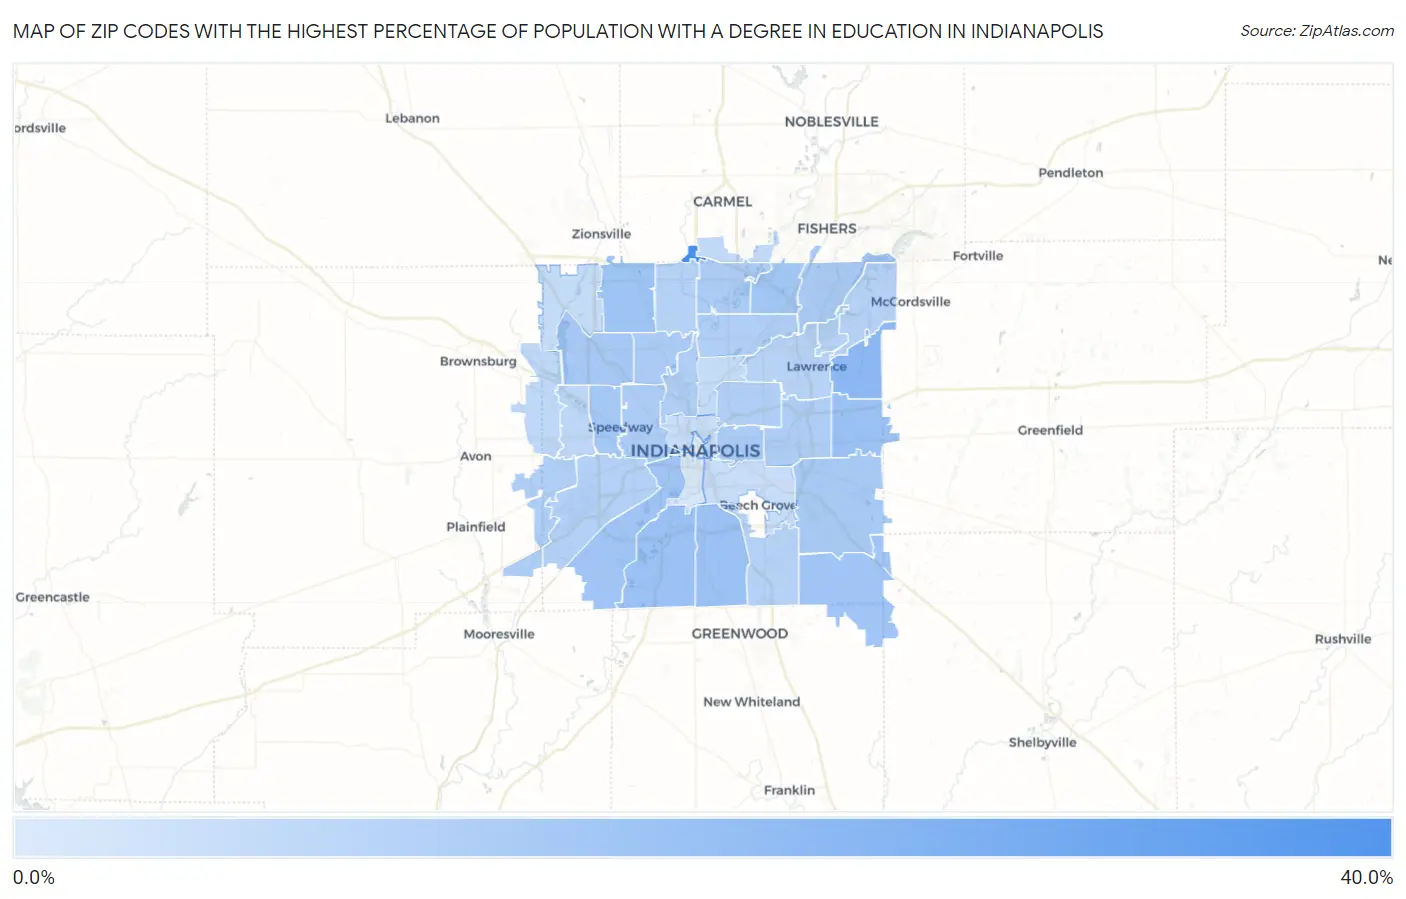
Map of Zip Codes with the Highest Percentage of Population with a Degree in Education in Indianapolis

0.0%
40.0%
Zip Codes with the Highest Percentage of Population with a Degree in Education in Indianapolis Map

Zip Codes with the Highest Percentage of Population with a Degree in Education in Indianapolis, IN

Zip Code % Graduates vs State vs National
1.4629035.6%14.8%(+20.8)#6311.1%(+24.5)#2,909
2.4623518.9%14.8%(+4.15)#30911.1%(+7.85)#11,483
3.4622915.8%14.8%(+1.10)#40611.1%(+4.79)#14,680
4.4621715.8%14.8%(+1.09)#40711.1%(+4.78)#14,687
5.4622715.1%14.8%(+0.301)#42911.1%(+4.00)#15,610
6.4626814.5%14.8%(-0.227)#45311.1%(+3.47)#16,300
7.4625914.2%14.8%(-0.527)#46411.1%(+3.17)#16,747
8.4622114.1%14.8%(-0.609)#46611.1%(+3.09)#16,842
9.4625013.6%14.8%(-1.20)#48411.1%(+2.49)#17,584
10.4625413.4%14.8%(-1.31)#48611.1%(+2.39)#17,705
11.4622413.1%14.8%(-1.65)#49511.1%(+2.04)#18,125
12.4623912.9%14.8%(-1.87)#49911.1%(+1.83)#18,403
13.4625612.2%14.8%(-2.56)#52111.1%(+1.13)#19,343
14.4622812.1%14.8%(-2.67)#52311.1%(+1.02)#19,493
15.4620112.1%14.8%(-2.68)#52611.1%(+1.01)#19,515
16.4622211.9%14.8%(-2.88)#53211.1%(+0.819)#19,797
17.4624011.7%14.8%(-3.09)#53511.1%(+0.605)#20,085
18.4621911.1%14.8%(-3.65)#55211.1%(+0.045)#20,852
19.4620810.9%14.8%(-3.88)#55811.1%(-0.183)#21,135
20.4621810.7%14.8%(-4.05)#56011.1%(-0.356)#21,363
21.4622010.7%14.8%(-4.09)#56111.1%(-0.400)#21,432
22.4623110.5%14.8%(-4.21)#56511.1%(-0.517)#21,591
23.4624110.1%14.8%(-4.67)#57511.1%(-0.980)#22,228
24.462609.8%14.8%(-4.91)#58411.1%(-1.22)#22,576
25.462379.7%14.8%(-5.00)#58511.1%(-1.31)#22,678
26.462369.4%14.8%(-5.40)#59711.1%(-1.70)#23,214
27.462269.1%14.8%(-5.63)#60511.1%(-1.93)#23,516
28.462169.1%14.8%(-5.65)#60611.1%(-1.96)#23,546
29.462148.3%14.8%(-6.49)#62611.1%(-2.79)#24,561
30.462347.7%14.8%(-7.08)#63111.1%(-3.39)#25,228
31.462807.5%14.8%(-7.26)#63511.1%(-3.57)#25,397
32.462786.7%14.8%(-8.08)#65011.1%(-4.39)#26,231
33.462056.4%14.8%(-8.33)#65511.1%(-4.64)#26,461
34.462036.2%14.8%(-8.56)#65811.1%(-4.87)#26,659
35.462025.9%14.8%(-8.84)#66211.1%(-5.15)#26,894
36.462253.0%14.8%(-11.8)#68311.1%(-8.08)#28,689
37.462041.9%14.8%(-12.9)#68511.1%(-9.16)#29,011

Common Questions

What are the Top 10 Zip Codes with the Highest Percentage of Population with a Degree in Education in Indianapolis, IN?
Top 10 Zip Codes with the Highest Percentage of Population with a Degree in Education in Indianapolis, IN are:
#1
35.6%
#2
18.9%
#3
15.8%
#4
15.8%
#5
15.1%
#6
14.5%
#7
14.2%
#8
14.1%
#9
13.6%
#10
13.4%
What zip code has the Highest Percentage of Population with a Degree in Education in Indianapolis, IN?
46290 has the Highest Percentage of Population with a Degree in Education in Indianapolis, IN with 35.6%.
What is the Percentage of Population with a Degree in Education in Indianapolis, IN?
Percentage of Population with a Degree in Education in Indianapolis is 10.8%.
What is the Percentage of Population with a Degree in Education in Indiana?
Percentage of Population with a Degree in Education in Indiana is 14.8%.
What is the Percentage of Population with a Degree in Education in the United States?
Percentage of Population with a Degree in Education in the United States is 11.1%.