Zip Codes with the Highest Percentage of Population Employed in Security & Protection in Indianapolis, IN
RELATED REPORTS & OPTIONS
Security & Protection
Indianapolis
Compare Zip Codes
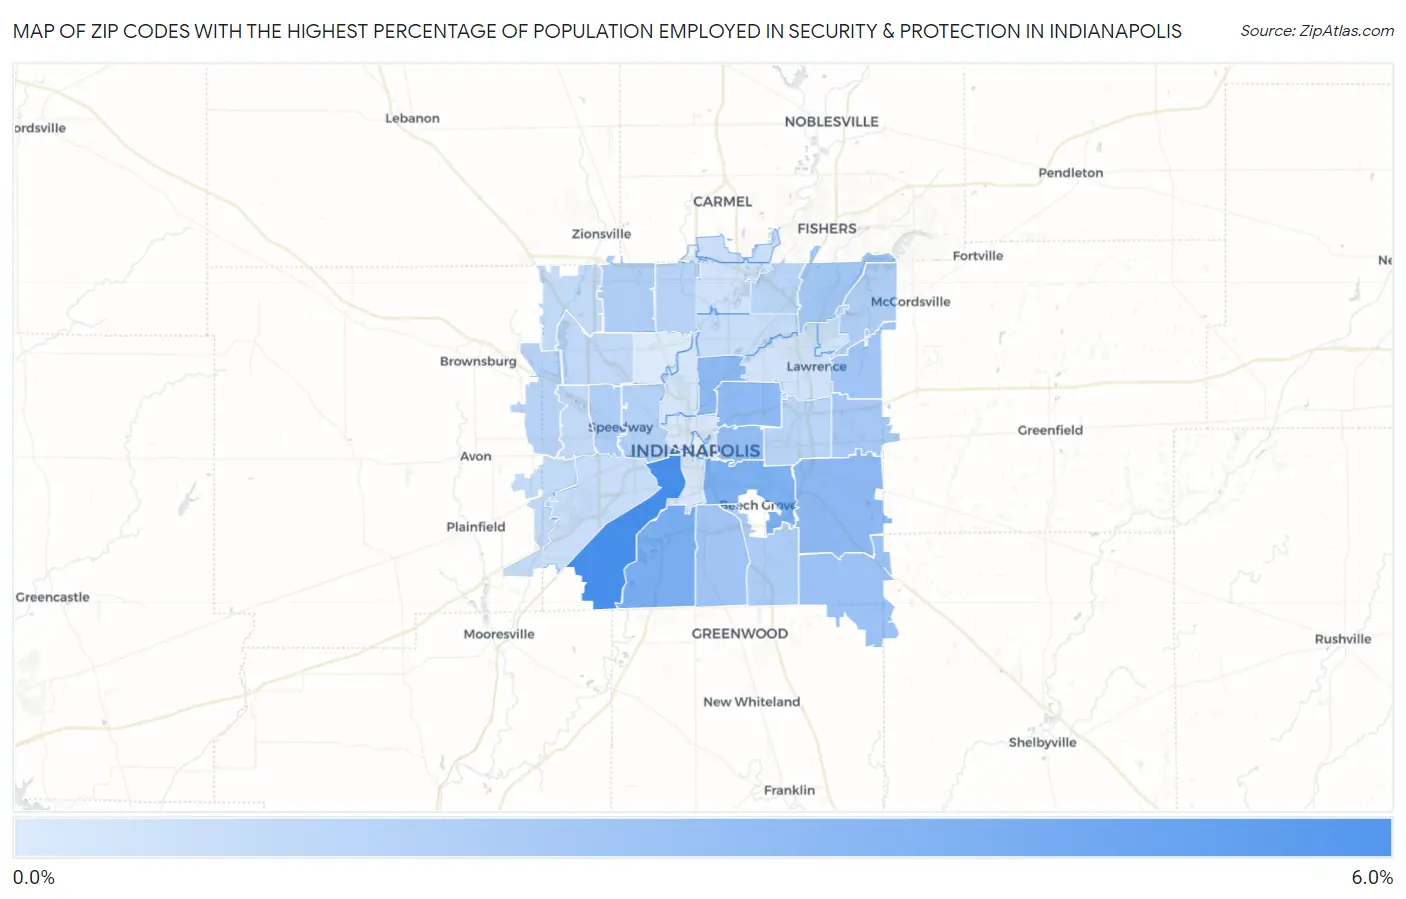
Map of Zip Codes with the Highest Percentage of Population Employed in Security & Protection in Indianapolis
0.0%
6.0%
Zip Codes with the Highest Percentage of Population Employed in Security & Protection in Indianapolis, IN
| Zip Code | % Employed | vs State | vs National | |
| 1. | 46221 | 5.2% | 1.8%(+3.40)#47 | 2.1%(+3.02)#2,737 |
| 2. | 46217 | 3.6% | 1.8%(+1.78)#87 | 2.1%(+1.40)#5,536 |
| 3. | 46203 | 3.4% | 1.8%(+1.66)#96 | 2.1%(+1.29)#5,829 |
| 4. | 46205 | 2.9% | 1.8%(+1.14)#131 | 2.1%(+0.763)#7,592 |
| 5. | 46239 | 2.9% | 1.8%(+1.12)#134 | 2.1%(+0.751)#7,637 |
| 6. | 46218 | 2.8% | 1.8%(+1.06)#141 | 2.1%(+0.684)#7,953 |
| 7. | 46201 | 2.7% | 1.8%(+0.908)#154 | 2.1%(+0.534)#8,611 |
| 8. | 46259 | 2.5% | 1.8%(+0.742)#175 | 2.1%(+0.369)#9,423 |
| 9. | 46235 | 2.2% | 1.8%(+0.475)#206 | 2.1%(+0.101)#10,952 |
| 10. | 46227 | 2.2% | 1.8%(+0.472)#208 | 2.1%(+0.098)#10,965 |
| 11. | 46256 | 2.2% | 1.8%(+0.446)#212 | 2.1%(+0.073)#11,131 |
| 12. | 46229 | 2.1% | 1.8%(+0.358)#226 | 2.1%(-0.016)#11,676 |
| 13. | 46237 | 1.9% | 1.8%(+0.111)#272 | 2.1%(-0.262)#13,339 |
| 14. | 46268 | 1.8% | 1.8%(+0.066)#278 | 2.1%(-0.308)#13,639 |
| 15. | 46224 | 1.8% | 1.8%(+0.040)#285 | 2.1%(-0.333)#13,822 |
| 16. | 46236 | 1.7% | 1.8%(-0.034)#309 | 2.1%(-0.408)#14,386 |
| 17. | 46222 | 1.7% | 1.8%(-0.091)#318 | 2.1%(-0.464)#14,796 |
| 18. | 46234 | 1.6% | 1.8%(-0.208)#340 | 2.1%(-0.581)#15,673 |
| 19. | 46260 | 1.5% | 1.8%(-0.251)#354 | 2.1%(-0.625)#16,001 |
| 20. | 46250 | 1.5% | 1.8%(-0.289)#361 | 2.1%(-0.663)#16,322 |
| 21. | 46219 | 1.4% | 1.8%(-0.331)#368 | 2.1%(-0.705)#16,635 |
| 22. | 46254 | 1.3% | 1.8%(-0.503)#415 | 2.1%(-0.877)#17,967 |
| 23. | 46214 | 1.3% | 1.8%(-0.516)#419 | 2.1%(-0.890)#18,075 |
| 24. | 46278 | 1.2% | 1.8%(-0.577)#430 | 2.1%(-0.951)#18,522 |
| 25. | 46231 | 1.2% | 1.8%(-0.602)#433 | 2.1%(-0.976)#18,719 |
| 26. | 46220 | 1.1% | 1.8%(-0.716)#453 | 2.1%(-1.09)#19,596 |
| 27. | 46241 | 1.0% | 1.8%(-0.735)#456 | 2.1%(-1.11)#19,743 |
| 28. | 46280 | 0.94% | 1.8%(-0.839)#483 | 2.1%(-1.21)#20,536 |
| 29. | 46226 | 0.77% | 1.8%(-1.01)#515 | 2.1%(-1.38)#21,620 |
| 30. | 46240 | 0.74% | 1.8%(-1.04)#521 | 2.1%(-1.41)#21,819 |
| 31. | 46216 | 0.73% | 1.8%(-1.05)#526 | 2.1%(-1.42)#21,886 |
| 32. | 46208 | 0.62% | 1.8%(-1.16)#553 | 2.1%(-1.53)#22,573 |
| 33. | 46202 | 0.50% | 1.8%(-1.27)#569 | 2.1%(-1.65)#23,216 |
| 34. | 46225 | 0.43% | 1.8%(-1.34)#577 | 2.1%(-1.72)#23,577 |
| 35. | 46228 | 0.38% | 1.8%(-1.40)#581 | 2.1%(-1.77)#23,825 |
1
Common Questions
What are the Top 10 Zip Codes with the Highest Percentage of Population Employed in Security & Protection in Indianapolis, IN?
Top 10 Zip Codes with the Highest Percentage of Population Employed in Security & Protection in Indianapolis, IN are:
What zip code has the Highest Percentage of Population Employed in Security & Protection in Indianapolis, IN?
46221 has the Highest Percentage of Population Employed in Security & Protection in Indianapolis, IN with 5.2%.
What is the Percentage of Population Employed in Security & Protection in Indianapolis, IN?
Percentage of Population Employed in Security & Protection in Indianapolis is 1.9%.
What is the Percentage of Population Employed in Security & Protection in Indiana?
Percentage of Population Employed in Security & Protection in Indiana is 1.8%.
What is the Percentage of Population Employed in Security & Protection in the United States?
Percentage of Population Employed in Security & Protection in the United States is 2.1%.