Zip Codes with the Highest Percentage of Families with Income Below $10,000 in Indianapolis, IN
RELATED REPORTS & OPTIONS
Family Income | $0-10k
Indianapolis
Compare Zip Codes
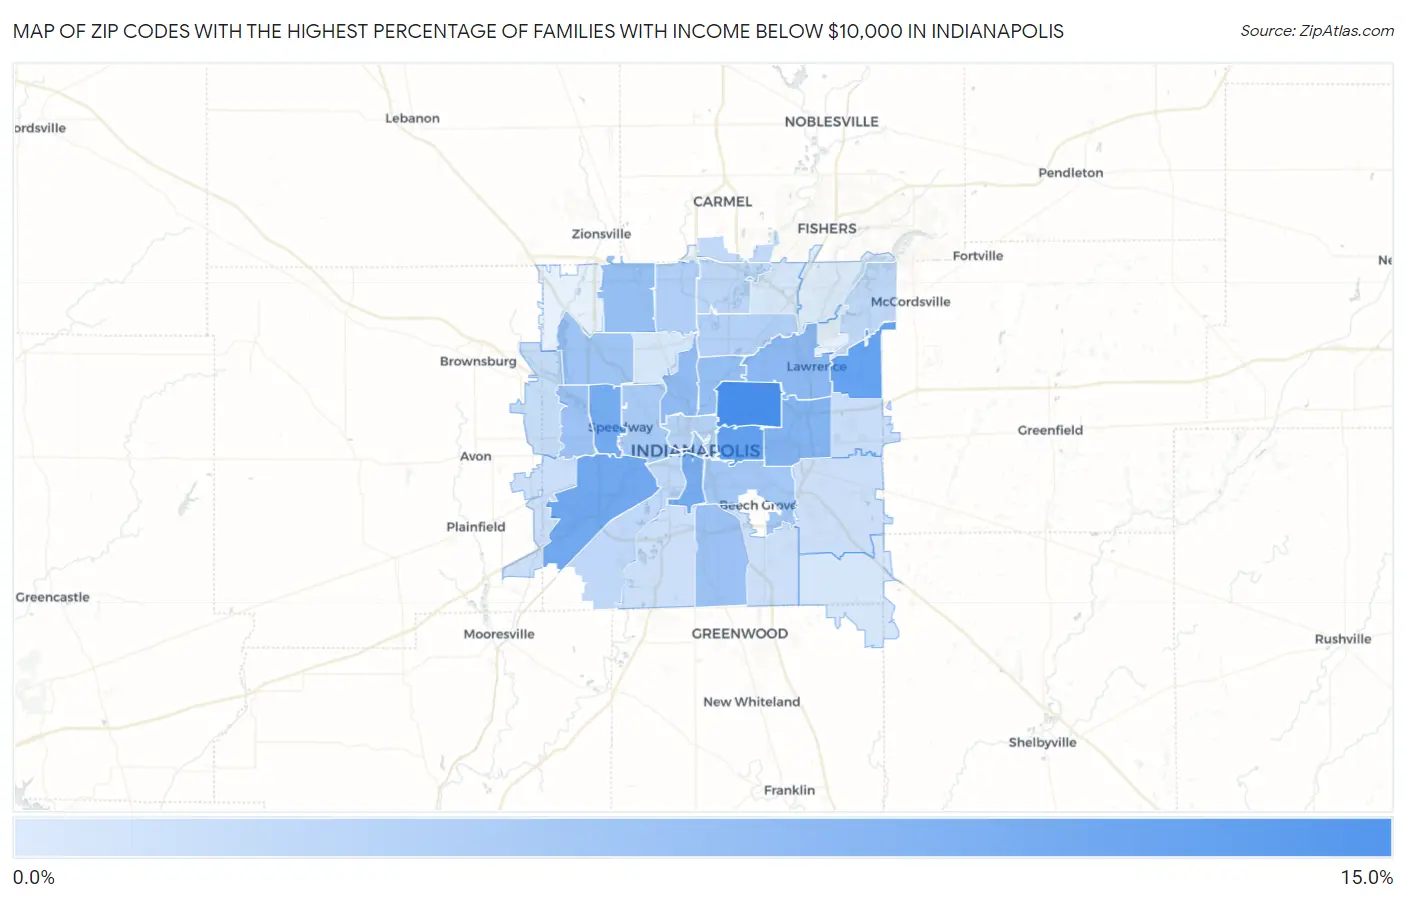
Map of Zip Codes with the Highest Percentage of Families with Income Below $10,000 in Indianapolis
0.0%
15.0%
Zip Codes with the Highest Percentage of Families with Income Below $10,000 in Indianapolis, IN
| Zip Code | Families with Income < $10k | vs State | vs National | |
| 1. | 46218 | 12.2% | 3.1%(+9.10)#21 | 3.1%(+9.10)#1,275 |
| 2. | 46201 | 9.9% | 3.1%(+6.80)#32 | 3.1%(+6.80)#1,949 |
| 3. | 46235 | 9.7% | 3.1%(+6.60)#35 | 3.1%(+6.60)#2,030 |
| 4. | 46241 | 8.8% | 3.1%(+5.70)#42 | 3.1%(+5.70)#2,450 |
| 5. | 46224 | 8.4% | 3.1%(+5.30)#48 | 3.1%(+5.30)#2,704 |
| 6. | 46225 | 8.3% | 3.1%(+5.20)#50 | 3.1%(+5.20)#2,790 |
| 7. | 46219 | 7.2% | 3.1%(+4.10)#62 | 3.1%(+4.10)#3,467 |
| 8. | 46226 | 6.5% | 3.1%(+3.40)#74 | 3.1%(+3.40)#4,093 |
| 9. | 46208 | 6.1% | 3.1%(+3.00)#85 | 3.1%(+3.00)#4,546 |
| 10. | 46205 | 5.9% | 3.1%(+2.80)#93 | 3.1%(+2.80)#4,782 |
| 11. | 46268 | 5.8% | 3.1%(+2.70)#99 | 3.1%(+2.70)#4,910 |
| 12. | 46214 | 5.5% | 3.1%(+2.40)#113 | 3.1%(+2.40)#5,321 |
| 13. | 46227 | 5.3% | 3.1%(+2.20)#123 | 3.1%(+2.20)#5,592 |
| 14. | 46254 | 5.0% | 3.1%(+1.90)#130 | 3.1%(+1.90)#6,086 |
| 15. | 46203 | 4.8% | 3.1%(+1.70)#137 | 3.1%(+1.70)#6,425 |
| 16. | 46204 | 4.7% | 3.1%(+1.60)#143 | 3.1%(+1.60)#6,674 |
| 17. | 46222 | 4.3% | 3.1%(+1.20)#160 | 3.1%(+1.20)#7,410 |
| 18. | 46260 | 3.7% | 3.1%(+0.600)#202 | 3.1%(+0.600)#8,968 |
| 19. | 46220 | 3.5% | 3.1%(+0.400)#212 | 3.1%(+0.400)#9,497 |
| 20. | 46202 | 3.2% | 3.1%(+0.100)#232 | 3.1%(+0.100)#10,502 |
| 21. | 46240 | 2.7% | 3.1%(-0.400)#277 | 3.1%(-0.400)#12,328 |
| 22. | 46221 | 2.6% | 3.1%(-0.500)#285 | 3.1%(-0.500)#12,675 |
| 23. | 46236 | 2.5% | 3.1%(-0.600)#297 | 3.1%(-0.600)#13,115 |
| 24. | 46280 | 2.4% | 3.1%(-0.700)#309 | 3.1%(-0.700)#13,628 |
| 25. | 46234 | 2.0% | 3.1%(-1.10)#359 | 3.1%(-1.10)#15,339 |
| 26. | 46229 | 1.8% | 3.1%(-1.30)#387 | 3.1%(-1.30)#16,290 |
| 27. | 46237 | 1.6% | 3.1%(-1.50)#405 | 3.1%(-1.50)#17,213 |
| 28. | 46217 | 1.6% | 3.1%(-1.50)#406 | 3.1%(-1.50)#17,221 |
| 29. | 46239 | 1.5% | 3.1%(-1.60)#420 | 3.1%(-1.60)#17,712 |
| 30. | 46231 | 1.5% | 3.1%(-1.60)#424 | 3.1%(-1.60)#17,879 |
| 31. | 46228 | 0.90% | 3.1%(-2.20)#485 | 3.1%(-2.20)#20,838 |
| 32. | 46259 | 0.90% | 3.1%(-2.20)#486 | 3.1%(-2.20)#20,853 |
| 33. | 46250 | 0.80% | 3.1%(-2.30)#500 | 3.1%(-2.30)#21,312 |
| 34. | 46256 | 0.30% | 3.1%(-2.80)#558 | 3.1%(-2.80)#23,379 |
1
Common Questions
What are the Top 10 Zip Codes with the Highest Percentage of Families with Income Below $10,000 in Indianapolis, IN?
Top 10 Zip Codes with the Highest Percentage of Families with Income Below $10,000 in Indianapolis, IN are:
What zip code has the Highest Percentage of Families with Income Below $10,000 in Indianapolis, IN?
46218 has the Highest Percentage of Families with Income Below $10,000 in Indianapolis, IN with 12.2%.
What is the Percentage of Families with Income Below $10,000 in Indianapolis, IN?
Percentage of Families with Income Below $10,000 in Indianapolis is 4.8%.
What is the Percentage of Families with Income Below $10,000 in Indiana?
Percentage of Families with Income Below $10,000 in Indiana is 3.1%.
What is the Percentage of Families with Income Below $10,000 in the United States?
Percentage of Families with Income Below $10,000 in the United States is 3.1%.