Zip Codes with the Highest Percentage of Population Employed in Installation, Maintenance & Repair in Indianapolis, IN
RELATED REPORTS & OPTIONS
Installation, Maintenance & Repair
Indianapolis
Compare Zip Codes
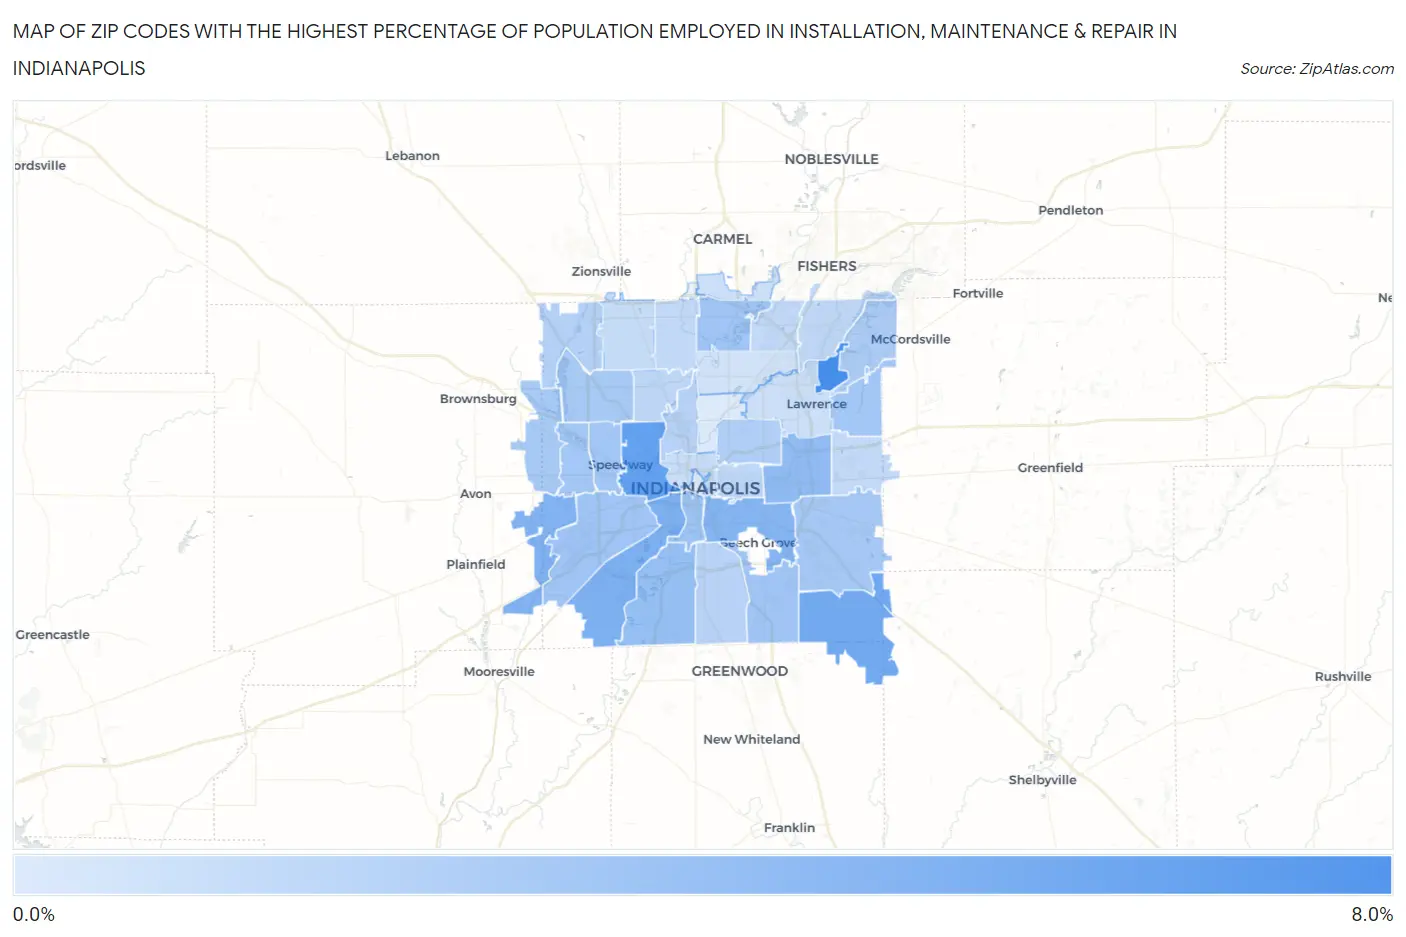
Map of Zip Codes with the Highest Percentage of Population Employed in Installation, Maintenance & Repair in Indianapolis
0.0%
8.0%
Zip Codes with the Highest Percentage of Population Employed in Installation, Maintenance & Repair in Indianapolis, IN
| Zip Code | % Employed | vs State | vs National | |
| 1. | 46216 | 6.3% | 3.5%(+2.78)#168 | 3.1%(+3.26)#5,510 |
| 2. | 46222 | 5.3% | 3.5%(+1.76)#239 | 3.1%(+2.23)#7,806 |
| 3. | 46259 | 4.7% | 3.5%(+1.16)#288 | 3.1%(+1.64)#9,658 |
| 4. | 46221 | 4.3% | 3.5%(+0.781)#334 | 3.1%(+1.26)#11,065 |
| 5. | 46231 | 4.1% | 3.5%(+0.580)#356 | 3.1%(+1.05)#11,831 |
| 6. | 46203 | 4.0% | 3.5%(+0.443)#373 | 3.1%(+0.918)#12,443 |
| 7. | 46219 | 3.6% | 3.5%(+0.037)#423 | 3.1%(+0.511)#14,246 |
| 8. | 46217 | 3.3% | 3.5%(-0.193)#440 | 3.1%(+0.281)#15,327 |
| 9. | 46225 | 3.0% | 3.5%(-0.514)#471 | 3.1%(-0.040)#16,857 |
| 10. | 46240 | 2.9% | 3.5%(-0.602)#482 | 3.1%(-0.128)#17,290 |
| 11. | 46241 | 2.9% | 3.5%(-0.607)#486 | 3.1%(-0.133)#17,326 |
| 12. | 46237 | 2.9% | 3.5%(-0.609)#487 | 3.1%(-0.135)#17,336 |
| 13. | 46224 | 2.9% | 3.5%(-0.635)#489 | 3.1%(-0.161)#17,452 |
| 14. | 46214 | 2.9% | 3.5%(-0.663)#499 | 3.1%(-0.189)#17,615 |
| 15. | 46235 | 2.9% | 3.5%(-0.677)#501 | 3.1%(-0.203)#17,689 |
| 16. | 46239 | 2.8% | 3.5%(-0.715)#507 | 3.1%(-0.240)#17,855 |
| 17. | 46254 | 2.7% | 3.5%(-0.853)#522 | 3.1%(-0.379)#18,608 |
| 18. | 46234 | 2.7% | 3.5%(-0.860)#524 | 3.1%(-0.385)#18,649 |
| 19. | 46236 | 2.5% | 3.5%(-1.01)#539 | 3.1%(-0.532)#19,379 |
| 20. | 46218 | 2.3% | 3.5%(-1.19)#560 | 3.1%(-0.720)#20,338 |
| 21. | 46278 | 2.3% | 3.5%(-1.28)#569 | 3.1%(-0.806)#20,775 |
| 22. | 46208 | 2.1% | 3.5%(-1.40)#579 | 3.1%(-0.929)#21,351 |
| 23. | 46227 | 2.1% | 3.5%(-1.41)#580 | 3.1%(-0.933)#21,376 |
| 24. | 46228 | 1.9% | 3.5%(-1.61)#601 | 3.1%(-1.14)#22,337 |
| 25. | 46201 | 1.8% | 3.5%(-1.69)#614 | 3.1%(-1.22)#22,663 |
| 26. | 46256 | 1.8% | 3.5%(-1.75)#618 | 3.1%(-1.27)#22,917 |
| 27. | 46250 | 1.8% | 3.5%(-1.75)#622 | 3.1%(-1.28)#22,944 |
| 28. | 46260 | 1.8% | 3.5%(-1.77)#623 | 3.1%(-1.29)#23,004 |
| 29. | 46229 | 1.7% | 3.5%(-1.80)#625 | 3.1%(-1.33)#23,149 |
| 30. | 46268 | 1.6% | 3.5%(-1.90)#634 | 3.1%(-1.43)#23,601 |
| 31. | 46202 | 1.5% | 3.5%(-2.00)#639 | 3.1%(-1.52)#23,995 |
| 32. | 46226 | 1.4% | 3.5%(-2.18)#654 | 3.1%(-1.70)#24,669 |
| 33. | 46280 | 1.3% | 3.5%(-2.20)#656 | 3.1%(-1.73)#24,766 |
| 34. | 46220 | 1.2% | 3.5%(-2.34)#664 | 3.1%(-1.87)#25,269 |
| 35. | 46204 | 0.79% | 3.5%(-2.75)#678 | 3.1%(-2.28)#26,533 |
| 36. | 46205 | 0.78% | 3.5%(-2.76)#680 | 3.1%(-2.29)#26,569 |
1
Common Questions
What are the Top 10 Zip Codes with the Highest Percentage of Population Employed in Installation, Maintenance & Repair in Indianapolis, IN?
Top 10 Zip Codes with the Highest Percentage of Population Employed in Installation, Maintenance & Repair in Indianapolis, IN are:
What zip code has the Highest Percentage of Population Employed in Installation, Maintenance & Repair in Indianapolis, IN?
46216 has the Highest Percentage of Population Employed in Installation, Maintenance & Repair in Indianapolis, IN with 6.3%.
What is the Percentage of Population Employed in Installation, Maintenance & Repair in Indianapolis, IN?
Percentage of Population Employed in Installation, Maintenance & Repair in Indianapolis is 2.6%.
What is the Percentage of Population Employed in Installation, Maintenance & Repair in Indiana?
Percentage of Population Employed in Installation, Maintenance & Repair in Indiana is 3.5%.
What is the Percentage of Population Employed in Installation, Maintenance & Repair in the United States?
Percentage of Population Employed in Installation, Maintenance & Repair in the United States is 3.1%.