Zip Codes with the Highest Percentage of Population Employed in Legal Services & Support in Waukegan, IL
RELATED REPORTS & OPTIONS
Legal Services & Support
Waukegan
Compare Zip Codes
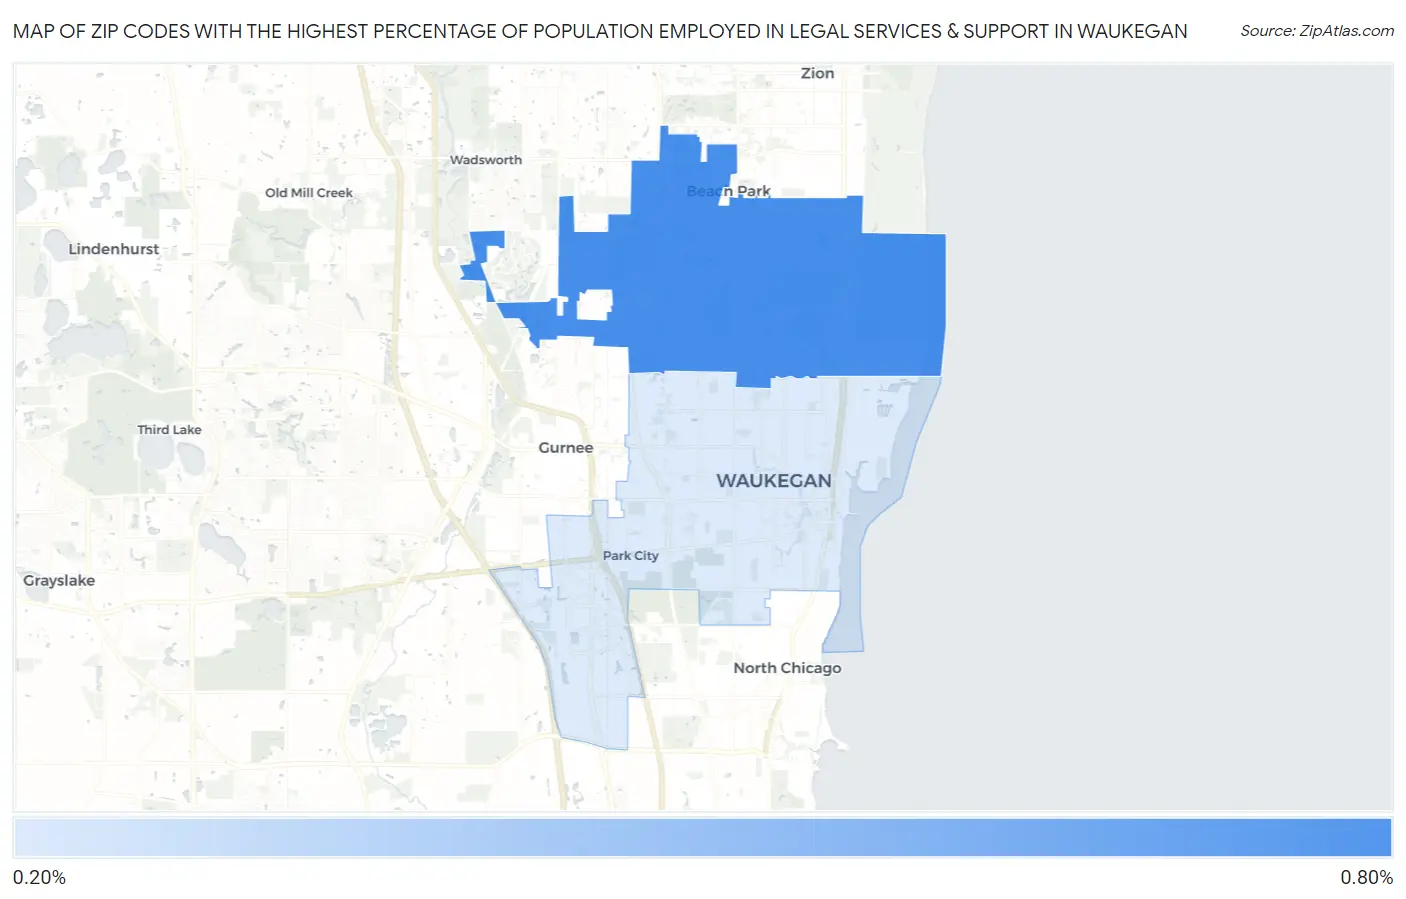
Map of Zip Codes with the Highest Percentage of Population Employed in Legal Services & Support in Waukegan
0.0%
0.80%
Zip Codes with the Highest Percentage of Population Employed in Legal Services & Support in Waukegan, IL
| Zip Code | % Employed | vs State | vs National | |
| 1. | 60087 | 0.74% | 1.3%(-0.611)#374 | 1.2%(-0.445)#10,020 |
| 2. | 60085 | 0.28% | 1.3%(-1.07)#619 | 1.2%(-0.908)#15,310 |
1
Common Questions
What are the Top Zip Codes with the Highest Percentage of Population Employed in Legal Services & Support in Waukegan, IL?
Top Zip Codes with the Highest Percentage of Population Employed in Legal Services & Support in Waukegan, IL are:
What zip code has the Highest Percentage of Population Employed in Legal Services & Support in Waukegan, IL?
60087 has the Highest Percentage of Population Employed in Legal Services & Support in Waukegan, IL with 0.74%.
What is the Percentage of Population Employed in Legal Services & Support in Waukegan, IL?
Percentage of Population Employed in Legal Services & Support in Waukegan is 0.47%.
What is the Percentage of Population Employed in Legal Services & Support in Illinois?
Percentage of Population Employed in Legal Services & Support in Illinois is 1.3%.
What is the Percentage of Population Employed in Legal Services & Support in the United States?
Percentage of Population Employed in Legal Services & Support in the United States is 1.2%.