Zip Codes with the Highest Percentage of Households with Income Above $200,000 in Peoria, IL
RELATED REPORTS & OPTIONS
Household Income | $200k+
Peoria
Compare Zip Codes
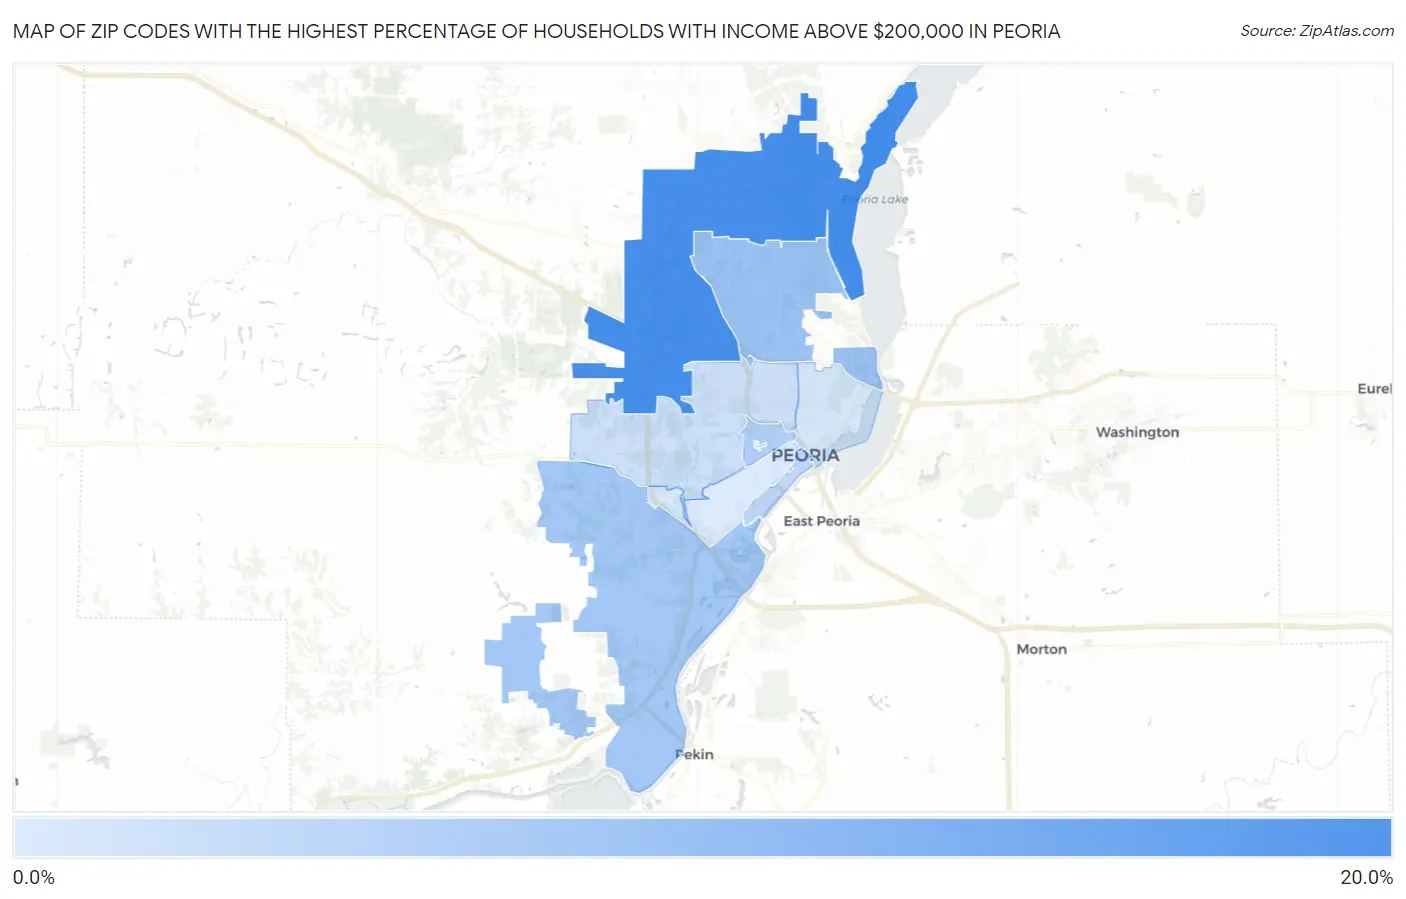
Map of Zip Codes with the Highest Percentage of Households with Income Above $200,000 in Peoria
0.0%
20.0%
Zip Codes with the Highest Percentage of Households with Income Above $200,000 in Peoria, IL
| Zip Code | Households with Income > $200k | vs State | vs National | |
| 1. | 61615 | 17.3% | 12.1%(+5.20)#148 | 11.4%(+5.90)#4,071 |
| 2. | 61614 | 7.3% | 12.1%(-4.80)#477 | 11.4%(-4.10)#11,340 |
| 3. | 61607 | 6.5% | 12.1%(-5.60)#518 | 11.4%(-4.90)#12,590 |
| 4. | 61606 | 5.0% | 12.1%(-7.10)#657 | 11.4%(-6.40)#15,651 |
| 5. | 61602 | 3.8% | 12.1%(-8.30)#802 | 11.4%(-7.60)#18,800 |
| 6. | 61604 | 2.1% | 12.1%(-10.00)#1,032 | 11.4%(-9.30)#23,464 |
| 7. | 61603 | 1.1% | 12.1%(-11.0)#1,126 | 11.4%(-10.3)#25,970 |
| 8. | 61605 | 0.30% | 12.1%(-11.8)#1,206 | 11.4%(-11.1)#27,370 |
1
Common Questions
What are the Top 5 Zip Codes with the Highest Percentage of Households with Income Above $200,000 in Peoria, IL?
Top 5 Zip Codes with the Highest Percentage of Households with Income Above $200,000 in Peoria, IL are:
What zip code has the Highest Percentage of Households with Income Above $200,000 in Peoria, IL?
61615 has the Highest Percentage of Households with Income Above $200,000 in Peoria, IL with 17.3%.
What is the Percentage of Households with Income Above $200,000 in Peoria, IL?
Percentage of Households with Income Above $200,000 in Peoria is 8.8%.
What is the Percentage of Households with Income Above $200,000 in Illinois?
Percentage of Households with Income Above $200,000 in Illinois is 12.1%.
What is the Percentage of Households with Income Above $200,000 in the United States?
Percentage of Households with Income Above $200,000 in the United States is 11.4%.