Zip Codes with the Highest Percentage of Households Without a Vehicle in Melrose Park, IL
RELATED REPORTS & OPTIONS
Households without a Cars
Melrose Park
Compare Zip Codes
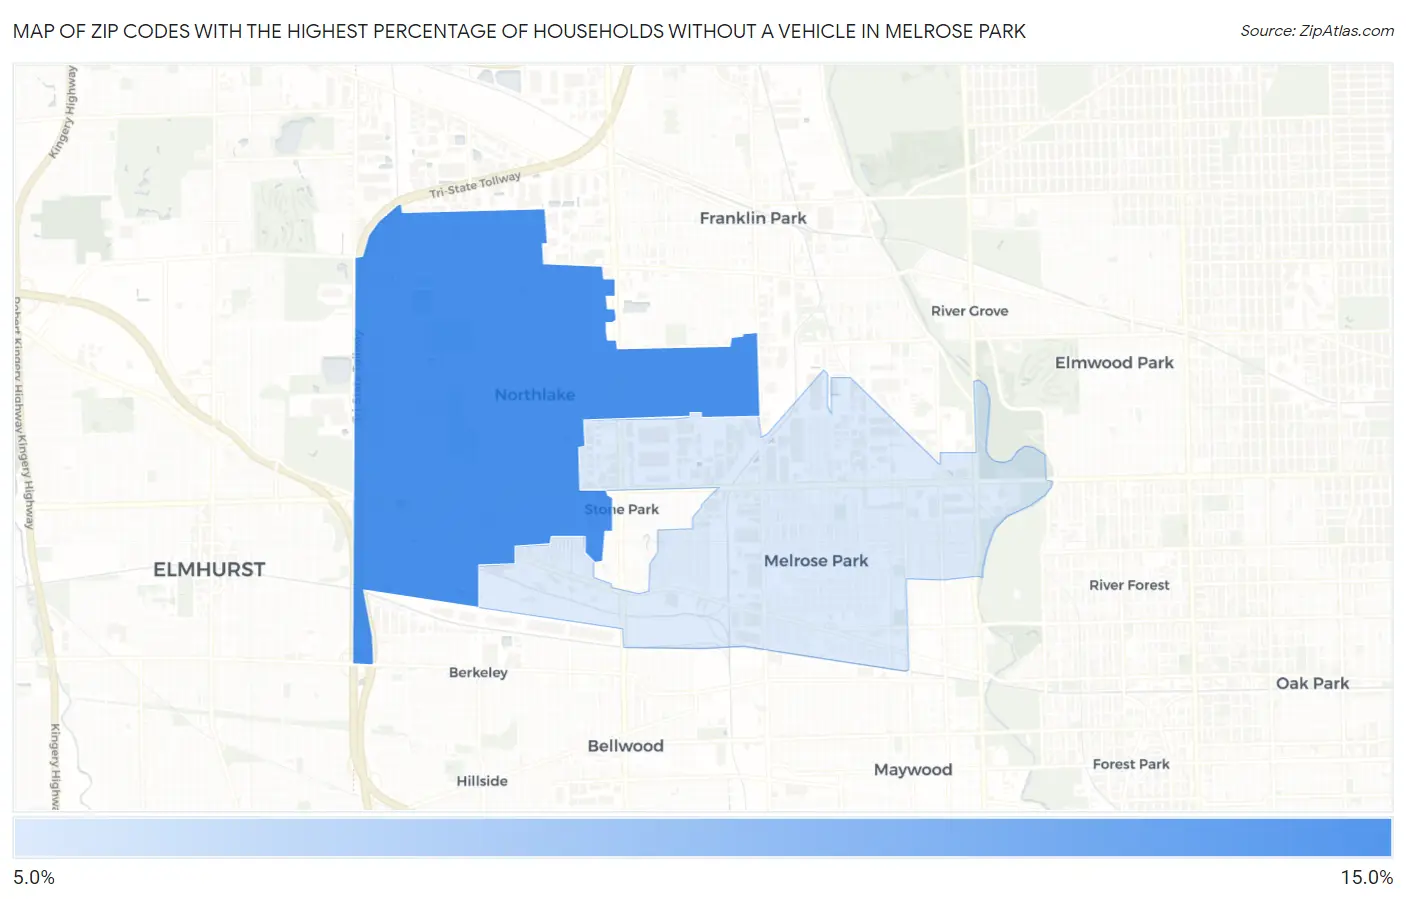
Map of Zip Codes with the Highest Percentage of Households Without a Vehicle in Melrose Park
0.0%
15.0%
Zip Codes with the Highest Percentage of Households Without a Vehicle in Melrose Park, IL
| Zip Code | Housholds Without a Car | vs State | vs National | |
| 1. | 60164 | 10.4% | 10.8%(-0.400)#163 | 8.3%(+2.10)#4,543 |
| 2. | 60160 | 7.3% | 10.8%(-3.50)#305 | 8.3%(-1.00)#8,040 |
1
Common Questions
What are the Top Zip Codes with the Highest Percentage of Households Without a Vehicle in Melrose Park, IL?
Top Zip Codes with the Highest Percentage of Households Without a Vehicle in Melrose Park, IL are:
What zip code has the Highest Percentage of Households Without a Vehicle in Melrose Park, IL?
60164 has the Highest Percentage of Households Without a Vehicle in Melrose Park, IL with 10.4%.
What is the Percentage of Households Without a Vehicle in Melrose Park, IL?
Percentage of Households Without a Vehicle in Melrose Park is 7.3%.
What is the Percentage of Households Without a Vehicle in Illinois?
Percentage of Households Without a Vehicle in Illinois is 10.8%.
What is the Percentage of Households Without a Vehicle in the United States?
Percentage of Households Without a Vehicle in the United States is 8.3%.