Zip Codes with the Highest Percentage of Hawaiian / Pacific Population in New Mexico
RELATED REPORTS & OPTIONS
Hawaiian / Pacific
New Mexico
Compare Zip Codes
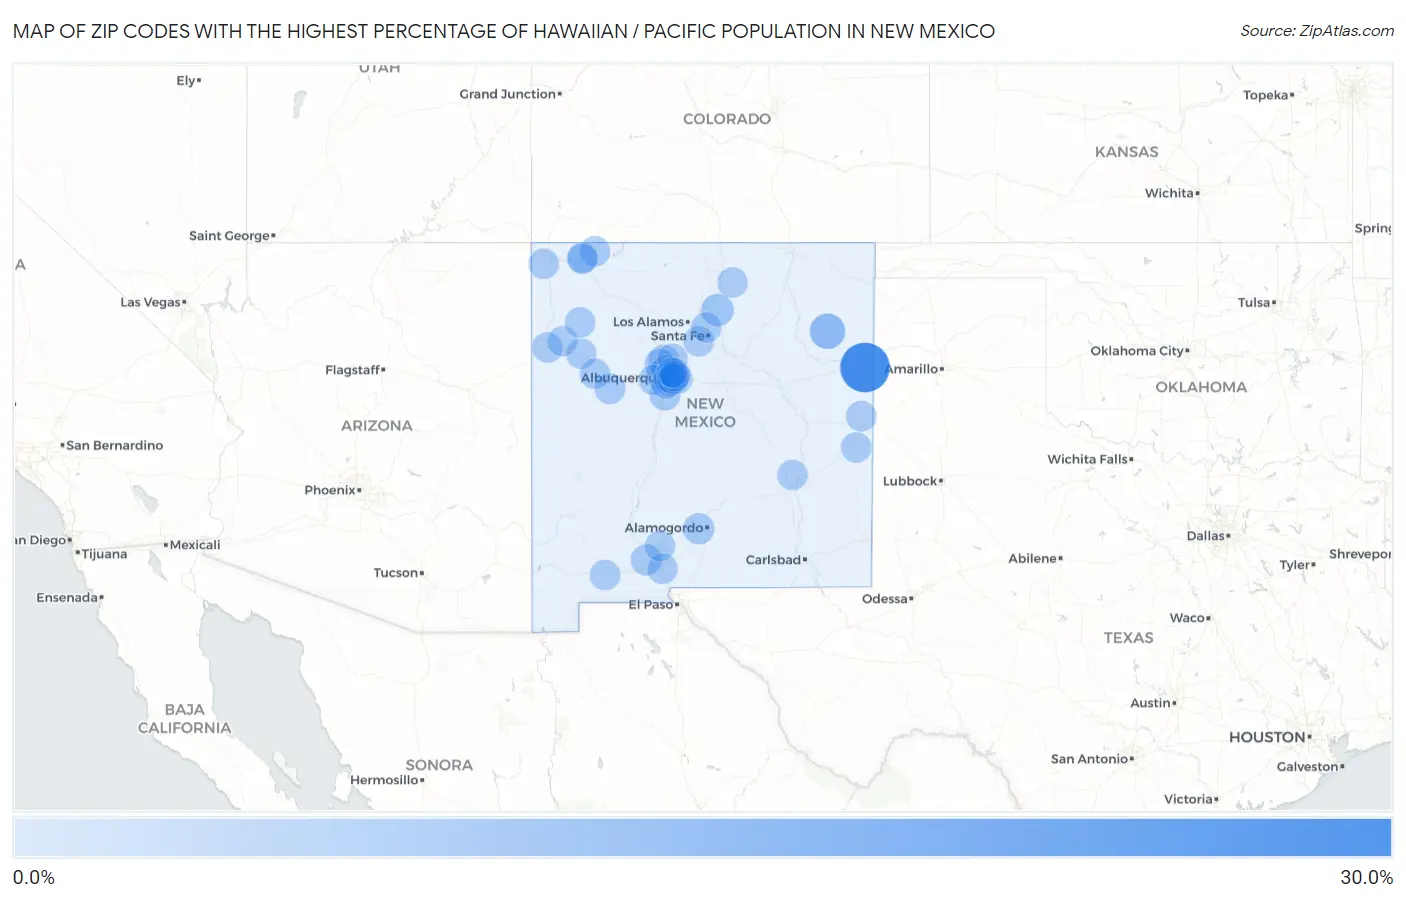
Map of Zip Codes with the Highest Percentage of Hawaiian / Pacific Population in New Mexico
0.0%
30.0%
Zip Codes with the Highest Percentage of Hawaiian / Pacific Population in New Mexico
| Zip Code | Hawaiian / Pacific | vs State | vs National | |
| 1. | 88411 | 27.3% | 0.088%(+27.2)#1 | 0.19%(+27.1)#12 |
| 2. | 87733 | 6.9% | 0.088%(+6.84)#2 | 0.19%(+6.74)#99 |
| 3. | 87578 | 2.8% | 0.088%(+2.72)#3 | 0.19%(+2.62)#235 |
| 4. | 88330 | 1.1% | 0.088%(+0.989)#4 | 0.19%(+0.887)#684 |
| 5. | 88007 | 1.0% | 0.088%(+0.945)#5 | 0.19%(+0.844)#709 |
| 6. | 87042 | 0.87% | 0.088%(+0.783)#6 | 0.19%(+0.682)#837 |
| 7. | 87034 | 0.67% | 0.088%(+0.583)#7 | 0.19%(+0.482)#1,115 |
| 8. | 87144 | 0.41% | 0.088%(+0.324)#8 | 0.19%(+0.223)#1,666 |
| 9. | 87116 | 0.41% | 0.088%(+0.323)#9 | 0.19%(+0.222)#1,669 |
| 10. | 87120 | 0.27% | 0.088%(+0.186)#10 | 0.19%(+0.084)#2,285 |
| 11. | 87124 | 0.26% | 0.088%(+0.175)#11 | 0.19%(+0.073)#2,355 |
| 12. | 88001 | 0.25% | 0.088%(+0.159)#12 | 0.19%(+0.058)#2,457 |
| 13. | 87507 | 0.22% | 0.088%(+0.132)#13 | 0.19%(+0.030)#2,648 |
| 14. | 87114 | 0.18% | 0.088%(+0.095)#14 | 0.19%(-0.006)#2,958 |
| 15. | 87301 | 0.18% | 0.088%(+0.095)#15 | 0.19%(-0.006)#2,962 |
| 16. | 88130 | 0.18% | 0.088%(+0.092)#16 | 0.19%(-0.009)#2,993 |
| 17. | 88101 | 0.16% | 0.088%(+0.075)#17 | 0.19%(-0.027)#3,195 |
| 18. | 87121 | 0.16% | 0.088%(+0.071)#18 | 0.19%(-0.030)#3,242 |
| 19. | 87106 | 0.15% | 0.088%(+0.060)#19 | 0.19%(-0.042)#3,374 |
| 20. | 87323 | 0.14% | 0.088%(+0.051)#20 | 0.19%(-0.051)#3,484 |
| 21. | 87311 | 0.12% | 0.088%(+0.032)#21 | 0.19%(-0.069)#3,737 |
| 22. | 88201 | 0.11% | 0.088%(+0.018)#22 | 0.19%(-0.083)#3,934 |
| 23. | 88012 | 0.091% | 0.088%(+0.004)#23 | 0.19%(-0.098)#4,204 |
| 24. | 87102 | 0.085% | 0.088%(-0.003)#24 | 0.19%(-0.104)#4,320 |
| 25. | 87420 | 0.081% | 0.088%(-0.006)#25 | 0.19%(-0.107)#4,392 |
| 26. | 87506 | 0.075% | 0.088%(-0.012)#26 | 0.19%(-0.113)#4,513 |
| 27. | 87402 | 0.068% | 0.088%(-0.020)#27 | 0.19%(-0.121)#4,693 |
| 28. | 87313 | 0.060% | 0.088%(-0.027)#28 | 0.19%(-0.129)#4,859 |
| 29. | 87123 | 0.060% | 0.088%(-0.028)#29 | 0.19%(-0.129)#4,862 |
| 30. | 87020 | 0.057% | 0.088%(-0.031)#30 | 0.19%(-0.132)#4,920 |
| 31. | 87004 | 0.052% | 0.088%(-0.036)#31 | 0.19%(-0.137)#5,050 |
| 32. | 88030 | 0.050% | 0.088%(-0.038)#32 | 0.19%(-0.139)#5,090 |
| 33. | 87105 | 0.047% | 0.088%(-0.041)#33 | 0.19%(-0.142)#5,157 |
| 34. | 87108 | 0.044% | 0.088%(-0.043)#34 | 0.19%(-0.144)#5,224 |
| 35. | 87111 | 0.026% | 0.088%(-0.061)#35 | 0.19%(-0.162)#5,775 |
| 36. | 87112 | 0.026% | 0.088%(-0.062)#36 | 0.19%(-0.163)#5,805 |
| 37. | 87571 | 0.026% | 0.088%(-0.062)#37 | 0.19%(-0.163)#5,806 |
| 38. | 87410 | 0.020% | 0.088%(-0.068)#38 | 0.19%(-0.169)#5,988 |
| 39. | 87401 | 0.019% | 0.088%(-0.068)#39 | 0.19%(-0.169)#6,005 |
| 40. | 87109 | 0.0099% | 0.088%(-0.078)#40 | 0.19%(-0.179)#6,281 |
Common Questions
What are the Top 10 Zip Codes with the Highest Percentage of Hawaiian / Pacific Population in New Mexico?
Top 10 Zip Codes with the Highest Percentage of Hawaiian / Pacific Population in New Mexico are:
What zip code has the Highest Percentage of Hawaiian / Pacific Population in New Mexico?
88411 has the Highest Percentage of Hawaiian / Pacific Population in New Mexico with 27.3%.
What is the Percentage of Hawaiian / Pacific Population in the State of New Mexico?
Percentage of Hawaiian / Pacific Population in New Mexico is 0.088%.
What is the Percentage of Hawaiian / Pacific Population in the United States?
Percentage of Hawaiian / Pacific Population in the United States is 0.19%.