Zip Codes with the Highest Percentage of Households with Income Below $10,000 in Belleville, IL
RELATED REPORTS & OPTIONS
Household Income | $0-10k
Belleville
Compare Zip Codes
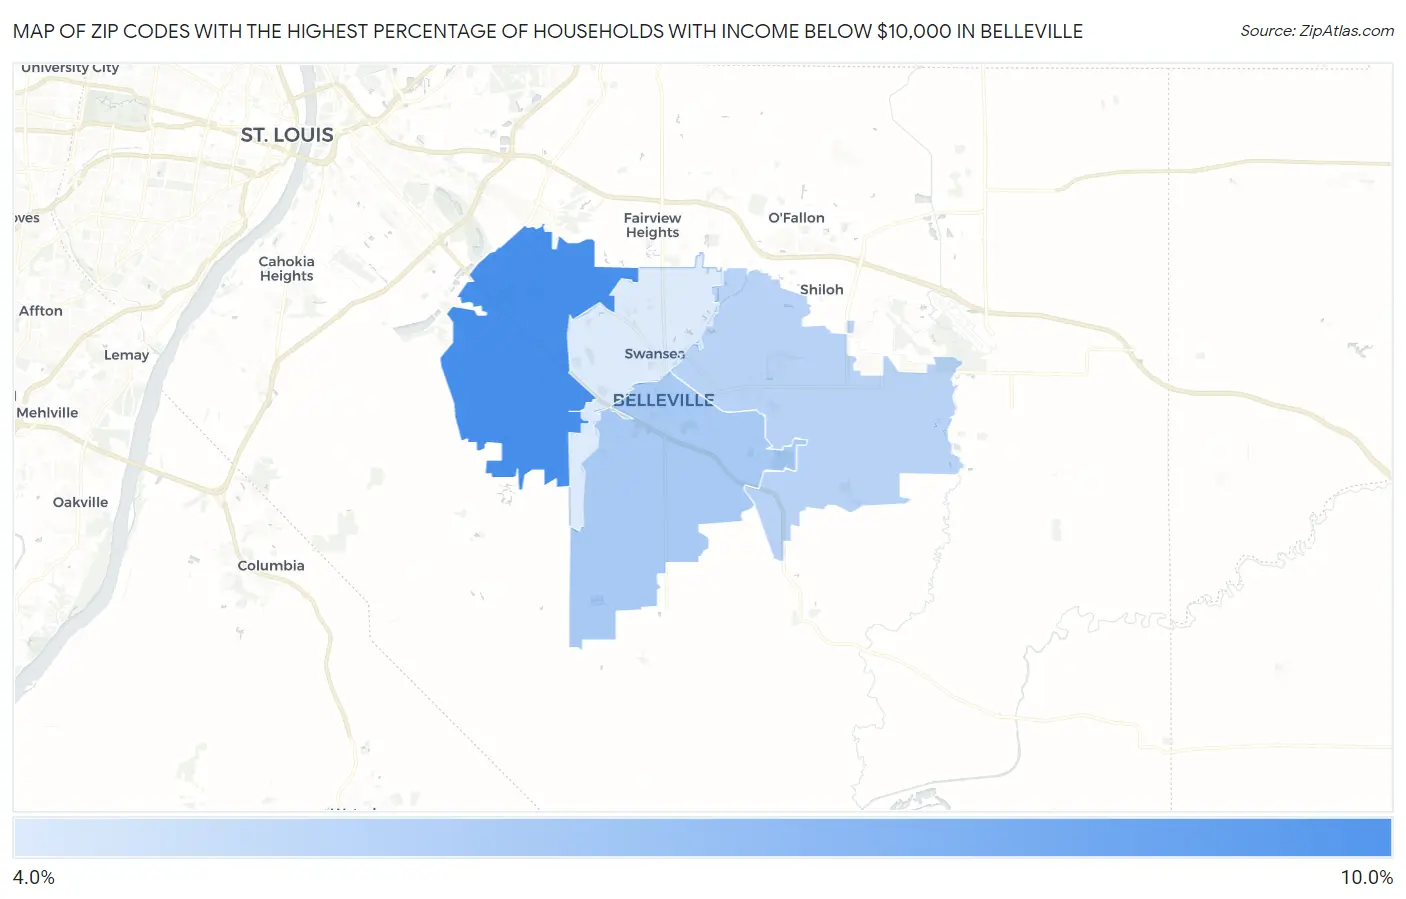
Map of Zip Codes with the Highest Percentage of Households with Income Below $10,000 in Belleville
0.0%
10.0%
Zip Codes with the Highest Percentage of Households with Income Below $10,000 in Belleville, IL
| Zip Code | Households with Income < $10k | vs State | vs National | |
| 1. | 62223 | 9.2% | 5.3%(+3.90)#126 | 4.9%(+4.30)#4,216 |
| 2. | 62220 | 6.2% | 5.3%(+0.900)#317 | 4.9%(+1.30)#8,562 |
| 3. | 62221 | 5.7% | 5.3%(+0.400)#368 | 4.9%(+0.800)#9,717 |
| 4. | 62226 | 4.6% | 5.3%(-0.700)#510 | 4.9%(-0.300)#13,025 |
1
Common Questions
What are the Top 3 Zip Codes with the Highest Percentage of Households with Income Below $10,000 in Belleville, IL?
Top 3 Zip Codes with the Highest Percentage of Households with Income Below $10,000 in Belleville, IL are:
What zip code has the Highest Percentage of Households with Income Below $10,000 in Belleville, IL?
62223 has the Highest Percentage of Households with Income Below $10,000 in Belleville, IL with 9.2%.
What is the Percentage of Households with Income Below $10,000 in Belleville, IL?
Percentage of Households with Income Below $10,000 in Belleville is 6.5%.
What is the Percentage of Households with Income Below $10,000 in Illinois?
Percentage of Households with Income Below $10,000 in Illinois is 5.3%.
What is the Percentage of Households with Income Below $10,000 in the United States?
Percentage of Households with Income Below $10,000 in the United States is 4.9%.