Zip Codes with the Highest Percentage of Households with Income Below $10,000 in Hawaii
RELATED REPORTS & OPTIONS
Household Income | $0-10k
Hawaii
Compare Zip Codes
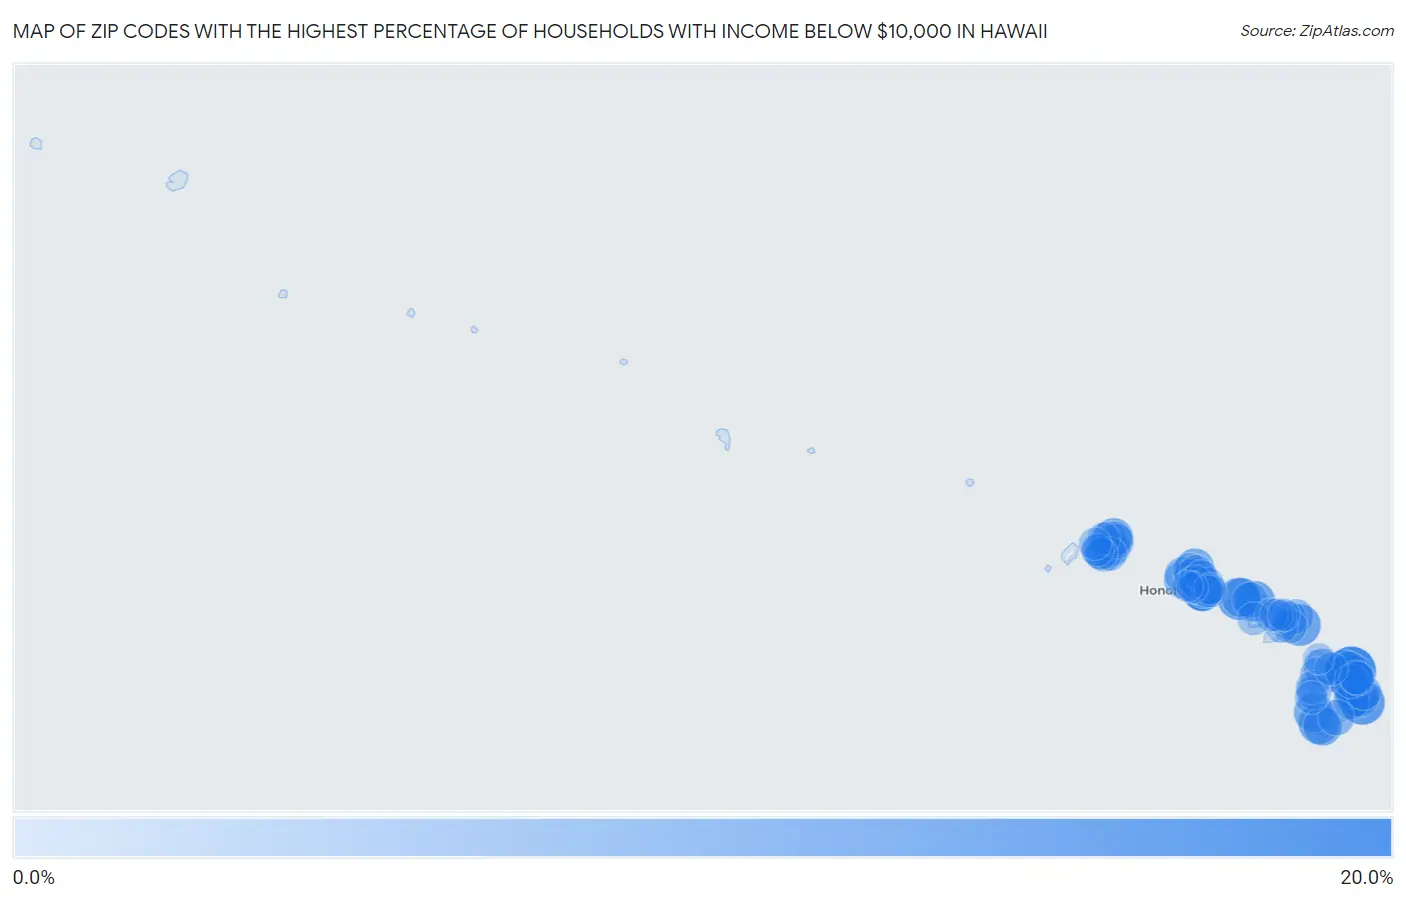
Map of Zip Codes with the Highest Percentage of Households with Income Below $10,000 in Hawaii
0.0%
20.0%
Zip Codes with the Highest Percentage of Households with Income Below $10,000 in Hawaii
| Zip Code | Households with Income < $10k | vs State | vs National | |
| 1. | 96780 | 20.0% | 4.2%(+15.8)#1 | 4.9%(+15.1)#795 |
| 2. | 96710 | 17.3% | 4.2%(+13.1)#2 | 4.9%(+12.4)#1,122 |
| 3. | 96778 | 14.6% | 4.2%(+10.4)#3 | 4.9%(+9.70)#1,617 |
| 4. | 96770 | 12.0% | 4.2%(+7.80)#4 | 4.9%(+7.10)#2,486 |
| 5. | 96713 | 11.7% | 4.2%(+7.50)#5 | 4.9%(+6.80)#2,605 |
| 6. | 96748 | 10.5% | 4.2%(+6.30)#6 | 4.9%(+5.60)#3,250 |
| 7. | 96737 | 10.3% | 4.2%(+6.10)#7 | 4.9%(+5.40)#3,382 |
| 8. | 96704 | 9.7% | 4.2%(+5.50)#8 | 4.9%(+4.80)#3,820 |
| 9. | 96729 | 9.3% | 4.2%(+5.10)#9 | 4.9%(+4.40)#4,155 |
| 10. | 96826 | 8.8% | 4.2%(+4.60)#10 | 4.9%(+3.90)#4,613 |
| 11. | 96754 | 8.8% | 4.2%(+4.60)#11 | 4.9%(+3.90)#4,647 |
| 12. | 96814 | 8.6% | 4.2%(+4.40)#12 | 4.9%(+3.70)#4,834 |
| 13. | 96772 | 8.6% | 4.2%(+4.40)#13 | 4.9%(+3.70)#4,874 |
| 14. | 96771 | 8.4% | 4.2%(+4.20)#14 | 4.9%(+3.50)#5,059 |
| 15. | 96760 | 8.1% | 4.2%(+3.90)#15 | 4.9%(+3.20)#5,469 |
| 16. | 96731 | 8.0% | 4.2%(+3.80)#16 | 4.9%(+3.10)#5,610 |
| 17. | 96815 | 7.6% | 4.2%(+3.40)#17 | 4.9%(+2.70)#6,079 |
| 18. | 96776 | 7.6% | 4.2%(+3.40)#18 | 4.9%(+2.70)#6,149 |
| 19. | 96743 | 7.4% | 4.2%(+3.20)#19 | 4.9%(+2.50)#6,375 |
| 20. | 96764 | 7.1% | 4.2%(+2.90)#20 | 4.9%(+2.20)#6,914 |
| 21. | 96792 | 7.0% | 4.2%(+2.80)#21 | 4.9%(+2.10)#6,945 |
| 22. | 96720 | 6.9% | 4.2%(+2.70)#22 | 4.9%(+2.00)#7,100 |
| 23. | 96785 | 5.9% | 4.2%(+1.70)#23 | 4.9%(+1.00)#9,316 |
| 24. | 96777 | 5.8% | 4.2%(+1.60)#24 | 4.9%(+0.900)#9,611 |
| 25. | 96813 | 5.7% | 4.2%(+1.50)#25 | 4.9%(+0.800)#9,726 |
| 26. | 96766 | 5.6% | 4.2%(+1.40)#26 | 4.9%(+0.700)#10,010 |
| 27. | 96791 | 5.6% | 4.2%(+1.40)#27 | 4.9%(+0.700)#10,046 |
| 28. | 96757 | 5.5% | 4.2%(+1.30)#28 | 4.9%(+0.600)#10,408 |
| 29. | 96741 | 5.3% | 4.2%(+1.10)#29 | 4.9%(+0.400)#10,858 |
| 30. | 96705 | 5.3% | 4.2%(+1.10)#30 | 4.9%(+0.400)#10,930 |
| 31. | 96749 | 5.0% | 4.2%(+0.800)#31 | 4.9%(+0.100)#11,731 |
| 32. | 96769 | 5.0% | 4.2%(+0.800)#32 | 4.9%(+0.100)#11,948 |
| 33. | 96717 | 4.9% | 4.2%(+0.700)#33 | 4.9%(=0.000)#12,139 |
| 34. | 96722 | 4.8% | 4.2%(+0.600)#34 | 4.9%(-0.100)#12,489 |
| 35. | 96746 | 4.7% | 4.2%(+0.500)#35 | 4.9%(-0.200)#12,693 |
| 36. | 96738 | 4.7% | 4.2%(+0.500)#36 | 4.9%(-0.200)#12,763 |
| 37. | 96703 | 4.5% | 4.2%(+0.300)#37 | 4.9%(-0.400)#13,514 |
| 38. | 96725 | 4.4% | 4.2%(+0.200)#38 | 4.9%(-0.500)#13,852 |
| 39. | 96708 | 4.3% | 4.2%(+0.100)#39 | 4.9%(-0.600)#14,172 |
| 40. | 96786 | 4.1% | 4.2%(-0.100)#40 | 4.9%(-0.800)#14,813 |
| 41. | 96768 | 4.1% | 4.2%(-0.100)#41 | 4.9%(-0.800)#14,905 |
| 42. | 96712 | 4.1% | 4.2%(-0.100)#42 | 4.9%(-0.800)#14,979 |
| 43. | 96817 | 4.0% | 4.2%(-0.200)#43 | 4.9%(-0.900)#15,195 |
| 44. | 96819 | 3.9% | 4.2%(-0.300)#44 | 4.9%(-1.00)#15,586 |
| 45. | 96822 | 3.9% | 4.2%(-0.300)#45 | 4.9%(-1.00)#15,596 |
| 46. | 96790 | 3.9% | 4.2%(-0.300)#46 | 4.9%(-1.00)#15,738 |
| 47. | 96756 | 3.8% | 4.2%(-0.400)#47 | 4.9%(-1.10)#16,166 |
| 48. | 96781 | 3.8% | 4.2%(-0.400)#48 | 4.9%(-1.10)#16,264 |
| 49. | 96816 | 3.6% | 4.2%(-0.600)#49 | 4.9%(-1.30)#16,783 |
| 50. | 96782 | 3.6% | 4.2%(-0.600)#50 | 4.9%(-1.30)#16,813 |
| 51. | 96783 | 3.6% | 4.2%(-0.600)#51 | 4.9%(-1.30)#17,076 |
| 52. | 96728 | 3.6% | 4.2%(-0.600)#52 | 4.9%(-1.30)#17,149 |
| 53. | 96797 | 3.3% | 4.2%(-0.900)#53 | 4.9%(-1.60)#18,028 |
| 54. | 96744 | 3.2% | 4.2%(-1.00)#54 | 4.9%(-1.70)#18,443 |
| 55. | 96701 | 3.2% | 4.2%(-1.00)#55 | 4.9%(-1.70)#18,472 |
| 56. | 96740 | 3.2% | 4.2%(-1.00)#56 | 4.9%(-1.70)#18,474 |
| 57. | 96727 | 3.2% | 4.2%(-1.00)#57 | 4.9%(-1.70)#18,669 |
| 58. | 96762 | 3.0% | 4.2%(-1.20)#58 | 4.9%(-1.90)#19,503 |
| 59. | 96818 | 2.8% | 4.2%(-1.40)#59 | 4.9%(-2.10)#20,216 |
| 60. | 96753 | 2.8% | 4.2%(-1.40)#60 | 4.9%(-2.10)#20,287 |
| 61. | 96732 | 2.8% | 4.2%(-1.40)#61 | 4.9%(-2.10)#20,299 |
| 62. | 96761 | 2.8% | 4.2%(-1.40)#62 | 4.9%(-2.10)#20,315 |
| 63. | 96763 | 2.8% | 4.2%(-1.40)#63 | 4.9%(-2.10)#20,469 |
| 64. | 96793 | 2.6% | 4.2%(-1.60)#64 | 4.9%(-2.30)#21,091 |
| 65. | 96750 | 2.6% | 4.2%(-1.60)#65 | 4.9%(-2.30)#21,324 |
| 66. | 96714 | 2.5% | 4.2%(-1.70)#66 | 4.9%(-2.40)#21,861 |
| 67. | 96734 | 2.3% | 4.2%(-1.90)#67 | 4.9%(-2.60)#22,405 |
| 68. | 96716 | 2.3% | 4.2%(-1.90)#68 | 4.9%(-2.60)#22,657 |
| 69. | 96796 | 2.3% | 4.2%(-1.90)#69 | 4.9%(-2.60)#22,681 |
| 70. | 96789 | 2.2% | 4.2%(-2.00)#70 | 4.9%(-2.70)#22,828 |
| 71. | 96752 | 2.2% | 4.2%(-2.00)#71 | 4.9%(-2.70)#23,045 |
| 72. | 96779 | 2.2% | 4.2%(-2.00)#72 | 4.9%(-2.70)#23,058 |
| 73. | 96730 | 2.1% | 4.2%(-2.10)#73 | 4.9%(-2.80)#23,458 |
| 74. | 96825 | 1.9% | 4.2%(-2.30)#74 | 4.9%(-3.00)#24,000 |
| 75. | 96821 | 1.9% | 4.2%(-2.30)#75 | 4.9%(-3.00)#24,043 |
| 76. | 96795 | 1.4% | 4.2%(-2.80)#76 | 4.9%(-3.50)#25,762 |
| 77. | 96706 | 1.2% | 4.2%(-3.00)#77 | 4.9%(-3.70)#26,282 |
| 78. | 96707 | 1.1% | 4.2%(-3.10)#78 | 4.9%(-3.80)#26,509 |
| 79. | 96755 | 0.90% | 4.2%(-3.30)#79 | 4.9%(-4.00)#27,105 |
1
Common Questions
What are the Top 10 Zip Codes with the Highest Percentage of Households with Income Below $10,000 in Hawaii?
Top 10 Zip Codes with the Highest Percentage of Households with Income Below $10,000 in Hawaii are:
What zip code has the Highest Percentage of Households with Income Below $10,000 in Hawaii?
96780 has the Highest Percentage of Households with Income Below $10,000 in Hawaii with 20.0%.
What is the Percentage of Households with Income Below $10,000 in the State of Hawaii?
Percentage of Households with Income Below $10,000 in Hawaii is 4.2%.
What is the Percentage of Households with Income Below $10,000 in the United States?
Percentage of Households with Income Below $10,000 in the United States is 4.9%.