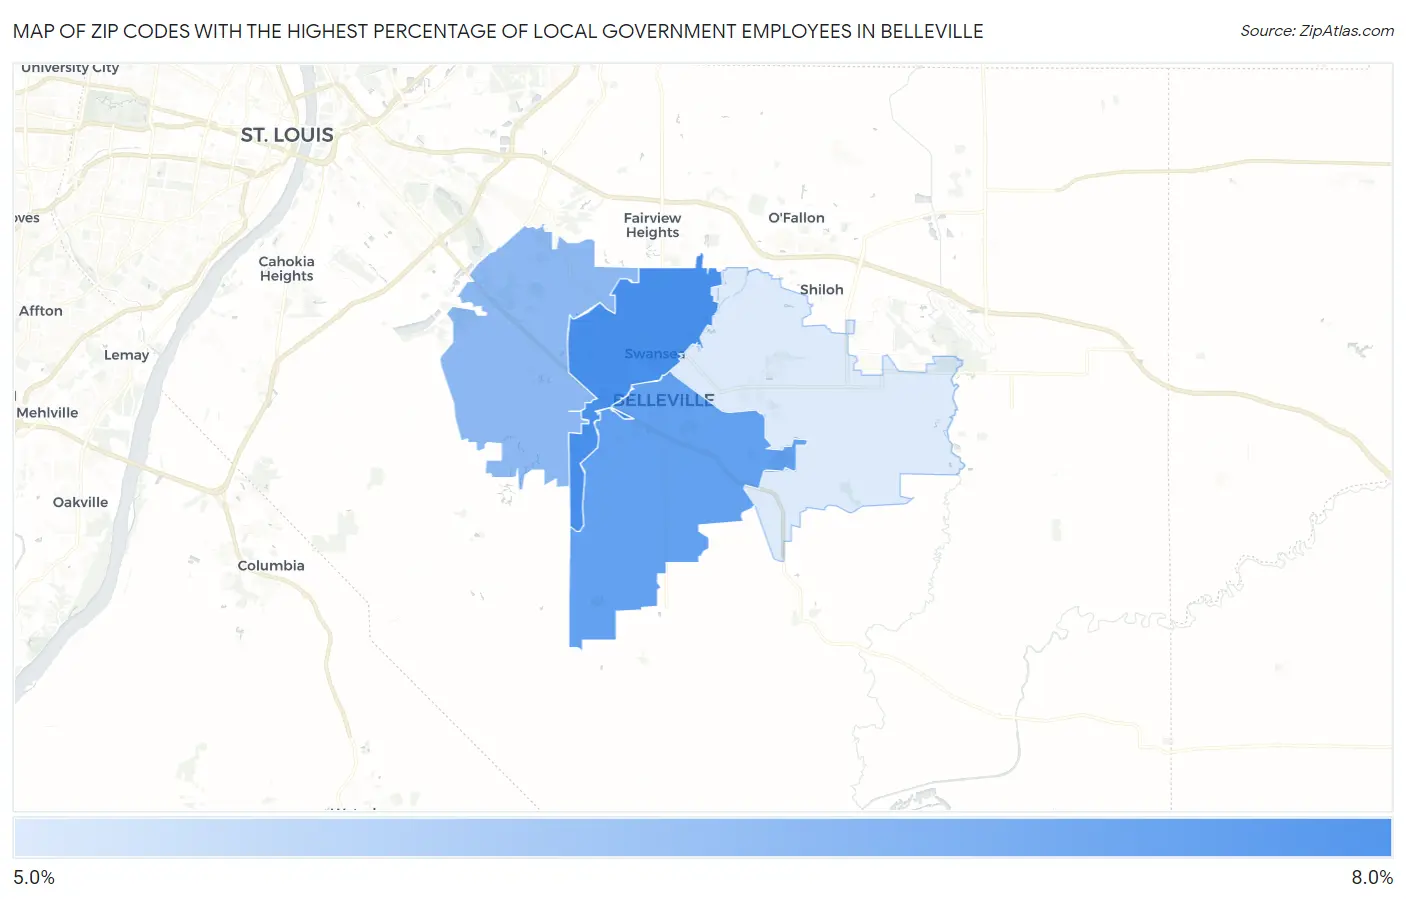
Zip Codes with the Highest Percentage of Local Government Employees in Belleville, IL
RELATED REPORTS & OPTIONS
Local Government Employees
Belleville
Compare Zip Codes
Map of Zip Codes with the Highest Percentage of Local Government Employees in Belleville
0.0%
8.0%
Zip Codes with the Highest Percentage of Local Government Employees in Belleville, IL
| Zip Code | % Local Government Employees | vs State | vs National | |
| 1. | 62226 | 7.9% | 7.4%(+0.538)#540 | 7.2%(+0.680)#13,462 |
| 2. | 62220 | 7.5% | 7.4%(+0.151)#604 | 7.2%(+0.293)#14,698 |
| 3. | 62223 | 6.9% | 7.4%(-0.454)#700 | 7.2%(-0.312)#16,646 |
| 4. | 62221 | 5.8% | 7.4%(-1.58)#875 | 7.2%(-1.43)#20,480 |
1
Common Questions
What are the Top 3 Zip Codes with the Highest Percentage of Local Government Employees in Belleville, IL?
Top 3 Zip Codes with the Highest Percentage of Local Government Employees in Belleville, IL are:
What zip code has the Highest Percentage of Local Government Employees in Belleville, IL?
62226 has the Highest Percentage of Local Government Employees in Belleville, IL with 7.9%.
What is the Percentage of Local Government Employees in Belleville, IL?
Percentage of Local Government Employees in Belleville is 6.8%.
What is the Percentage of Local Government Employees in Illinois?
Percentage of Local Government Employees in Illinois is 7.4%.
What is the Percentage of Local Government Employees in the United States?
Percentage of Local Government Employees in the United States is 7.2%.