Zip Codes with the Highest Percentage of Population Taking Taxi / Cab to Work in Belleville, IL
RELATED REPORTS & OPTIONS
Taxi / Cab
Belleville
Compare Zip Codes
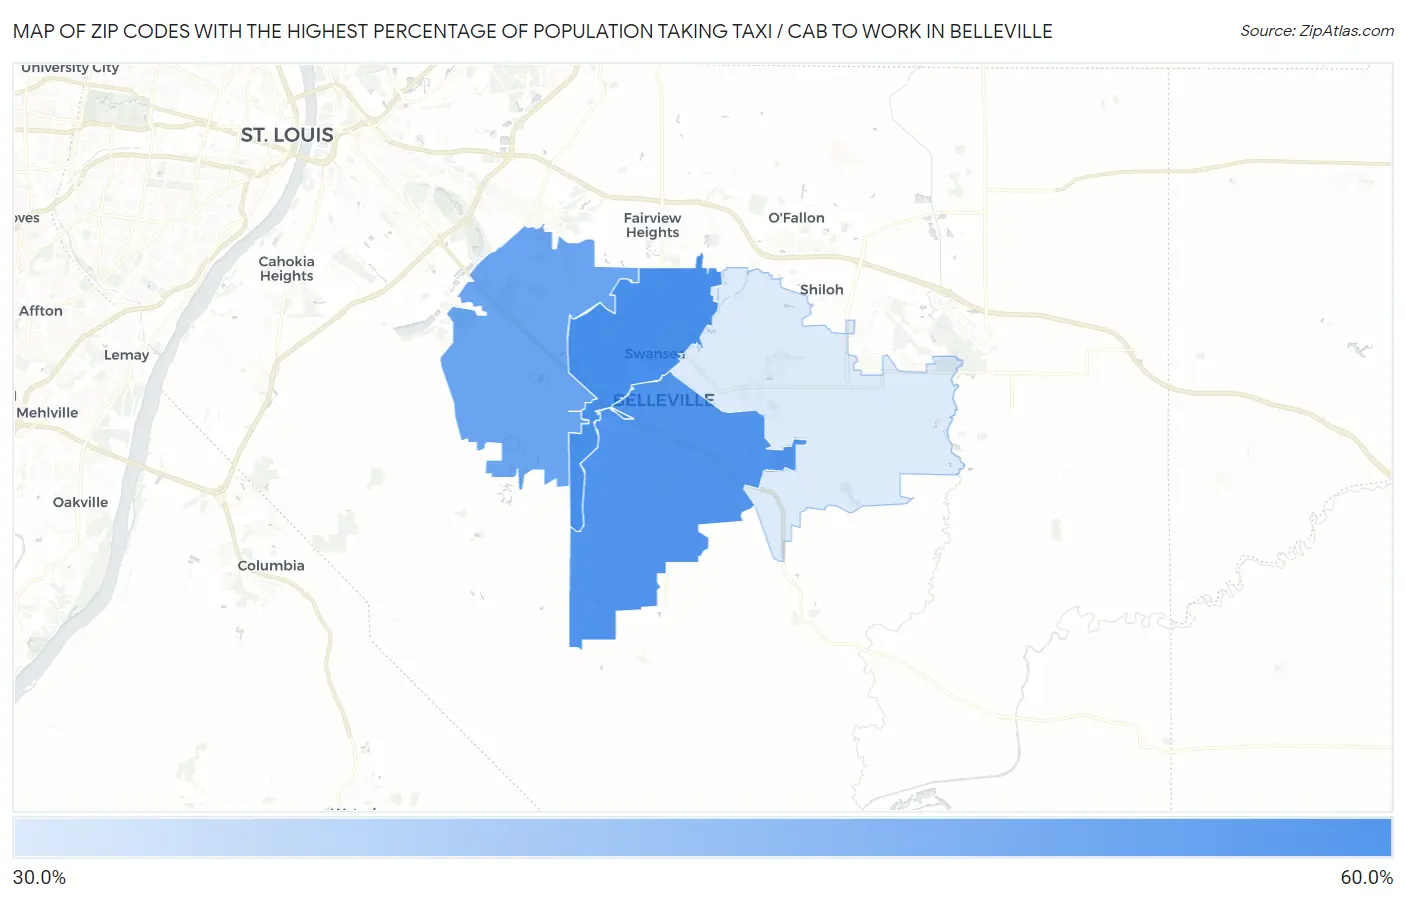
Map of Zip Codes with the Highest Percentage of Population Taking Taxi / Cab to Work in Belleville
0.0%
60.0%
Zip Codes with the Highest Percentage of Population Taking Taxi / Cab to Work in Belleville, IL
| Zip Code | % Take Taxi / Cab | vs State | vs National | |
| 1. | 62226 | 54.1% | 37.8%(+16.3)#63 | 38.2%(+15.9)#1,814 |
| 2. | 62220 | 52.9% | 37.8%(+15.1)#76 | 38.2%(+14.7)#2,143 |
| 3. | 62223 | 49.6% | 37.8%(+11.8)#124 | 38.2%(+11.4)#3,068 |
| 4. | 62221 | 35.2% | 37.8%(-2.60)#334 | 38.2%(-3.00)#8,811 |
1
Common Questions
What are the Top 3 Zip Codes with the Highest Percentage of Population Taking Taxi / Cab to Work in Belleville, IL?
Top 3 Zip Codes with the Highest Percentage of Population Taking Taxi / Cab to Work in Belleville, IL are:
What zip code has the Highest Percentage of Population Taking Taxi / Cab to Work in Belleville, IL?
62226 has the Highest Percentage of Population Taking Taxi / Cab to Work in Belleville, IL with 54.1%.
What is the Percentage of Population Taking Taxi / Cab to Work in Belleville, IL?
Percentage of Population Taking Taxi / Cab to Work in Belleville is 43.5%.
What is the Percentage of Population Taking Taxi / Cab to Work in Illinois?
Percentage of Population Taking Taxi / Cab to Work in Illinois is 37.8%.
What is the Percentage of Population Taking Taxi / Cab to Work in the United States?
Percentage of Population Taking Taxi / Cab to Work in the United States is 38.2%.