Zip Codes with the Highest Percentage of Households with Income Below $10,000 in Bloomington, IL
RELATED REPORTS & OPTIONS
Household Income | $0-10k
Bloomington
Compare Zip Codes
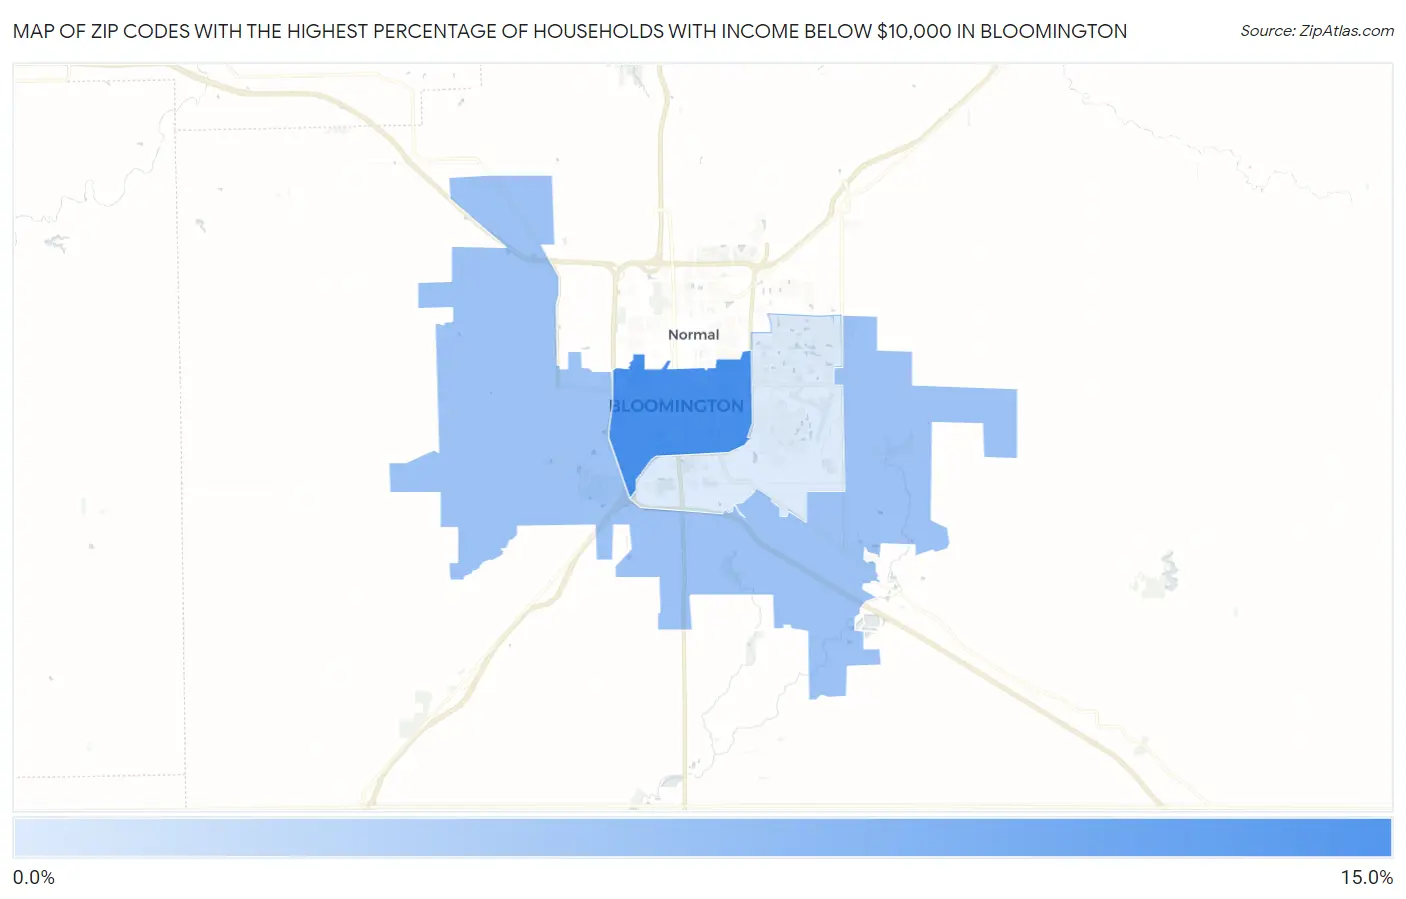
Map of Zip Codes with the Highest Percentage of Households with Income Below $10,000 in Bloomington
0.0%
15.0%
Zip Codes with the Highest Percentage of Households with Income Below $10,000 in Bloomington, IL
| Zip Code | Households with Income < $10k | vs State | vs National | |
| 1. | 61701 | 10.7% | 5.3%(+5.40)#92 | 4.9%(+5.80)#3,116 |
| 2. | 61705 | 7.0% | 5.3%(+1.70)#251 | 4.9%(+2.10)#6,993 |
| 3. | 61704 | 4.1% | 5.3%(-1.20)#591 | 4.9%(-0.800)#14,831 |
1
Common Questions
What are the Top Zip Codes with the Highest Percentage of Households with Income Below $10,000 in Bloomington, IL?
Top Zip Codes with the Highest Percentage of Households with Income Below $10,000 in Bloomington, IL are:
What zip code has the Highest Percentage of Households with Income Below $10,000 in Bloomington, IL?
61701 has the Highest Percentage of Households with Income Below $10,000 in Bloomington, IL with 10.7%.
What is the Percentage of Households with Income Below $10,000 in Bloomington, IL?
Percentage of Households with Income Below $10,000 in Bloomington is 7.8%.
What is the Percentage of Households with Income Below $10,000 in Illinois?
Percentage of Households with Income Below $10,000 in Illinois is 5.3%.
What is the Percentage of Households with Income Below $10,000 in the United States?
Percentage of Households with Income Below $10,000 in the United States is 4.9%.