Zip Codes with the Highest Percentage of Population Employed in Community & Social Service in Belleville, IL
RELATED REPORTS & OPTIONS
Community & Social Service
Belleville
Compare Zip Codes
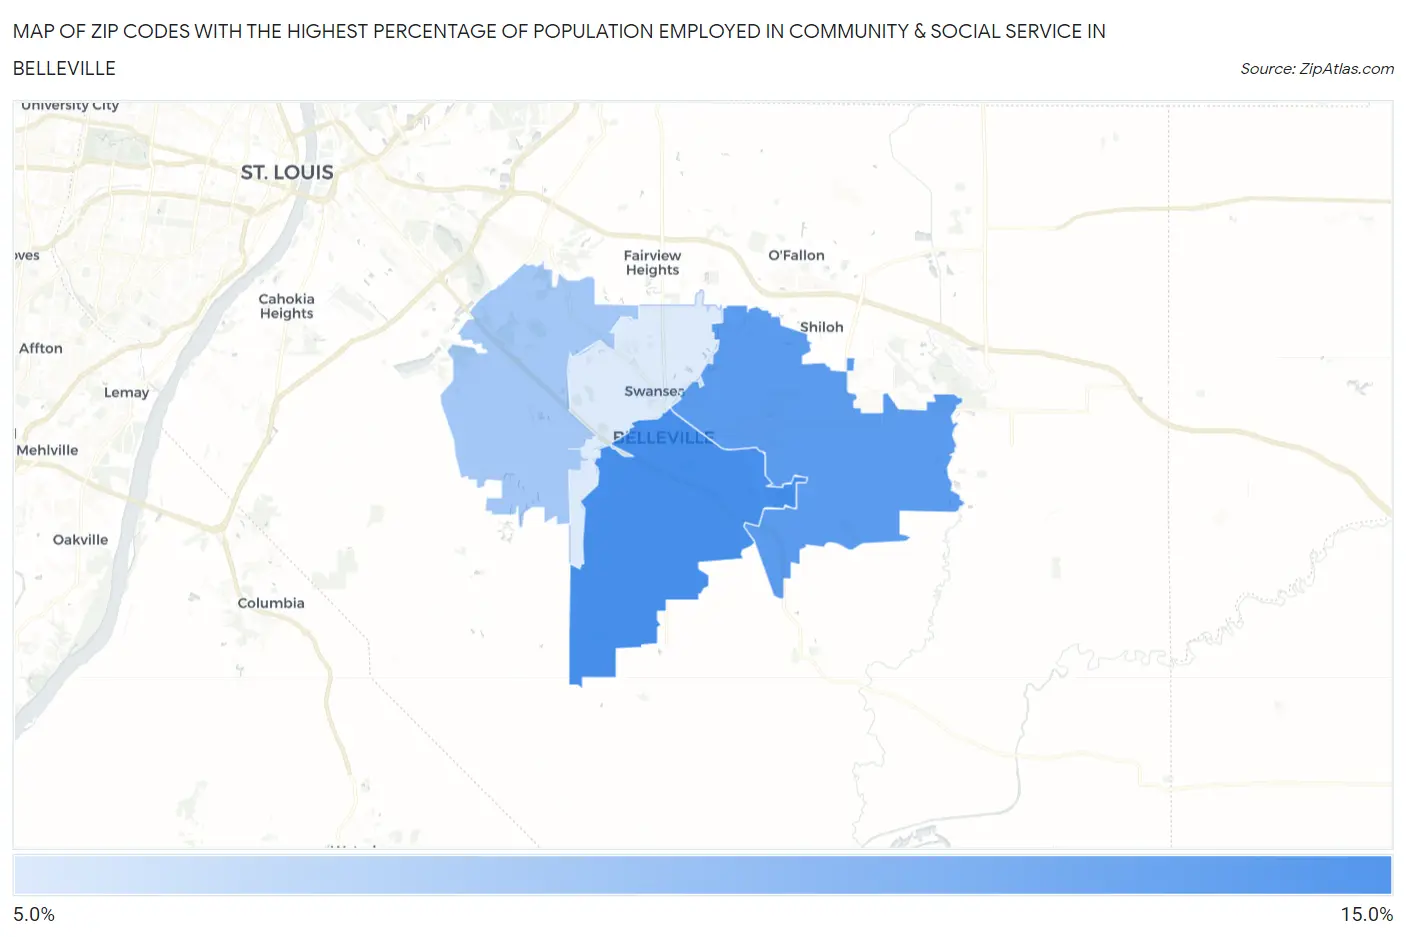
Map of Zip Codes with the Highest Percentage of Population Employed in Community & Social Service in Belleville
0.0%
15.0%
Zip Codes with the Highest Percentage of Population Employed in Community & Social Service in Belleville, IL
| Zip Code | % Employed | vs State | vs National | |
| 1. | 62220 | 14.0% | 11.3%(+2.70)#195 | 11.2%(+2.77)#6,102 |
| 2. | 62221 | 13.3% | 11.3%(+1.99)#229 | 11.2%(+2.06)#7,122 |
| 3. | 62223 | 11.0% | 11.3%(-0.294)#396 | 11.2%(-0.228)#11,679 |
| 4. | 62226 | 9.2% | 11.3%(-2.10)#614 | 11.2%(-2.03)#16,309 |
1
Common Questions
What are the Top 3 Zip Codes with the Highest Percentage of Population Employed in Community & Social Service in Belleville, IL?
Top 3 Zip Codes with the Highest Percentage of Population Employed in Community & Social Service in Belleville, IL are:
What zip code has the Highest Percentage of Population Employed in Community & Social Service in Belleville, IL?
62220 has the Highest Percentage of Population Employed in Community & Social Service in Belleville, IL with 14.0%.
What is the Percentage of Population Employed in Community & Social Service in Belleville, IL?
Percentage of Population Employed in Community & Social Service in Belleville is 11.0%.
What is the Percentage of Population Employed in Community & Social Service in Illinois?
Percentage of Population Employed in Community & Social Service in Illinois is 11.3%.
What is the Percentage of Population Employed in Community & Social Service in the United States?
Percentage of Population Employed in Community & Social Service in the United States is 11.2%.