Zip Codes with the Highest Percentage of Population Employed in Legal Services & Support in Belleville, IL
RELATED REPORTS & OPTIONS
Legal Services & Support
Belleville
Compare Zip Codes
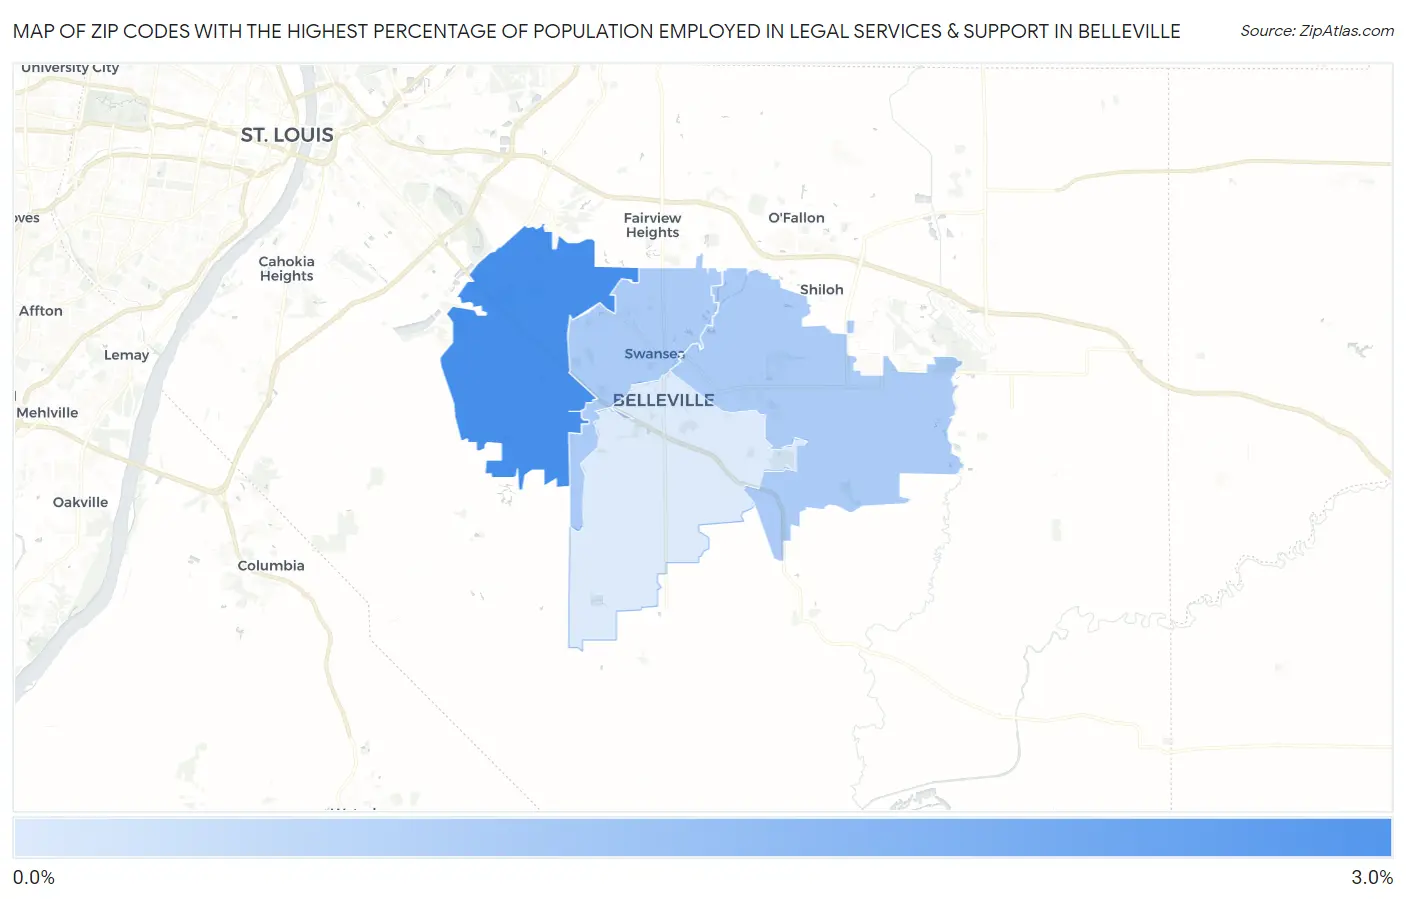
Map of Zip Codes with the Highest Percentage of Population Employed in Legal Services & Support in Belleville
0.0%
3.0%
Zip Codes with the Highest Percentage of Population Employed in Legal Services & Support in Belleville, IL
| Zip Code | % Employed | vs State | vs National | |
| 1. | 62223 | 2.7% | 1.3%(+1.40)#78 | 1.2%(+1.56)#2,139 |
| 2. | 62221 | 1.5% | 1.3%(+0.165)#183 | 1.2%(+0.330)#4,991 |
| 3. | 62226 | 1.5% | 1.3%(+0.155)#186 | 1.2%(+0.321)#5,030 |
| 4. | 62220 | 0.87% | 1.3%(-0.479)#329 | 1.2%(-0.313)#8,856 |
1
Common Questions
What are the Top 3 Zip Codes with the Highest Percentage of Population Employed in Legal Services & Support in Belleville, IL?
Top 3 Zip Codes with the Highest Percentage of Population Employed in Legal Services & Support in Belleville, IL are:
What zip code has the Highest Percentage of Population Employed in Legal Services & Support in Belleville, IL?
62223 has the Highest Percentage of Population Employed in Legal Services & Support in Belleville, IL with 2.7%.
What is the Percentage of Population Employed in Legal Services & Support in Belleville, IL?
Percentage of Population Employed in Legal Services & Support in Belleville is 1.3%.
What is the Percentage of Population Employed in Legal Services & Support in Illinois?
Percentage of Population Employed in Legal Services & Support in Illinois is 1.3%.
What is the Percentage of Population Employed in Legal Services & Support in the United States?
Percentage of Population Employed in Legal Services & Support in the United States is 1.2%.