Zip Codes with the Highest Percentage of Private Company Employees in Belleville, IL
RELATED REPORTS & OPTIONS
Private Company Employees
Belleville
Compare Zip Codes
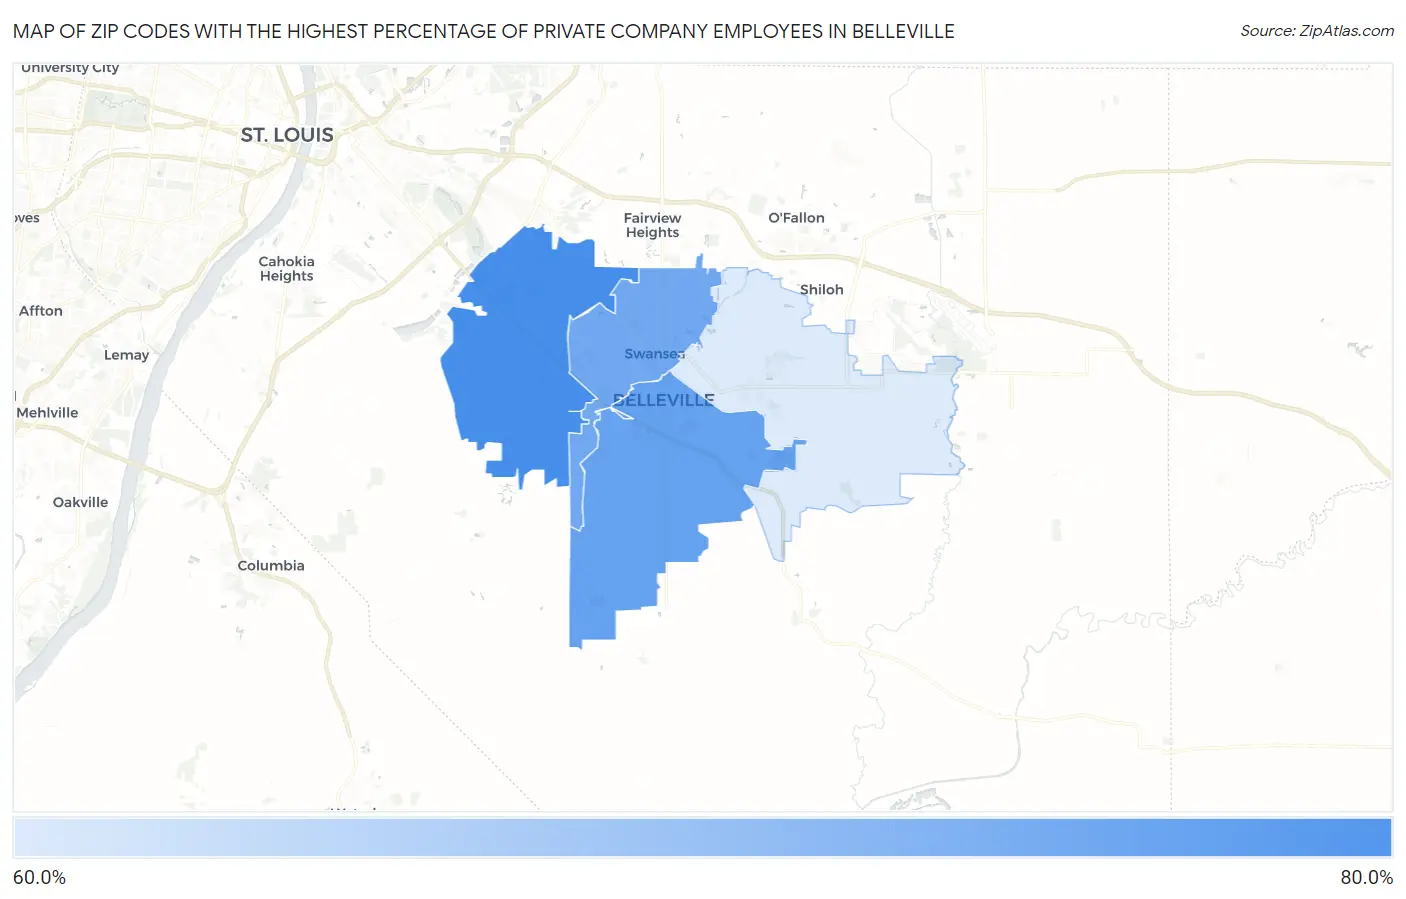
Map of Zip Codes with the Highest Percentage of Private Company Employees in Belleville
0.0%
80.0%
Zip Codes with the Highest Percentage of Private Company Employees in Belleville, IL
| Zip Code | % Private Company Employees | vs State | vs National | |
| 1. | 62223 | 68.4% | 69.1%(-0.624)#689 | 66.9%(+1.54)#12,445 |
| 2. | 62220 | 67.4% | 69.1%(-1.70)#761 | 66.9%(+0.463)#13,950 |
| 3. | 62226 | 67.0% | 69.1%(-2.10)#784 | 66.9%(+0.064)#14,418 |
| 4. | 62221 | 63.2% | 69.1%(-5.81)#983 | 66.9%(-3.65)#19,095 |
1
Common Questions
What are the Top 3 Zip Codes with the Highest Percentage of Private Company Employees in Belleville, IL?
Top 3 Zip Codes with the Highest Percentage of Private Company Employees in Belleville, IL are:
What zip code has the Highest Percentage of Private Company Employees in Belleville, IL?
62223 has the Highest Percentage of Private Company Employees in Belleville, IL with 68.4%.
What is the Percentage of Private Company Employees in Belleville, IL?
Percentage of Private Company Employees in Belleville is 68.6%.
What is the Percentage of Private Company Employees in Illinois?
Percentage of Private Company Employees in Illinois is 69.1%.
What is the Percentage of Private Company Employees in the United States?
Percentage of Private Company Employees in the United States is 66.9%.