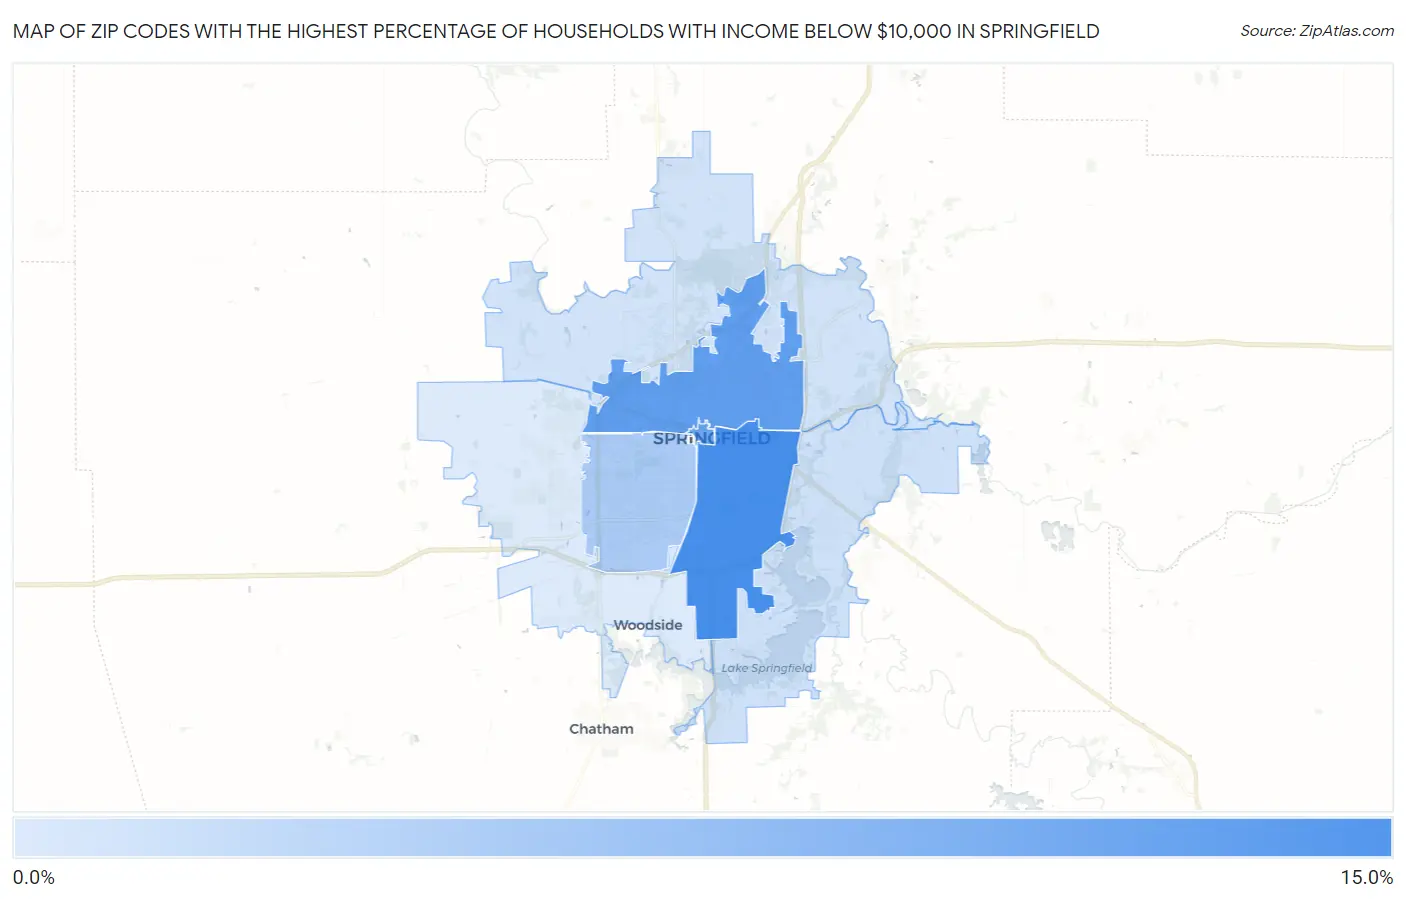
Zip Codes with the Highest Percentage of Households with Income Below $10,000 in Springfield, IL
RELATED REPORTS & OPTIONS
Household Income | $0-10k
Springfield
Compare Zip Codes
Map of Zip Codes with the Highest Percentage of Households with Income Below $10,000 in Springfield
0.0%
15.0%
Zip Codes with the Highest Percentage of Households with Income Below $10,000 in Springfield, IL
| Zip Code | Households with Income < $10k | vs State | vs National | |
| 1. | 62703 | 10.8% | 5.3%(+5.50)#89 | 4.9%(+5.90)#3,059 |
| 2. | 62702 | 9.3% | 5.3%(+4.00)#123 | 4.9%(+4.40)#4,097 |
| 3. | 62701 | 8.6% | 5.3%(+3.30)#154 | 4.9%(+3.70)#4,891 |
| 4. | 62704 | 4.9% | 5.3%(-0.400)#465 | 4.9%(=0.000)#11,986 |
| 5. | 62712 | 2.8% | 5.3%(-2.50)#853 | 4.9%(-2.10)#20,377 |
| 6. | 62707 | 2.6% | 5.3%(-2.70)#896 | 4.9%(-2.30)#21,253 |
| 7. | 62711 | 2.0% | 5.3%(-3.30)#1,006 | 4.9%(-2.90)#23,661 |
1
Common Questions
What are the Top 5 Zip Codes with the Highest Percentage of Households with Income Below $10,000 in Springfield, IL?
Top 5 Zip Codes with the Highest Percentage of Households with Income Below $10,000 in Springfield, IL are:
What zip code has the Highest Percentage of Households with Income Below $10,000 in Springfield, IL?
62703 has the Highest Percentage of Households with Income Below $10,000 in Springfield, IL with 10.8%.
What is the Percentage of Households with Income Below $10,000 in Springfield, IL?
Percentage of Households with Income Below $10,000 in Springfield is 7.1%.
What is the Percentage of Households with Income Below $10,000 in Illinois?
Percentage of Households with Income Below $10,000 in Illinois is 5.3%.
What is the Percentage of Households with Income Below $10,000 in the United States?
Percentage of Households with Income Below $10,000 in the United States is 4.9%.