Zip Codes with the Highest Percentage of Households with Income Below $10,000 in Plainfield, IL
RELATED REPORTS & OPTIONS
Household Income | $0-10k
Plainfield
Compare Zip Codes
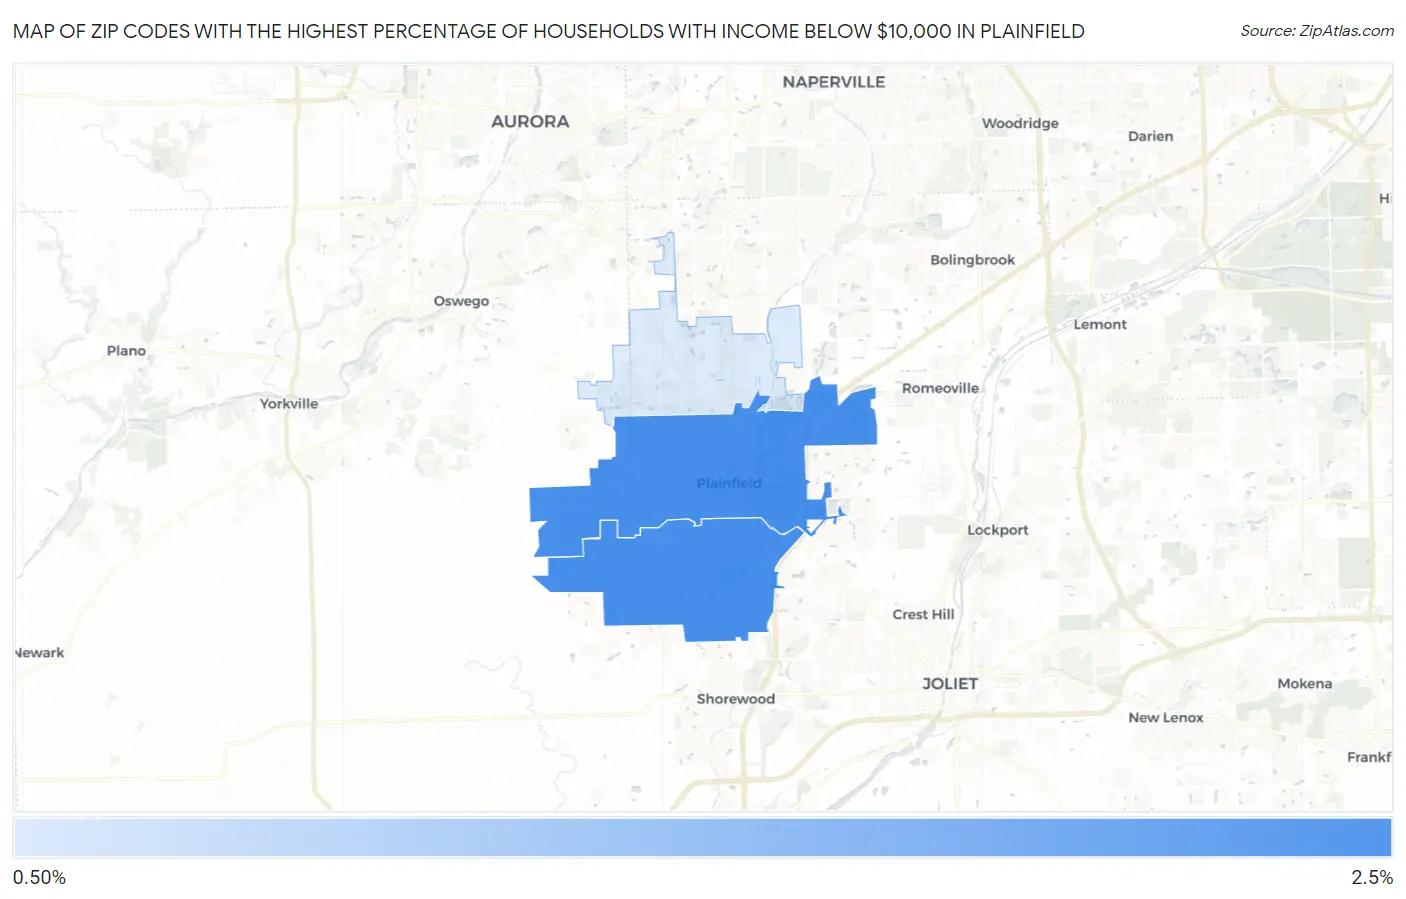
Map of Zip Codes with the Highest Percentage of Households with Income Below $10,000 in Plainfield
0.0%
2.5%
Zip Codes with the Highest Percentage of Households with Income Below $10,000 in Plainfield, IL
| Zip Code | Households with Income < $10k | vs State | vs National | |
| 1. | 60586 | 2.4% | 5.3%(-2.90)#924 | 4.9%(-2.50)#21,983 |
| 2. | 60544 | 2.4% | 5.3%(-2.90)#928 | 4.9%(-2.50)#22,035 |
| 3. | 60585 | 0.80% | 5.3%(-4.50)#1,174 | 4.9%(-4.10)#27,248 |
1
Common Questions
What are the Top Zip Codes with the Highest Percentage of Households with Income Below $10,000 in Plainfield, IL?
Top Zip Codes with the Highest Percentage of Households with Income Below $10,000 in Plainfield, IL are:
What zip code has the Highest Percentage of Households with Income Below $10,000 in Plainfield, IL?
60586 has the Highest Percentage of Households with Income Below $10,000 in Plainfield, IL with 2.4%.
What is the Percentage of Households with Income Below $10,000 in Plainfield, IL?
Percentage of Households with Income Below $10,000 in Plainfield is 1.0%.
What is the Percentage of Households with Income Below $10,000 in Illinois?
Percentage of Households with Income Below $10,000 in Illinois is 5.3%.
What is the Percentage of Households with Income Below $10,000 in the United States?
Percentage of Households with Income Below $10,000 in the United States is 4.9%.