Zip Codes with the Highest Percentage of Households with Income Below $10,000 in Melrose Park, IL
RELATED REPORTS & OPTIONS
Household Income | $0-10k
Melrose Park
Compare Zip Codes
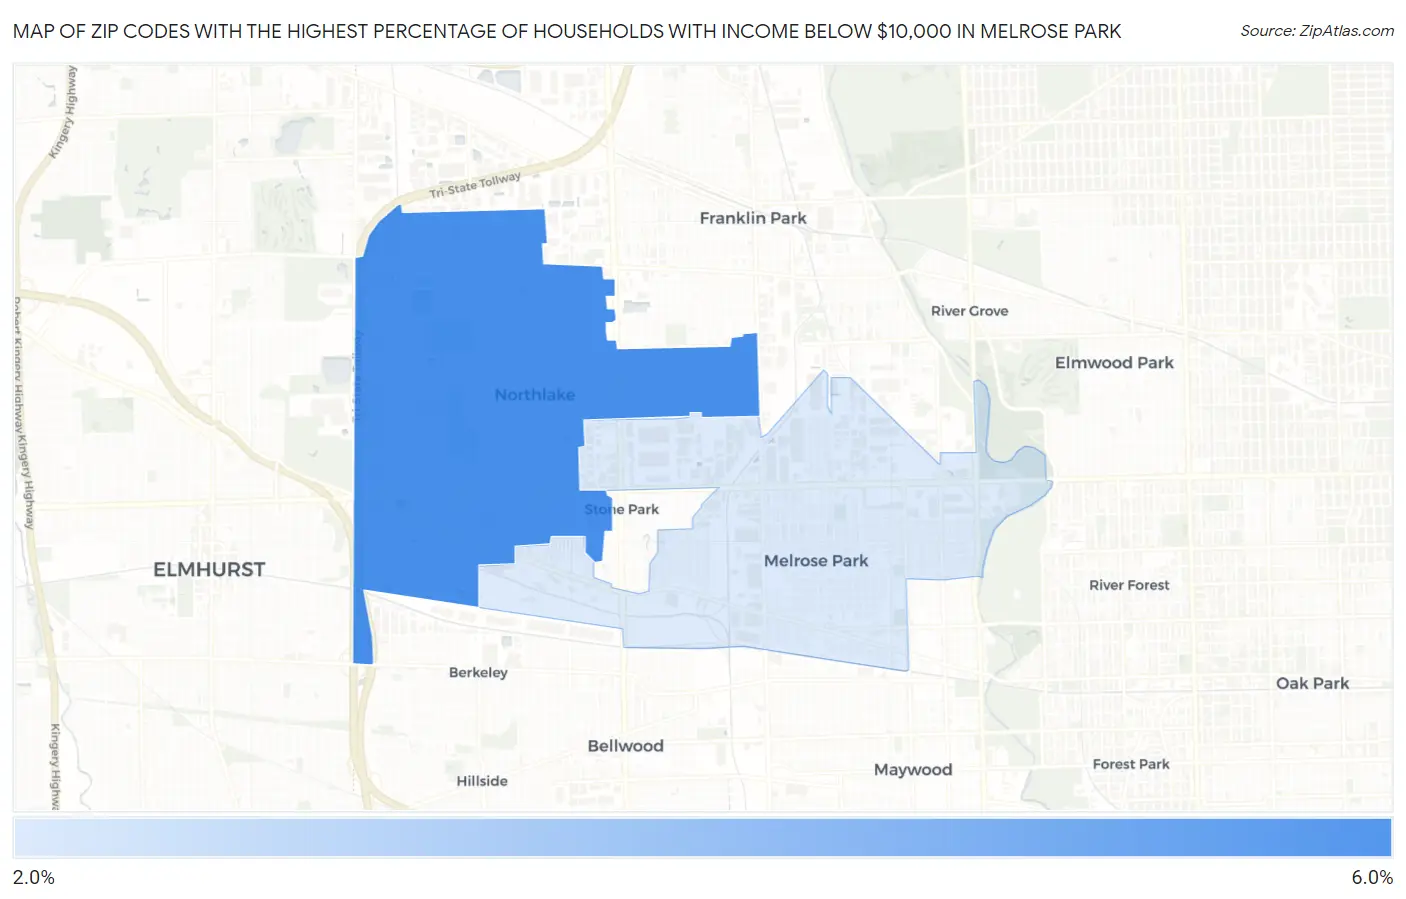
Map of Zip Codes with the Highest Percentage of Households with Income Below $10,000 in Melrose Park
0.0%
6.0%
Zip Codes with the Highest Percentage of Households with Income Below $10,000 in Melrose Park, IL
| Zip Code | Households with Income < $10k | vs State | vs National | |
| 1. | 60164 | 5.4% | 5.3%(+0.100)#406 | 4.9%(+0.500)#10,491 |
| 2. | 60160 | 2.6% | 5.3%(-2.70)#892 | 4.9%(-2.30)#21,133 |
1
Common Questions
What are the Top Zip Codes with the Highest Percentage of Households with Income Below $10,000 in Melrose Park, IL?
Top Zip Codes with the Highest Percentage of Households with Income Below $10,000 in Melrose Park, IL are:
What zip code has the Highest Percentage of Households with Income Below $10,000 in Melrose Park, IL?
60164 has the Highest Percentage of Households with Income Below $10,000 in Melrose Park, IL with 5.4%.
What is the Percentage of Households with Income Below $10,000 in Melrose Park, IL?
Percentage of Households with Income Below $10,000 in Melrose Park is 2.6%.
What is the Percentage of Households with Income Below $10,000 in Illinois?
Percentage of Households with Income Below $10,000 in Illinois is 5.3%.
What is the Percentage of Households with Income Below $10,000 in the United States?
Percentage of Households with Income Below $10,000 in the United States is 4.9%.