Immigrants from Uganda vs Czechoslovakian Married-couple Households

COMPARE

Immigrants from Uganda
Race
Ancestry
AfghanAfricanAlaska NativeAlaskan AthabascanAlbanianAleutAlsatianAmericanApacheArabArapahoArgentineanArmenianAssyrian/Chaldean/SyriacAustralianAustrianBahamianBangladeshiBarbadianBasqueBelgianBelizeanBermudanBhutaneseBlackfeetBolivianBrazilianBritishBritish West IndianBulgarianBurmeseCajunCambodianCanadianCape VerdeanCarpatho RusynCelticCentral AmericanCentral American IndianCherokeeCheyenneChickasawChileanChineseChippewaChoctawColombianColvilleComancheCosta RicanCreeCreekCroatianCrowCubanCypriotCzechDanishDelawareDominicanDutchDutch West IndianEastern EuropeanEcuadorianEgyptianEnglishEstonianEthiopianEuropeanFijianFilipinoFinnishFrenchFrench American IndianFrench CanadianGermanGerman RussianGhanaianGreekGuamanian/ChamorroGuatemalanGuyaneseHaitianHmongHonduranHopiHoumaHungarianIcelanderIndian (Asian)IndonesianInupiatIranianIraqiIrishIroquoisIsraeliItalianJamaicanJapaneseJordanianKenyanKiowaKoreanLaotianLatvianLebaneseLiberianLithuanianLumbeeLuxembourgerMacedonianMalaysianMalteseMarshalleseMenomineeMexicanMexican American IndianMongolianMoroccanNative HawaiianNavajoNepaleseNew ZealanderNicaraguanNigerianNorthern EuropeanNorwegianOkinawanOsageOttawaPaiutePakistaniPalestinianPanamanianParaguayanPennsylvania GermanPeruvianPimaPolishPortuguesePotawatomiPuebloPuerto RicanPuget Sound SalishRomanianRussianSalvadoranSamoanScandinavianScotch-IrishScottishSeminoleSenegaleseSerbianShoshoneSierra LeoneanSiouxSlavicSlovakSloveneSomaliSouth AfricanSouth AmericanSouth American IndianSoviet UnionSpaniardSpanishSpanish AmericanSpanish American IndianSri LankanSubsaharan AfricanSudaneseSwedishSwissSyrianTaiwaneseThaiTlingit-HaidaTohono O'OdhamTonganTrinidadian and TobagonianTsimshianTurkishU.S. Virgin IslanderUgandanUkrainianUruguayanUteVenezuelanVietnameseWelshWest IndianYakamaYaquiYugoslavianYumanYup'ikZimbabwean
Immigration
NonimmigrantsImmigrantsAfghanistanAfricaAlbaniaArgentinaArmeniaAsiaAustraliaAustriaBahamasBangladeshBarbadosBelarusBelgiumBelizeBoliviaBosnia and HerzegovinaBrazilBulgariaBurma/MyanmarCabo VerdeCambodiaCameroonCanadaCaribbeanCentral AmericaChileChinaColombiaCongoCosta RicaCroatiaCubaCzechoslovakiaDenmarkDominicaDominican RepublicEastern AfricaEastern AsiaEastern EuropeEcuadorEgyptEl SalvadorEnglandEritreaEthiopiaEuropeFijiFranceGermanyGhanaGreeceGrenadaGuatemalaGuyanaHaitiHondurasHong KongHungaryIndiaIndonesiaIranIraqIrelandIsraelItalyJamaicaJapanJordanKazakhstanKenyaKoreaKuwaitLaosLatin AmericaLatviaLebanonLiberiaLithuaniaMalaysiaMexicoMicronesiaMiddle AfricaMoldovaMoroccoNepalNetherlandsNicaraguaNigeriaNorth AmericaNorth MacedoniaNorthern AfricaNorthern EuropeNorwayOceaniaPakistanPanamaPeruPhilippinesPolandPortugalRomaniaRussiaSaudi ArabiaScotlandSenegalSerbiaSierra LeoneSingaporeSomaliaSouth AfricaSouth AmericaSouth Central AsiaSouth Eastern AsiaSouthern EuropeSpainSri LankaSt. Vincent and the GrenadinesSudanSwedenSwitzerlandSyriaTaiwanThailandTrinidad and TobagoTurkeyUgandaUkraineUruguayUzbekistanVenezuelaVietnamWest IndiesWestern AfricaWestern AsiaWestern EuropeYemenZaireZimbabweAzores
Czechoslovakian
Race
Ancestry
AfghanAfricanAlaska NativeAlaskan AthabascanAlbanianAleutAlsatianAmericanApacheArabArapahoArgentineanArmenianAssyrian/Chaldean/SyriacAustralianAustrianBahamianBangladeshiBarbadianBasqueBelgianBelizeanBermudanBhutaneseBlackfeetBolivianBrazilianBritishBritish West IndianBulgarianBurmeseCajunCambodianCanadianCape VerdeanCarpatho RusynCelticCentral AmericanCentral American IndianCherokeeCheyenneChickasawChileanChineseChippewaChoctawColombianColvilleComancheCosta RicanCreeCreekCroatianCrowCubanCypriotCzechCzechoslovakianDanishDelawareDominicanDutchDutch West IndianEastern EuropeanEcuadorianEgyptianEnglishEstonianEthiopianEuropeanFijianFilipinoFinnishFrenchFrench American IndianFrench CanadianGermanGerman RussianGhanaianGreekGuamanian/ChamorroGuatemalanGuyaneseHaitianHmongHonduranHopiHoumaHungarianIcelanderIndian (Asian)IndonesianInupiatIranianIraqiIrishIroquoisIsraeliItalianJamaicanJapaneseJordanianKenyanKiowaKoreanLaotianLatvianLebaneseLiberianLithuanianLumbeeLuxembourgerMacedonianMalaysianMalteseMarshalleseMenomineeMexicanMexican American IndianMongolianMoroccanNative HawaiianNavajoNepaleseNew ZealanderNicaraguanNigerianNorthern EuropeanNorwegianOkinawanOsageOttawaPaiutePakistaniPalestinianPanamanianParaguayanPennsylvania GermanPeruvianPimaPolishPortuguesePotawatomiPuebloPuerto RicanPuget Sound SalishRomanianRussianSalvadoranSamoanScandinavianScotch-IrishScottishSeminoleSenegaleseSerbianShoshoneSierra LeoneanSiouxSlavicSlovakSloveneSomaliSouth AfricanSouth AmericanSouth American IndianSoviet UnionSpaniardSpanishSpanish AmericanSpanish American IndianSri LankanSubsaharan AfricanSudaneseSwedishSwissSyrianTaiwaneseThaiTlingit-HaidaTohono O'OdhamTonganTrinidadian and TobagonianTsimshianTurkishU.S. Virgin IslanderUgandanUkrainianUruguayanUteVenezuelanVietnameseWelshWest IndianYakamaYaquiYugoslavianYumanYup'ikZimbabwean
Immigration
NonimmigrantsImmigrantsAfghanistanAfricaAlbaniaArgentinaArmeniaAsiaAustraliaAustriaBahamasBangladeshBarbadosBelarusBelgiumBelizeBoliviaBosnia and HerzegovinaBrazilBulgariaBurma/MyanmarCabo VerdeCambodiaCameroonCanadaCaribbeanCentral AmericaChileChinaColombiaCongoCosta RicaCroatiaCubaCzechoslovakiaDenmarkDominicaDominican RepublicEastern AfricaEastern AsiaEastern EuropeEcuadorEgyptEl SalvadorEnglandEritreaEthiopiaEuropeFijiFranceGermanyGhanaGreeceGrenadaGuatemalaGuyanaHaitiHondurasHong KongHungaryIndiaIndonesiaIranIraqIrelandIsraelItalyJamaicaJapanJordanKazakhstanKenyaKoreaKuwaitLaosLatin AmericaLatviaLebanonLiberiaLithuaniaMalaysiaMexicoMicronesiaMiddle AfricaMoldovaMoroccoNepalNetherlandsNicaraguaNigeriaNorth AmericaNorth MacedoniaNorthern AfricaNorthern EuropeNorwayOceaniaPakistanPanamaPeruPhilippinesPolandPortugalRomaniaRussiaSaudi ArabiaScotlandSenegalSerbiaSierra LeoneSingaporeSomaliaSouth AfricaSouth AmericaSouth Central AsiaSouth Eastern AsiaSouthern EuropeSpainSri LankaSt. Vincent and the GrenadinesSudanSwedenSwitzerlandSyriaTaiwanThailandTrinidad and TobagoTurkeyUkraineUruguayUzbekistanVenezuelaVietnamWest IndiesWestern AfricaWestern AsiaWestern EuropeYemenZaireZimbabweAzores
Married-couple Households
Income
Poverty
Unemployment
Labor Participation
Family Structure
Vehicle Availability
Education Level
Disability

Married-couple Households Comparison

Immigrants from Uganda

Czechoslovakians

Tragic
Exceptional
44.6%
MARRIED-COUPLE HOUSEHOLDS
1.5/ 100
METRIC RATING
233rd/ 347
METRIC RANK
48.5%
MARRIED-COUPLE HOUSEHOLDS
99.2/ 100
METRIC RATING
59th/ 347
METRIC RANK

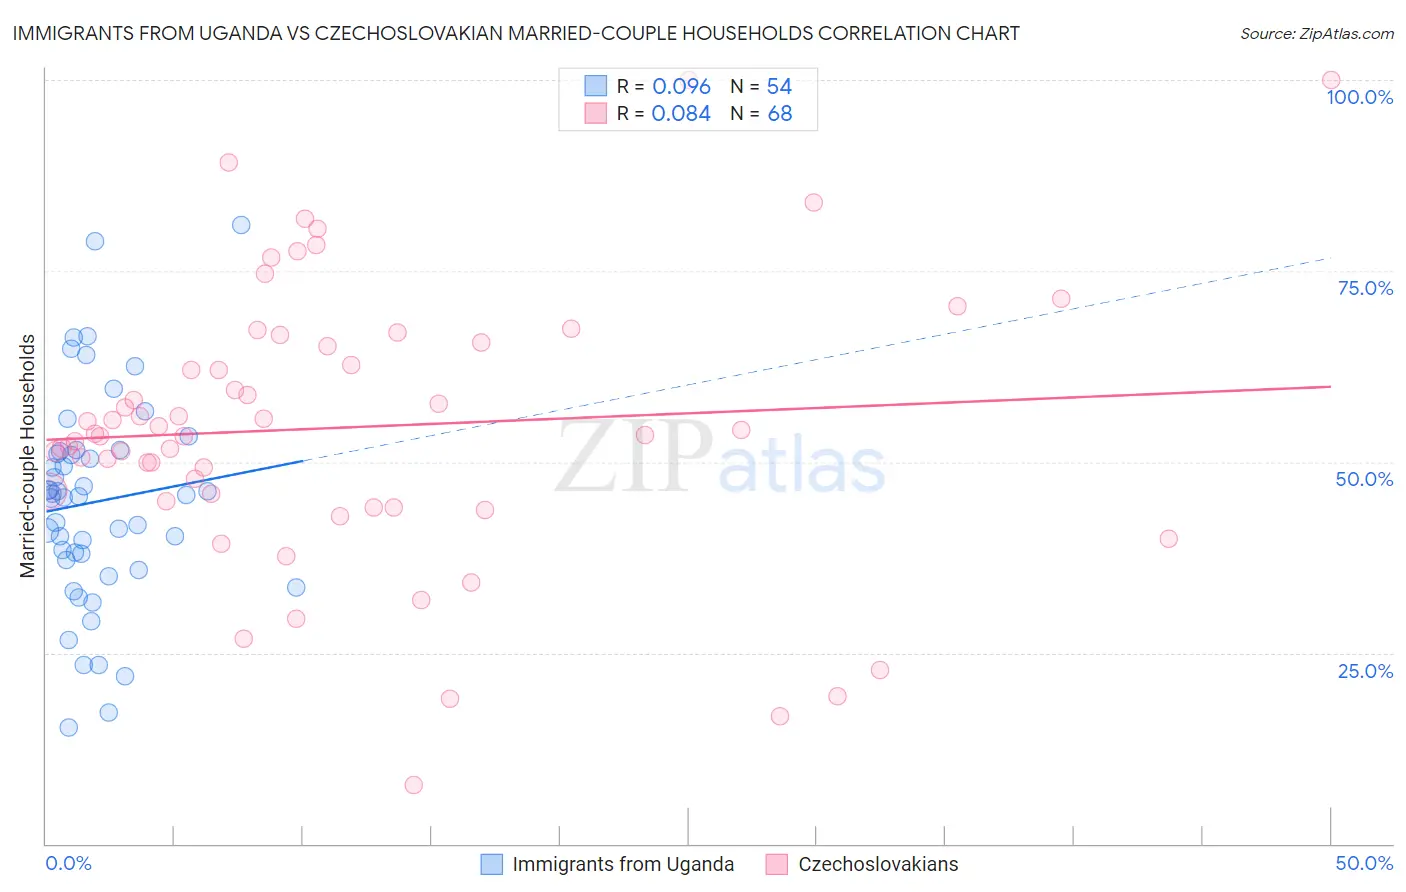
Immigrants from Uganda vs Czechoslovakian Married-couple Households Correlation Chart

The statistical analysis conducted on geographies consisting of 125,974,849 people shows a slight positive correlation between the proportion of Immigrants from Uganda and percentage of married-couple family households in the United States with a correlation coefficient (R) of 0.096 and weighted average of 44.6%. Similarly, the statistical analysis conducted on geographies consisting of 368,521,204 people shows a slight positive correlation between the proportion of Czechoslovakians and percentage of married-couple family households in the United States with a correlation coefficient (R) of 0.084 and weighted average of 48.5%, a difference of 8.8%.
Immigrants from Uganda vs Czechoslovakian Married-couple Households

Married-couple Households Correlation Summary

MeasurementImmigrants from UgandaCzechoslovakian
Minimum15.2%7.6%
Maximum81.0%100.0%
Range65.8%92.4%
Mean44.8%54.5%
Median45.6%53.6%
Interquartile 25% (IQ1)37.2%45.3%
Interquartile 75% (IQ3)51.4%65.4%
Interquartile Range (IQR)14.2%20.1%
Standard Deviation (Sample)13.8%18.3%
Standard Deviation (Population)13.7%18.1%

Similar Demographics by Married-couple Households

Demographics Similar to Immigrants from Uganda by Married-couple Households

In terms of married-couple households, the demographic groups most similar to Immigrants from Uganda are Houma (44.6%, a difference of 0.040%), Marshallese (44.6%, a difference of 0.040%), Soviet Union (44.6%, a difference of 0.050%), Immigrants from Latin America (44.7%, a difference of 0.090%), and Immigrants from Panama (44.6%, a difference of 0.12%).
DemographicsRating | RankMarried-couple Households
Alsatians
2.3
/100
|
#226
Tragic
44.8%
Salvadorans
1.9
/100
|
#227
Tragic
44.7%
Kenyans
1.7
/100
|
#228
Tragic
44.7%
Immigrants | Latin America
1.6
/100
|
#229
Tragic
44.7%
Soviet Union
1.6
/100
|
#230
Tragic
44.6%
Houma
1.5
/100
|
#231
Tragic
44.6%
Marshallese
1.5
/100
|
#232
Tragic
44.6%
Immigrants | Uganda
1.5
/100
|
#233
Tragic
44.6%
Immigrants | Panama
1.3
/100
|
#234
Tragic
44.6%
Immigrants | Nicaragua
1.2
/100
|
#235
Tragic
44.5%
Yaqui
1.2
/100
|
#236
Tragic
44.5%
Comanche
1.2
/100
|
#237
Tragic
44.5%
Immigrants | Uruguay
1.1
/100
|
#238
Tragic
44.5%
Spanish Americans
1.1
/100
|
#239
Tragic
44.5%
Ute
1.0
/100
|
#240
Tragic
44.4%

Demographics Similar to Czechoslovakians by Married-couple Households

In terms of married-couple households, the demographic groups most similar to Czechoslovakians are Immigrants from Indonesia (48.5%, a difference of 0.0%), Polish (48.5%, a difference of 0.010%), Croatian (48.5%, a difference of 0.080%), Austrian (48.6%, a difference of 0.090%), and Immigrants from Northern Europe (48.6%, a difference of 0.090%).
DemographicsRating | RankMarried-couple Households
Irish
99.3
/100
|
#52
Exceptional
48.6%
Whites/Caucasians
99.3
/100
|
#53
Exceptional
48.6%
Immigrants | Lithuania
99.3
/100
|
#54
Exceptional
48.6%
Austrians
99.3
/100
|
#55
Exceptional
48.6%
Immigrants | Northern Europe
99.3
/100
|
#56
Exceptional
48.6%
Poles
99.2
/100
|
#57
Exceptional
48.5%
Immigrants | Indonesia
99.2
/100
|
#58
Exceptional
48.5%
Czechoslovakians
99.2
/100
|
#59
Exceptional
48.5%
Croatians
99.1
/100
|
#60
Exceptional
48.5%
Bulgarians
99.1
/100
|
#61
Exceptional
48.5%
Luxembourgers
99.1
/100
|
#62
Exceptional
48.5%
Basques
99.0
/100
|
#63
Exceptional
48.4%
Northern Europeans
99.0
/100
|
#64
Exceptional
48.4%
Immigrants | Canada
99.0
/100
|
#65
Exceptional
48.4%
Jordanians
98.9
/100
|
#66
Exceptional
48.4%