Immigrants from Czechoslovakia vs Immigrants from Japan Married-couple Households
COMPARE
Immigrants from Czechoslovakia
Immigrants from Japan
Married-couple Households
Married-couple Households Comparison
Immigrants from Czechoslovakia
Immigrants from Japan
47.8%
MARRIED-COUPLE HOUSEHOLDS
95.5/ 100
METRIC RATING
105th/ 347
METRIC RANK
47.7%
MARRIED-COUPLE HOUSEHOLDS
94.4/ 100
METRIC RATING
108th/ 347
METRIC RANK
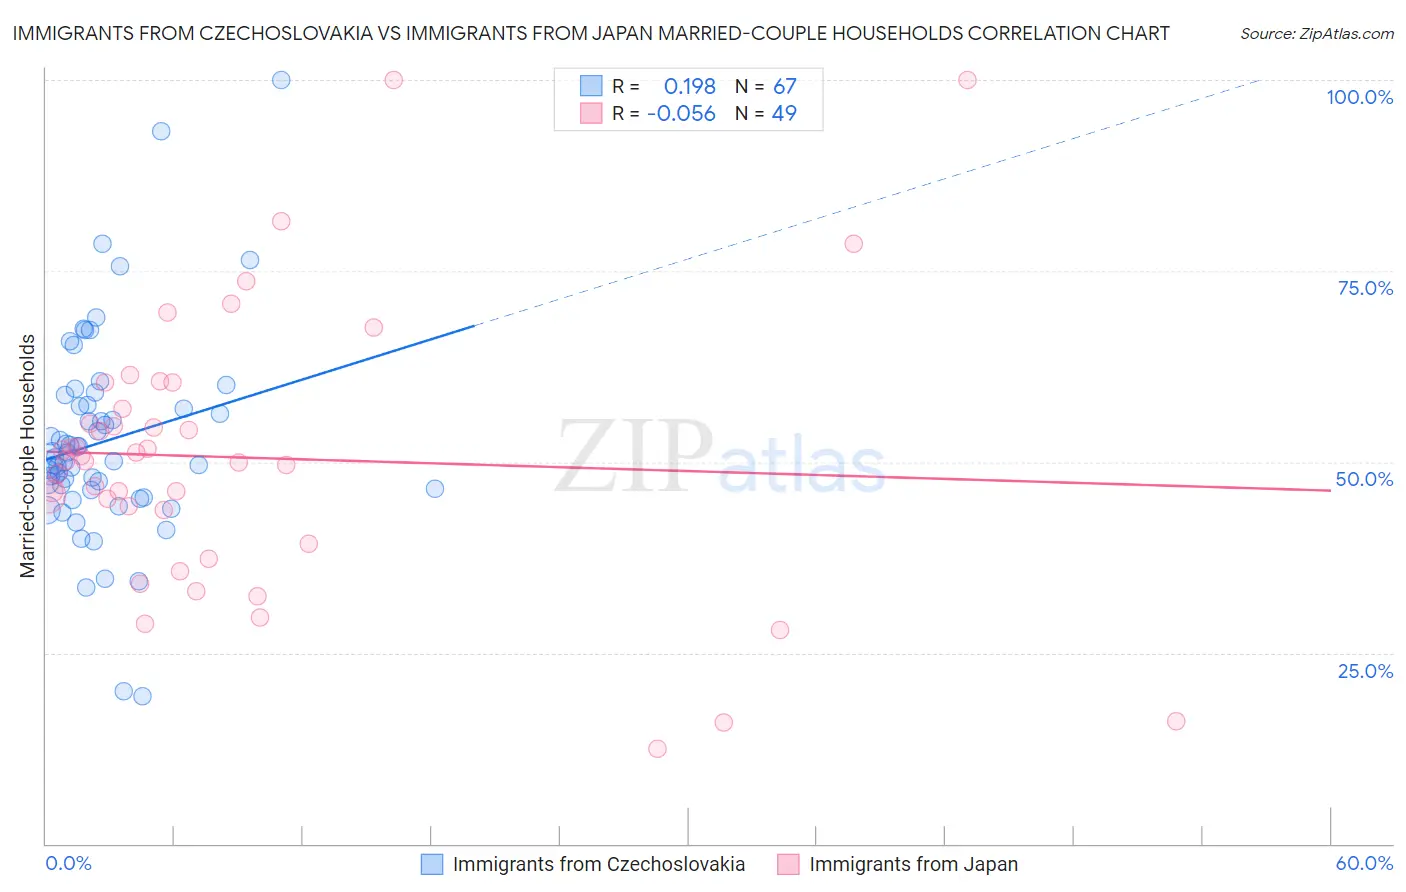
Immigrants from Czechoslovakia vs Immigrants from Japan Married-couple Households Correlation Chart
The statistical analysis conducted on geographies consisting of 195,446,712 people shows a poor positive correlation between the proportion of Immigrants from Czechoslovakia and percentage of married-couple family households in the United States with a correlation coefficient (R) of 0.198 and weighted average of 47.8%. Similarly, the statistical analysis conducted on geographies consisting of 339,976,257 people shows a slight negative correlation between the proportion of Immigrants from Japan and percentage of married-couple family households in the United States with a correlation coefficient (R) of -0.056 and weighted average of 47.7%, a difference of 0.22%.
Married-couple Households Correlation Summary
| Measurement | Immigrants from Czechoslovakia | Immigrants from Japan |
| Minimum | 19.3% | 12.5% |
| Maximum | 100.0% | 100.0% |
| Range | 80.7% | 87.5% |
| Mean | 52.7% | 50.6% |
| Median | 50.6% | 50.2% |
| Interquartile 25% (IQ1) | 46.3% | 41.5% |
| Interquartile 75% (IQ3) | 57.4% | 58.7% |
| Interquartile Range (IQR) | 11.1% | 17.2% |
| Standard Deviation (Sample) | 13.4% | 18.1% |
| Standard Deviation (Population) | 13.3% | 17.9% |
Demographics Similar to Immigrants from Czechoslovakia and Immigrants from Japan by Married-couple Households
In terms of married-couple households, the demographic groups most similar to Immigrants from Czechoslovakia are Portuguese (47.8%, a difference of 0.010%), Immigrants from South Africa (47.8%, a difference of 0.10%), Slavic (47.8%, a difference of 0.11%), Hawaiian (47.8%, a difference of 0.11%), and Turkish (47.8%, a difference of 0.13%). Similarly, the demographic groups most similar to Immigrants from Japan are Estonian (47.7%, a difference of 0.050%), Immigrants from Jordan (47.7%, a difference of 0.050%), Macedonian (47.6%, a difference of 0.070%), Syrian (47.6%, a difference of 0.080%), and Peruvian (47.6%, a difference of 0.090%).
| Demographics | Rating | Rank | Married-couple Households |
| Immigrants | Egypt | 96.6 /100 | #96 | Exceptional 47.9% |
| Latvians | 96.5 /100 | #97 | Exceptional 47.9% |
| Immigrants | North Macedonia | 96.4 /100 | #98 | Exceptional 47.9% |
| Immigrants | Austria | 96.4 /100 | #99 | Exceptional 47.9% |
| Immigrants | Italy | 96.3 /100 | #100 | Exceptional 47.9% |
| Turks | 96.1 /100 | #101 | Exceptional 47.8% |
| Slavs | 96.0 /100 | #102 | Exceptional 47.8% |
| Hawaiians | 96.0 /100 | #103 | Exceptional 47.8% |
| Immigrants | South Africa | 96.0 /100 | #104 | Exceptional 47.8% |
| Immigrants | Czechoslovakia | 95.5 /100 | #105 | Exceptional 47.8% |
| Portuguese | 95.5 /100 | #106 | Exceptional 47.8% |
| Estonians | 94.7 /100 | #107 | Exceptional 47.7% |
| Immigrants | Japan | 94.4 /100 | #108 | Exceptional 47.7% |
| Immigrants | Jordan | 94.1 /100 | #109 | Exceptional 47.7% |
| Macedonians | 93.9 /100 | #110 | Exceptional 47.6% |
| Syrians | 93.9 /100 | #111 | Exceptional 47.6% |
| Peruvians | 93.8 /100 | #112 | Exceptional 47.6% |
| Venezuelans | 93.8 /100 | #113 | Exceptional 47.6% |
| Immigrants | Europe | 93.7 /100 | #114 | Exceptional 47.6% |
| Slovaks | 92.9 /100 | #115 | Exceptional 47.6% |
| Argentineans | 92.5 /100 | #116 | Exceptional 47.5% |