Immigrants from Cambodia vs Lebanese Married-couple Households
COMPARE
Immigrants from Cambodia
Lebanese
Married-couple Households
Married-couple Households Comparison
Immigrants from Cambodia
Lebanese
44.9%
MARRIED-COUPLE HOUSEHOLDS
2.7/ 100
METRIC RATING
223rd/ 347
METRIC RANK
47.9%
MARRIED-COUPLE HOUSEHOLDS
96.9/ 100
METRIC RATING
93rd/ 347
METRIC RANK
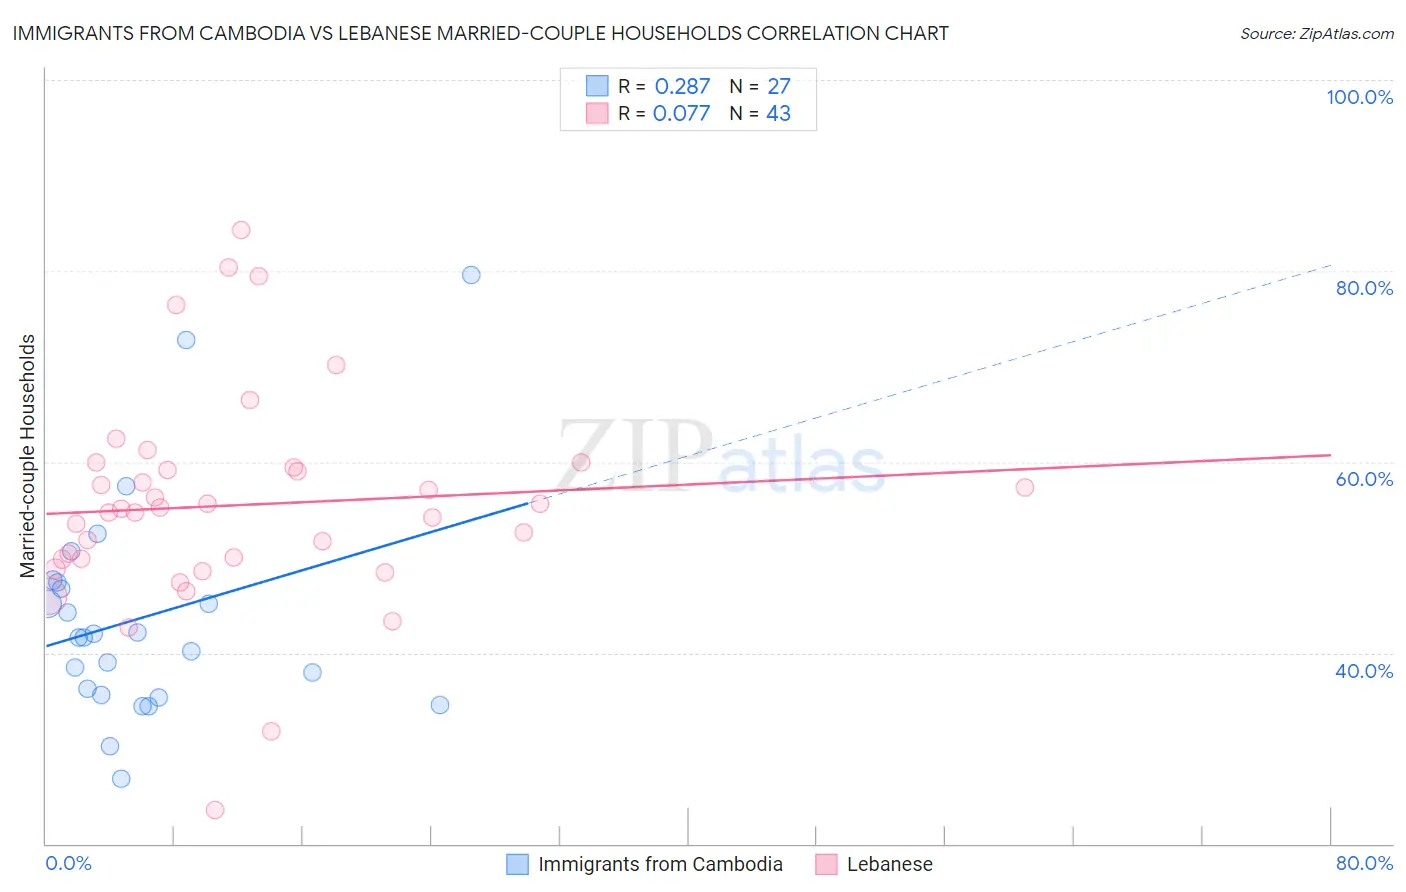
Immigrants from Cambodia vs Lebanese Married-couple Households Correlation Chart
The statistical analysis conducted on geographies consisting of 205,129,465 people shows a weak positive correlation between the proportion of Immigrants from Cambodia and percentage of married-couple family households in the United States with a correlation coefficient (R) of 0.287 and weighted average of 44.9%. Similarly, the statistical analysis conducted on geographies consisting of 401,304,027 people shows a slight positive correlation between the proportion of Lebanese and percentage of married-couple family households in the United States with a correlation coefficient (R) of 0.077 and weighted average of 47.9%, a difference of 6.8%.
Married-couple Households Correlation Summary
| Measurement | Immigrants from Cambodia | Lebanese |
| Minimum | 26.8% | 23.5% |
| Maximum | 79.6% | 84.3% |
| Range | 52.8% | 60.8% |
| Mean | 43.7% | 55.5% |
| Median | 41.6% | 55.0% |
| Interquartile 25% (IQ1) | 35.6% | 49.8% |
| Interquartile 75% (IQ3) | 47.4% | 59.4% |
| Interquartile Range (IQR) | 11.8% | 9.6% |
| Standard Deviation (Sample) | 11.6% | 11.4% |
| Standard Deviation (Population) | 11.4% | 11.2% |
Similar Demographics by Married-couple Households
Demographics Similar to Immigrants from Cambodia by Married-couple Households
In terms of married-couple households, the demographic groups most similar to Immigrants from Cambodia are Immigrants from Micronesia (44.9%, a difference of 0.030%), Dutch West Indian (44.9%, a difference of 0.040%), Alsatian (44.8%, a difference of 0.14%), Salvadoran (44.7%, a difference of 0.33%), and Kenyan (44.7%, a difference of 0.46%).
| Demographics | Rating | Rank | Married-couple Households |
| Immigrants | Portugal | 5.6 /100 | #216 | Tragic 45.2% |
| Panamanians | 5.5 /100 | #217 | Tragic 45.2% |
| Immigrants | Azores | 5.3 /100 | #218 | Tragic 45.2% |
| Nicaraguans | 5.3 /100 | #219 | Tragic 45.2% |
| Immigrants | Thailand | 5.1 /100 | #220 | Tragic 45.2% |
| Tlingit-Haida | 4.9 /100 | #221 | Tragic 45.1% |
| Immigrants | Laos | 4.6 /100 | #222 | Tragic 45.1% |
| Immigrants | Cambodia | 2.7 /100 | #223 | Tragic 44.9% |
| Immigrants | Micronesia | 2.6 /100 | #224 | Tragic 44.9% |
| Dutch West Indians | 2.6 /100 | #225 | Tragic 44.9% |
| Alsatians | 2.3 /100 | #226 | Tragic 44.8% |
| Salvadorans | 1.9 /100 | #227 | Tragic 44.7% |
| Kenyans | 1.7 /100 | #228 | Tragic 44.7% |
| Immigrants | Latin America | 1.6 /100 | #229 | Tragic 44.7% |
| Soviet Union | 1.6 /100 | #230 | Tragic 44.6% |
Demographics Similar to Lebanese by Married-couple Households
In terms of married-couple households, the demographic groups most similar to Lebanese are American (47.9%, a difference of 0.0%), Palestinian (48.0%, a difference of 0.020%), Immigrants from Moldova (48.0%, a difference of 0.040%), Immigrants from Belgium (47.9%, a difference of 0.040%), and Immigrants from Egypt (47.9%, a difference of 0.080%).
| Demographics | Rating | Rank | Married-couple Households |
| Belgians | 97.4 /100 | #86 | Exceptional 48.0% |
| Immigrants | Ireland | 97.3 /100 | #87 | Exceptional 48.0% |
| Afghans | 97.3 /100 | #88 | Exceptional 48.0% |
| Cypriots | 97.2 /100 | #89 | Exceptional 48.0% |
| French | 97.2 /100 | #90 | Exceptional 48.0% |
| Immigrants | Moldova | 97.0 /100 | #91 | Exceptional 48.0% |
| Palestinians | 96.9 /100 | #92 | Exceptional 48.0% |
| Lebanese | 96.9 /100 | #93 | Exceptional 47.9% |
| Americans | 96.9 /100 | #94 | Exceptional 47.9% |
| Immigrants | Belgium | 96.8 /100 | #95 | Exceptional 47.9% |
| Immigrants | Egypt | 96.6 /100 | #96 | Exceptional 47.9% |
| Latvians | 96.5 /100 | #97 | Exceptional 47.9% |
| Immigrants | North Macedonia | 96.4 /100 | #98 | Exceptional 47.9% |
| Immigrants | Austria | 96.4 /100 | #99 | Exceptional 47.9% |
| Immigrants | Italy | 96.3 /100 | #100 | Exceptional 47.9% |