Immigrants from Bulgaria vs Colville Married-couple Households
COMPARE
Immigrants from Bulgaria
Colville
Married-couple Households
Married-couple Households Comparison
Immigrants from Bulgaria
Colville
47.0%
MARRIED-COUPLE HOUSEHOLDS
76.8/ 100
METRIC RATING
151st/ 347
METRIC RANK
41.0%
MARRIED-COUPLE HOUSEHOLDS
0.0/ 100
METRIC RATING
311th/ 347
METRIC RANK
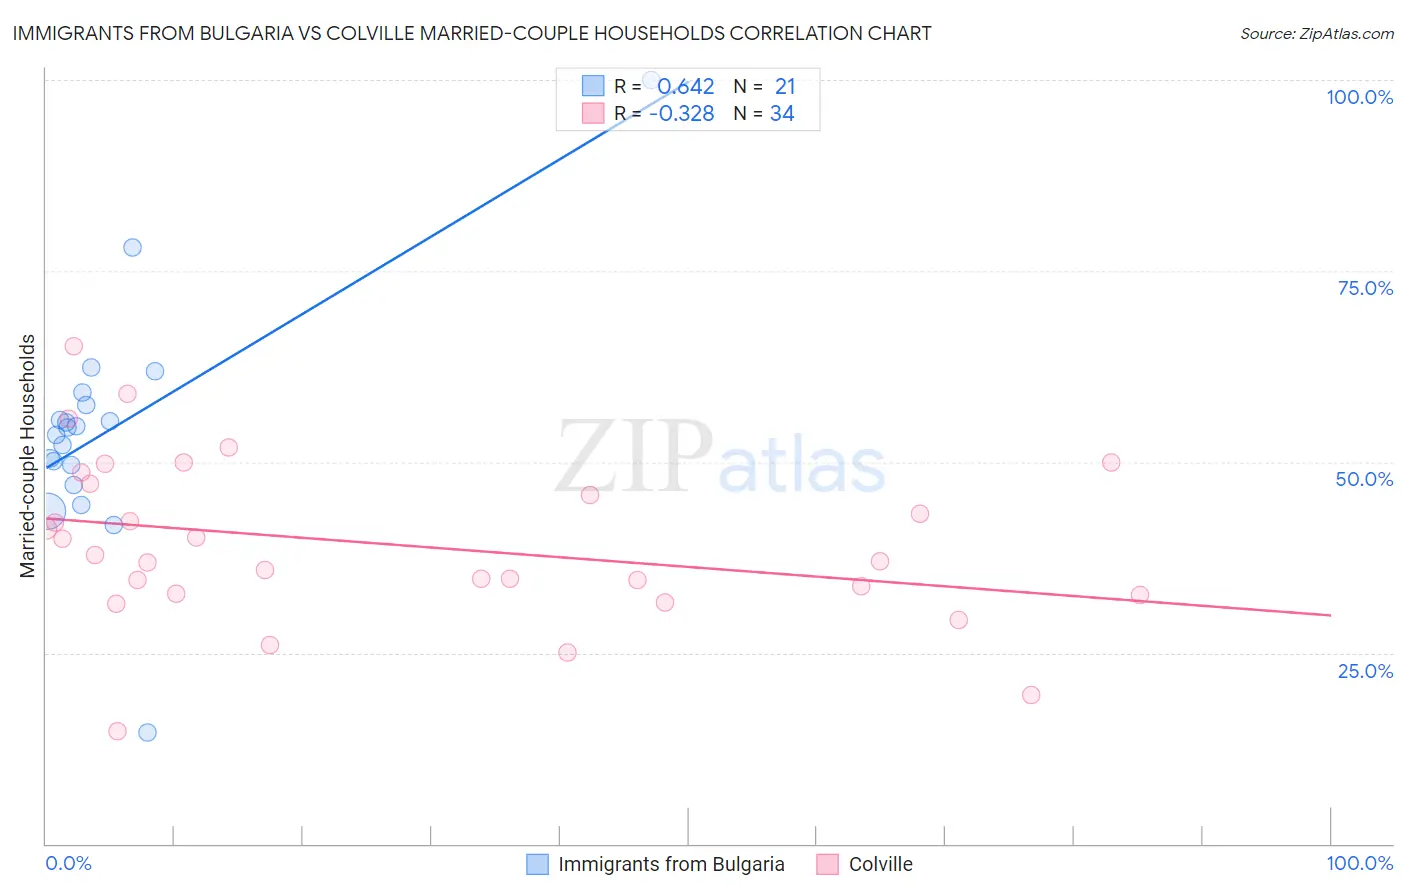
Immigrants from Bulgaria vs Colville Married-couple Households Correlation Chart
The statistical analysis conducted on geographies consisting of 172,541,029 people shows a significant positive correlation between the proportion of Immigrants from Bulgaria and percentage of married-couple family households in the United States with a correlation coefficient (R) of 0.642 and weighted average of 47.0%. Similarly, the statistical analysis conducted on geographies consisting of 34,682,856 people shows a mild negative correlation between the proportion of Colville and percentage of married-couple family households in the United States with a correlation coefficient (R) of -0.328 and weighted average of 41.0%, a difference of 14.6%.
Married-couple Households Correlation Summary
| Measurement | Immigrants from Bulgaria | Colville |
| Minimum | 14.5% | 14.7% |
| Maximum | 100.0% | 65.2% |
| Range | 85.5% | 50.6% |
| Mean | 54.3% | 39.2% |
| Median | 54.5% | 37.4% |
| Interquartile 25% (IQ1) | 48.2% | 32.8% |
| Interquartile 75% (IQ3) | 58.2% | 47.2% |
| Interquartile Range (IQR) | 10.0% | 14.4% |
| Standard Deviation (Sample) | 15.6% | 10.8% |
| Standard Deviation (Population) | 15.2% | 10.7% |
Similar Demographics by Married-couple Households
Demographics Similar to Immigrants from Bulgaria by Married-couple Households
In terms of married-couple households, the demographic groups most similar to Immigrants from Bulgaria are Serbian (47.0%, a difference of 0.020%), Hmong (47.0%, a difference of 0.030%), Immigrants from Western Asia (46.9%, a difference of 0.040%), Arab (46.9%, a difference of 0.040%), and Immigrants from Russia (47.0%, a difference of 0.050%).
| Demographics | Rating | Rank | Married-couple Households |
| Mexicans | 83.4 /100 | #144 | Excellent 47.1% |
| Slovenes | 81.7 /100 | #145 | Excellent 47.1% |
| Immigrants | Western Europe | 81.6 /100 | #146 | Excellent 47.1% |
| Immigrants | Syria | 81.6 /100 | #147 | Excellent 47.1% |
| Icelanders | 79.5 /100 | #148 | Good 47.0% |
| Paraguayans | 78.7 /100 | #149 | Good 47.0% |
| Immigrants | Russia | 77.6 /100 | #150 | Good 47.0% |
| Immigrants | Bulgaria | 76.8 /100 | #151 | Good 47.0% |
| Serbians | 76.3 /100 | #152 | Good 47.0% |
| Hmong | 76.2 /100 | #153 | Good 47.0% |
| Immigrants | Western Asia | 76.1 /100 | #154 | Good 46.9% |
| Arabs | 76.0 /100 | #155 | Good 46.9% |
| Armenians | 75.4 /100 | #156 | Good 46.9% |
| Immigrants | Oceania | 74.8 /100 | #157 | Good 46.9% |
| Immigrants | Nonimmigrants | 73.3 /100 | #158 | Good 46.9% |
Demographics Similar to Colville by Married-couple Households
In terms of married-couple households, the demographic groups most similar to Colville are African (40.9%, a difference of 0.090%), Immigrants from Haiti (40.9%, a difference of 0.15%), Jamaican (40.9%, a difference of 0.22%), Trinidadian and Tobagonian (40.9%, a difference of 0.30%), and Immigrants from Caribbean (40.8%, a difference of 0.49%).
| Demographics | Rating | Rank | Married-couple Households |
| Immigrants | Guyana | 0.0 /100 | #304 | Tragic 41.6% |
| Sioux | 0.0 /100 | #305 | Tragic 41.5% |
| Guyanese | 0.0 /100 | #306 | Tragic 41.4% |
| Immigrants | Western Africa | 0.0 /100 | #307 | Tragic 41.4% |
| Crow | 0.0 /100 | #308 | Tragic 41.4% |
| Immigrants | Trinidad and Tobago | 0.0 /100 | #309 | Tragic 41.2% |
| Haitians | 0.0 /100 | #310 | Tragic 41.2% |
| Colville | 0.0 /100 | #311 | Tragic 41.0% |
| Africans | 0.0 /100 | #312 | Tragic 40.9% |
| Immigrants | Haiti | 0.0 /100 | #313 | Tragic 40.9% |
| Jamaicans | 0.0 /100 | #314 | Tragic 40.9% |
| Trinidadians and Tobagonians | 0.0 /100 | #315 | Tragic 40.9% |
| Immigrants | Caribbean | 0.0 /100 | #316 | Tragic 40.8% |
| Immigrants | Jamaica | 0.0 /100 | #317 | Tragic 40.7% |
| Liberians | 0.0 /100 | #318 | Tragic 40.7% |