Immigrants from Japan vs Immigrants from Barbados GED/Equivalency
COMPARE
Immigrants from Japan
Immigrants from Barbados
GED/Equivalency
GED/Equivalency Comparison
Immigrants from Japan
Immigrants from Barbados
88.4%
GED/EQUIVALENCY
99.7/ 100
METRIC RATING
34th/ 347
METRIC RANK
82.4%
GED/EQUIVALENCY
0.1/ 100
METRIC RATING
284th/ 347
METRIC RANK
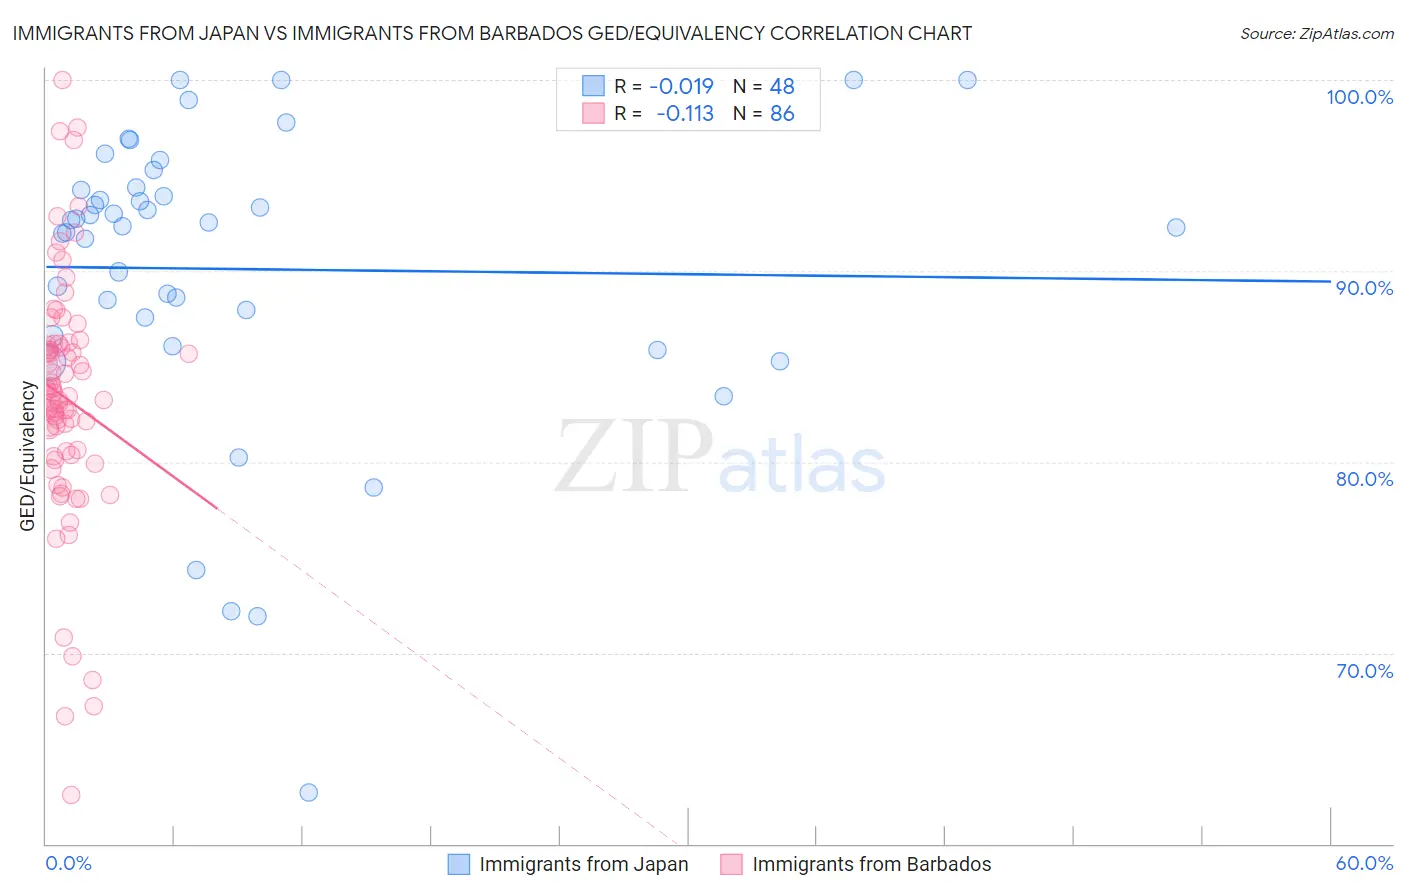
Immigrants from Japan vs Immigrants from Barbados GED/Equivalency Correlation Chart
The statistical analysis conducted on geographies consisting of 340,148,851 people shows no correlation between the proportion of Immigrants from Japan and percentage of population with at least ged/equivalency education in the United States with a correlation coefficient (R) of -0.019 and weighted average of 88.4%. Similarly, the statistical analysis conducted on geographies consisting of 112,783,324 people shows a poor negative correlation between the proportion of Immigrants from Barbados and percentage of population with at least ged/equivalency education in the United States with a correlation coefficient (R) of -0.113 and weighted average of 82.4%, a difference of 7.2%.
GED/Equivalency Correlation Summary
| Measurement | Immigrants from Japan | Immigrants from Barbados |
| Minimum | 62.7% | 62.6% |
| Maximum | 100.0% | 100.0% |
| Range | 37.3% | 37.4% |
| Mean | 90.1% | 83.4% |
| Median | 92.4% | 83.5% |
| Interquartile 25% (IQ1) | 87.1% | 80.6% |
| Interquartile 75% (IQ3) | 94.3% | 86.1% |
| Interquartile Range (IQR) | 7.2% | 5.5% |
| Standard Deviation (Sample) | 7.9% | 6.4% |
| Standard Deviation (Population) | 7.8% | 6.4% |
Similar Demographics by GED/Equivalency
Demographics Similar to Immigrants from Japan by GED/Equivalency
In terms of ged/equivalency, the demographic groups most similar to Immigrants from Japan are Immigrants from Sweden (88.4%, a difference of 0.010%), Immigrants from South Central Asia (88.4%, a difference of 0.020%), Immigrants from Belgium (88.3%, a difference of 0.040%), Danish (88.4%, a difference of 0.050%), and Bhutanese (88.4%, a difference of 0.070%).
| Demographics | Rating | Rank | GED/Equivalency |
| Immigrants | Lithuania | 99.8 /100 | #27 | Exceptional 88.6% |
| Immigrants | Northern Europe | 99.8 /100 | #28 | Exceptional 88.5% |
| Poles | 99.8 /100 | #29 | Exceptional 88.5% |
| Turks | 99.8 /100 | #30 | Exceptional 88.5% |
| Bhutanese | 99.8 /100 | #31 | Exceptional 88.4% |
| Danes | 99.8 /100 | #32 | Exceptional 88.4% |
| Immigrants | Sweden | 99.7 /100 | #33 | Exceptional 88.4% |
| Immigrants | Japan | 99.7 /100 | #34 | Exceptional 88.4% |
| Immigrants | South Central Asia | 99.7 /100 | #35 | Exceptional 88.4% |
| Immigrants | Belgium | 99.7 /100 | #36 | Exceptional 88.3% |
| Immigrants | Austria | 99.7 /100 | #37 | Exceptional 88.3% |
| Burmese | 99.7 /100 | #38 | Exceptional 88.3% |
| Immigrants | Israel | 99.6 /100 | #39 | Exceptional 88.2% |
| Italians | 99.6 /100 | #40 | Exceptional 88.2% |
| Finns | 99.6 /100 | #41 | Exceptional 88.2% |
Demographics Similar to Immigrants from Barbados by GED/Equivalency
In terms of ged/equivalency, the demographic groups most similar to Immigrants from Barbados are Cajun (82.4%, a difference of 0.030%), Immigrants from West Indies (82.4%, a difference of 0.060%), Japanese (82.4%, a difference of 0.070%), Indonesian (82.5%, a difference of 0.12%), and Immigrants (82.6%, a difference of 0.16%).
| Demographics | Rating | Rank | GED/Equivalency |
| Arapaho | 0.1 /100 | #277 | Tragic 82.8% |
| Immigrants | Laos | 0.1 /100 | #278 | Tragic 82.7% |
| Immigrants | Fiji | 0.1 /100 | #279 | Tragic 82.7% |
| Cheyenne | 0.1 /100 | #280 | Tragic 82.7% |
| Sioux | 0.1 /100 | #281 | Tragic 82.6% |
| Immigrants | Immigrants | 0.1 /100 | #282 | Tragic 82.6% |
| Indonesians | 0.1 /100 | #283 | Tragic 82.5% |
| Immigrants | Barbados | 0.1 /100 | #284 | Tragic 82.4% |
| Cajuns | 0.0 /100 | #285 | Tragic 82.4% |
| Immigrants | West Indies | 0.0 /100 | #286 | Tragic 82.4% |
| Japanese | 0.0 /100 | #287 | Tragic 82.4% |
| Pueblo | 0.0 /100 | #288 | Tragic 82.3% |
| Immigrants | Cambodia | 0.0 /100 | #289 | Tragic 82.2% |
| Haitians | 0.0 /100 | #290 | Tragic 82.1% |
| Cubans | 0.0 /100 | #291 | Tragic 82.0% |