Afghan vs Immigrants from Africa GED/Equivalency
COMPARE
Afghan
Immigrants from Africa
GED/Equivalency
GED/Equivalency Comparison
Afghans
Immigrants from Africa
85.9%
GED/EQUIVALENCY
59.7/ 100
METRIC RATING
170th/ 347
METRIC RANK
85.1%
GED/EQUIVALENCY
17.5/ 100
METRIC RATING
198th/ 347
METRIC RANK
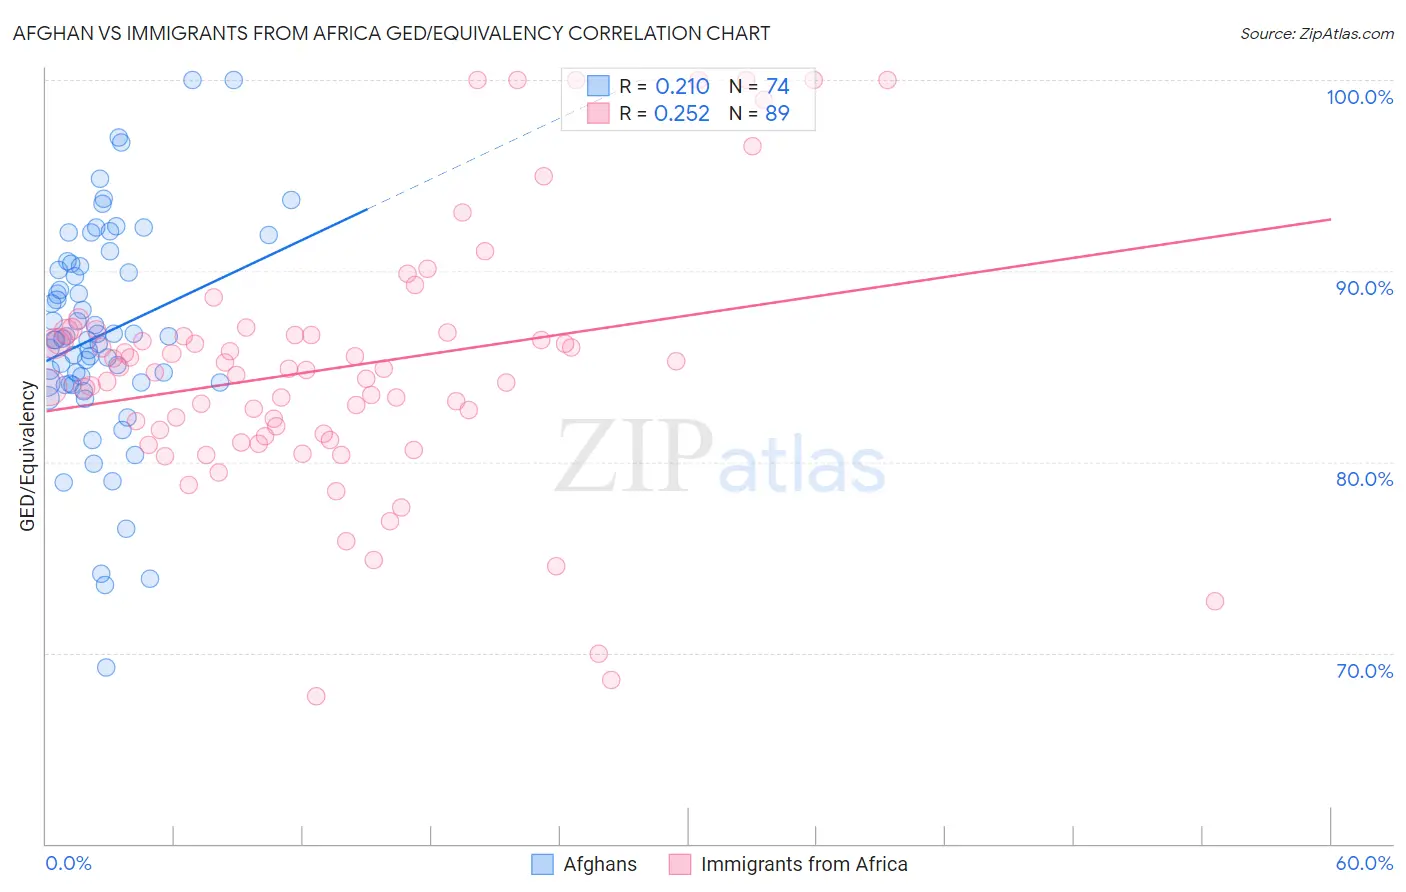
Afghan vs Immigrants from Africa GED/Equivalency Correlation Chart
The statistical analysis conducted on geographies consisting of 148,851,685 people shows a weak positive correlation between the proportion of Afghans and percentage of population with at least ged/equivalency education in the United States with a correlation coefficient (R) of 0.210 and weighted average of 85.9%. Similarly, the statistical analysis conducted on geographies consisting of 469,440,133 people shows a weak positive correlation between the proportion of Immigrants from Africa and percentage of population with at least ged/equivalency education in the United States with a correlation coefficient (R) of 0.252 and weighted average of 85.1%, a difference of 1.0%.
GED/Equivalency Correlation Summary
| Measurement | Afghan | Immigrants from Africa |
| Minimum | 69.2% | 67.7% |
| Maximum | 100.0% | 100.0% |
| Range | 30.8% | 32.3% |
| Mean | 86.7% | 85.0% |
| Median | 86.4% | 84.8% |
| Interquartile 25% (IQ1) | 84.1% | 81.4% |
| Interquartile 75% (IQ3) | 90.3% | 86.7% |
| Interquartile Range (IQR) | 6.1% | 5.3% |
| Standard Deviation (Sample) | 5.7% | 6.7% |
| Standard Deviation (Population) | 5.7% | 6.7% |
Similar Demographics by GED/Equivalency
Demographics Similar to Afghans by GED/Equivalency
In terms of ged/equivalency, the demographic groups most similar to Afghans are Immigrants from Ethiopia (86.0%, a difference of 0.030%), Sierra Leonean (86.0%, a difference of 0.050%), Immigrants from Chile (85.9%, a difference of 0.050%), Ethiopian (86.0%, a difference of 0.090%), and Alsatian (86.0%, a difference of 0.10%).
| Demographics | Rating | Rank | GED/Equivalency |
| Ugandans | 66.3 /100 | #163 | Good 86.1% |
| Venezuelans | 65.5 /100 | #164 | Good 86.0% |
| Alsatians | 64.3 /100 | #165 | Good 86.0% |
| Immigrants | Albania | 64.2 /100 | #166 | Good 86.0% |
| Ethiopians | 63.7 /100 | #167 | Good 86.0% |
| Sierra Leoneans | 61.8 /100 | #168 | Good 86.0% |
| Immigrants | Ethiopia | 61.2 /100 | #169 | Good 86.0% |
| Afghans | 59.7 /100 | #170 | Average 85.9% |
| Immigrants | Chile | 57.3 /100 | #171 | Average 85.9% |
| Bermudans | 55.1 /100 | #172 | Average 85.8% |
| Immigrants | Venezuela | 50.7 /100 | #173 | Average 85.8% |
| Ottawa | 50.0 /100 | #174 | Average 85.8% |
| Immigrants | Bolivia | 49.8 /100 | #175 | Average 85.8% |
| Immigrants | Eastern Africa | 47.7 /100 | #176 | Average 85.7% |
| Immigrants | Uganda | 45.2 /100 | #177 | Average 85.7% |
Demographics Similar to Immigrants from Africa by GED/Equivalency
In terms of ged/equivalency, the demographic groups most similar to Immigrants from Africa are Somali (85.0%, a difference of 0.040%), Uruguayan (85.0%, a difference of 0.060%), Portuguese (85.0%, a difference of 0.060%), Cree (85.0%, a difference of 0.060%), and Panamanian (85.0%, a difference of 0.080%).
| Demographics | Rating | Rank | GED/Equivalency |
| South American Indians | 22.8 /100 | #191 | Fair 85.2% |
| Immigrants | Nonimmigrants | 22.7 /100 | #192 | Fair 85.2% |
| Delaware | 22.2 /100 | #193 | Fair 85.2% |
| Puget Sound Salish | 20.8 /100 | #194 | Fair 85.2% |
| Chippewa | 20.8 /100 | #195 | Fair 85.2% |
| Tongans | 20.7 /100 | #196 | Fair 85.2% |
| Costa Ricans | 20.4 /100 | #197 | Fair 85.2% |
| Immigrants | Africa | 17.5 /100 | #198 | Poor 85.1% |
| Somalis | 16.4 /100 | #199 | Poor 85.0% |
| Uruguayans | 16.0 /100 | #200 | Poor 85.0% |
| Portuguese | 15.9 /100 | #201 | Poor 85.0% |
| Cree | 15.9 /100 | #202 | Poor 85.0% |
| Panamanians | 15.3 /100 | #203 | Poor 85.0% |
| Hawaiians | 15.2 /100 | #204 | Poor 85.0% |
| Liberians | 14.6 /100 | #205 | Poor 85.0% |