Paragon Estates, CO
Paragon Estates Map
Paragon Estates Overview
857
TOTAL POPULATION
448
MALE POPULATION
409
FEMALE POPULATION
109.54
MALES / 100 FEMALES
91.29
FEMALES / 100 MALES
54.4
MEDIAN AGE
2.6
AVG FAMILY SIZE
2.4
AVG HOUSEHOLD SIZE
$102,687
PER CAPITA INCOME
$216,333
AVG FAMILY INCOME
$170,556
AVG HOUSEHOLD INCOME
31.4%
WAGE / INCOME GAP [ % ]
68.6¢/ $1
WAGE / INCOME GAP [ $ ]
0.44
INEQUALITY / GINI INDEX
396
LABOR FORCE [ PEOPLE ]
51.5%
PERCENT IN LABOR FORCE
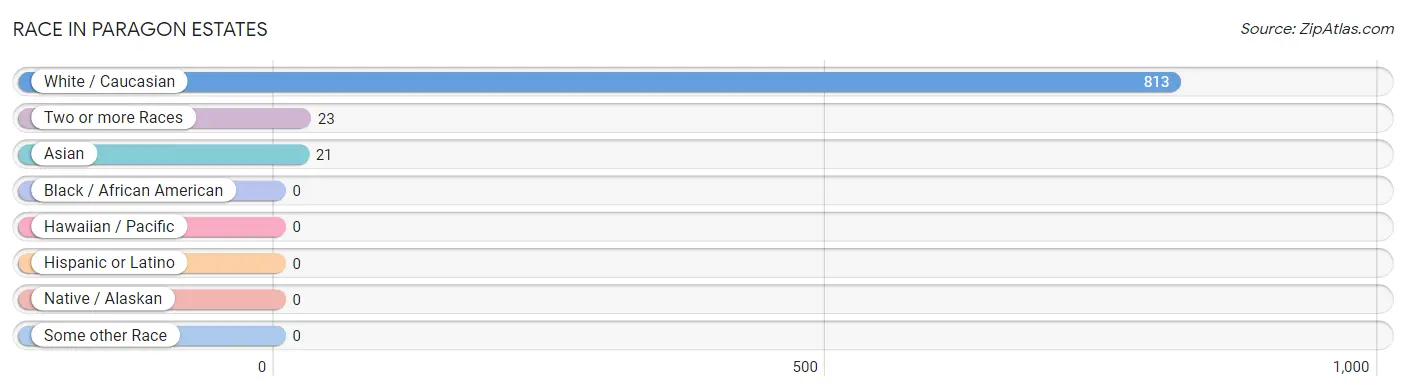
Race in Paragon Estates
The most populous races in Paragon Estates are White / Caucasian (813 | 94.9%), Two or more Races (23 | 2.7%), and Asian (21 | 2.5%).
| Race | # Population | % Population |
| Asian | 21 | 2.5% |
| Black / African American | 0 | 0.0% |
| Hawaiian / Pacific | 0 | 0.0% |
| Hispanic or Latino | 0 | 0.0% |
| Native / Alaskan | 0 | 0.0% |
| White / Caucasian | 813 | 94.9% |
| Two or more Races | 23 | 2.7% |
| Some other Race | 0 | 0.0% |
| Total | 857 | 100.0% |
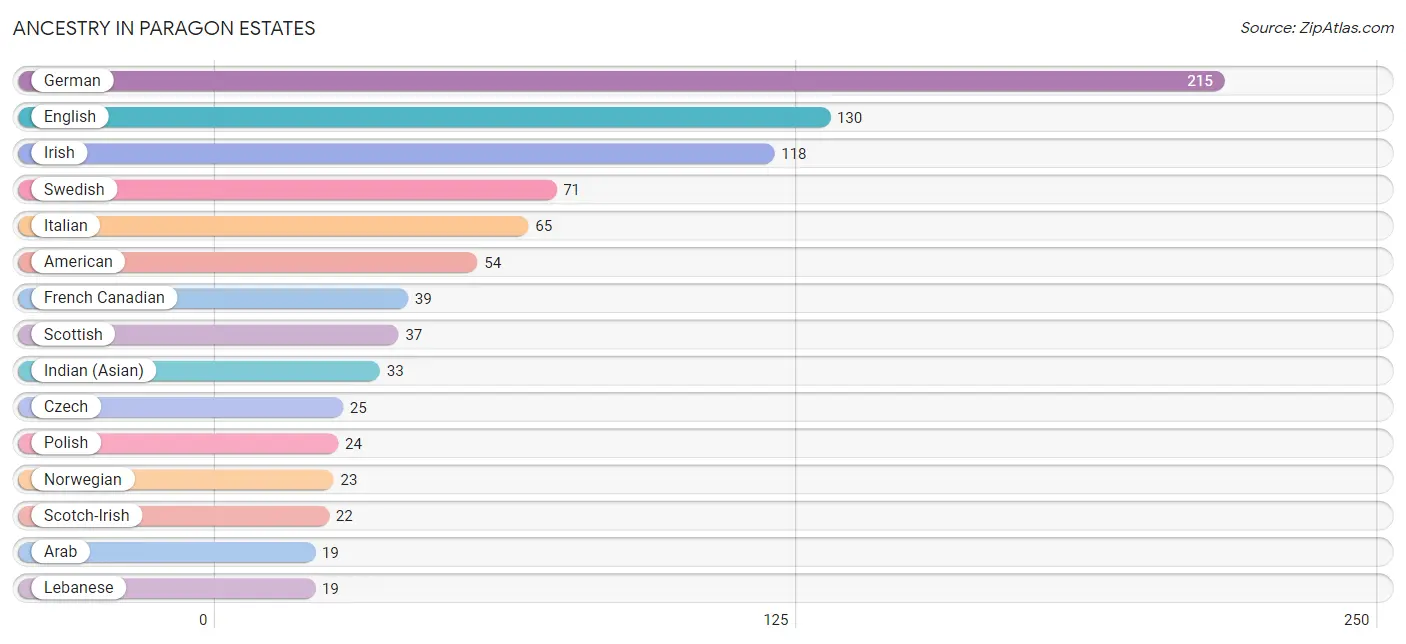
Ancestry in Paragon Estates
The most populous ancestries reported in Paragon Estates are German (215 | 25.1%), English (130 | 15.2%), Irish (118 | 13.8%), Swedish (71 | 8.3%), and Italian (65 | 7.6%), together accounting for 69.9% of all Paragon Estates residents.
| Ancestry | # Population | % Population |
| American | 54 | 6.3% |
| Arab | 19 | 2.2% |
| Bhutanese | 8 | 0.9% |
| Chippewa | 3 | 0.4% |
| Czech | 25 | 2.9% |
| English | 130 | 15.2% |
| French | 9 | 1.1% |
| French Canadian | 39 | 4.5% |
| German | 215 | 25.1% |
| Hungarian | 8 | 0.9% |
| Indian (Asian) | 33 | 3.8% |
| Irish | 118 | 13.8% |
| Italian | 65 | 7.6% |
| Lebanese | 19 | 2.2% |
| Northern European | 10 | 1.2% |
| Norwegian | 23 | 2.7% |
| Polish | 24 | 2.8% |
| Russian | 18 | 2.1% |
| Scandinavian | 14 | 1.6% |
| Scotch-Irish | 22 | 2.6% |
| Scottish | 37 | 4.3% |
| Slovak | 10 | 1.2% |
| Swedish | 71 | 8.3% |
| Swiss | 8 | 0.9% | View All 24 Rows |
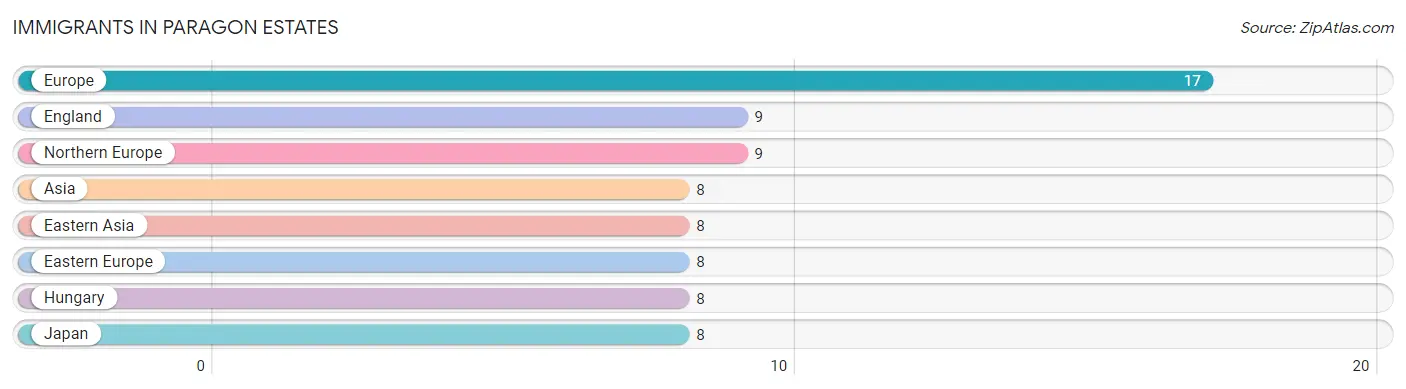
Immigrants in Paragon Estates
The most numerous immigrant groups reported in Paragon Estates came from Europe (17 | 2.0%), England (9 | 1.1%), Northern Europe (9 | 1.1%), Asia (8 | 0.9%), and Eastern Asia (8 | 0.9%), together accounting for 5.9% of all Paragon Estates residents.
| Immigration Origin | # Population | % Population |
| Asia | 8 | 0.9% |
| Eastern Asia | 8 | 0.9% |
| Eastern Europe | 8 | 0.9% |
| England | 9 | 1.1% |
| Europe | 17 | 2.0% |
| Hungary | 8 | 0.9% |
| Japan | 8 | 0.9% |
| Northern Europe | 9 | 1.1% | View All 8 Rows |
Sex and Age in Paragon Estates
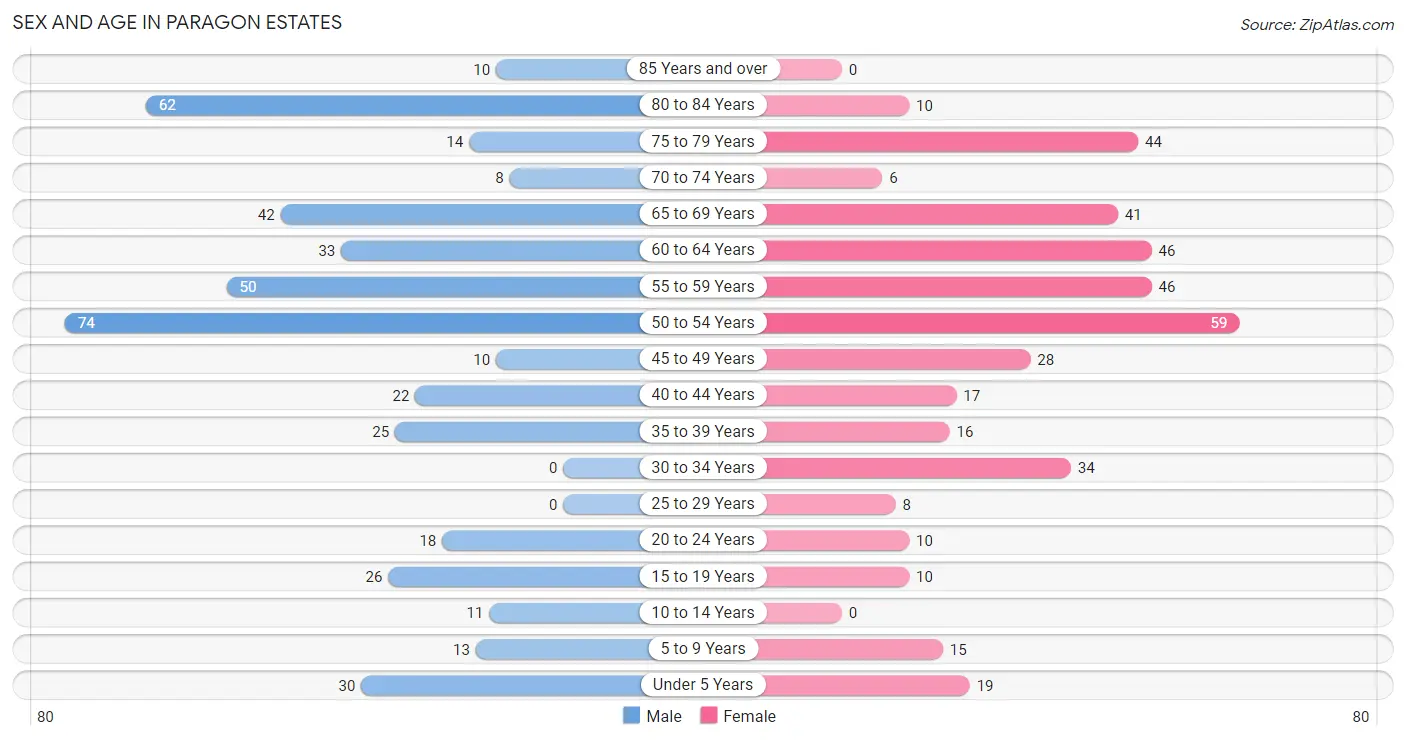
Sex and Age in Paragon Estates
The most populous age groups in Paragon Estates are 50 to 54 Years (74 | 16.5%) for men and 50 to 54 Years (59 | 14.4%) for women.
| Age Bracket | Male | Female |
| Under 5 Years | 30 (6.7%) | 19 (4.6%) |
| 5 to 9 Years | 13 (2.9%) | 15 (3.7%) |
| 10 to 14 Years | 11 (2.5%) | 0 (0.0%) |
| 15 to 19 Years | 26 (5.8%) | 10 (2.4%) |
| 20 to 24 Years | 18 (4.0%) | 10 (2.4%) |
| 25 to 29 Years | 0 (0.0%) | 8 (2.0%) |
| 30 to 34 Years | 0 (0.0%) | 34 (8.3%) |
| 35 to 39 Years | 25 (5.6%) | 16 (3.9%) |
| 40 to 44 Years | 22 (4.9%) | 17 (4.2%) |
| 45 to 49 Years | 10 (2.2%) | 28 (6.9%) |
| 50 to 54 Years | 74 (16.5%) | 59 (14.4%) |
| 55 to 59 Years | 50 (11.2%) | 46 (11.3%) |
| 60 to 64 Years | 33 (7.4%) | 46 (11.3%) |
| 65 to 69 Years | 42 (9.4%) | 41 (10.0%) |
| 70 to 74 Years | 8 (1.8%) | 6 (1.5%) |
| 75 to 79 Years | 14 (3.1%) | 44 (10.8%) |
| 80 to 84 Years | 62 (13.8%) | 10 (2.4%) |
| 85 Years and over | 10 (2.2%) | 0 (0.0%) |
| Total | 448 (100.0%) | 409 (100.0%) |
Families and Households in Paragon Estates
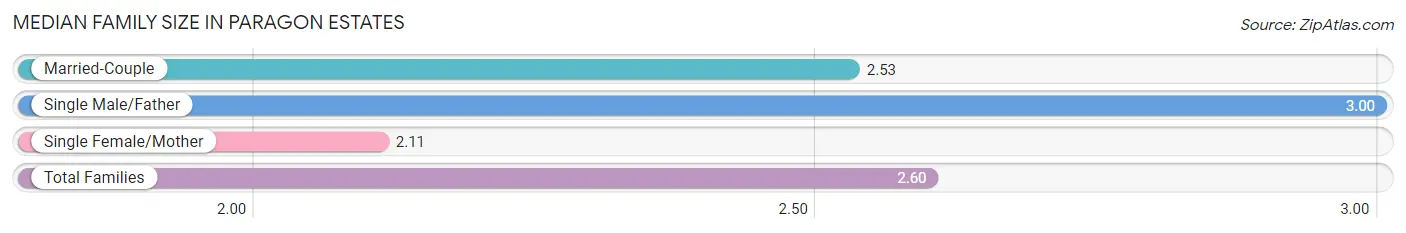
Median Family Size in Paragon Estates
The median family size in Paragon Estates is 2.60 persons per family, with single male/father families (52 | 18.3%) accounting for the largest median family size of 3 persons per family. On the other hand, single female/mother families (9 | 3.2%) represent the smallest median family size with 2.11 persons per family.
| Family Type | # Families | Family Size |
| Married-Couple | 223 (78.5%) | 2.53 |
| Single Male/Father | 52 (18.3%) | 3.00 |
| Single Female/Mother | 9 (3.2%) | 2.11 |
| Total Families | 284 (100.0%) | 2.60 |
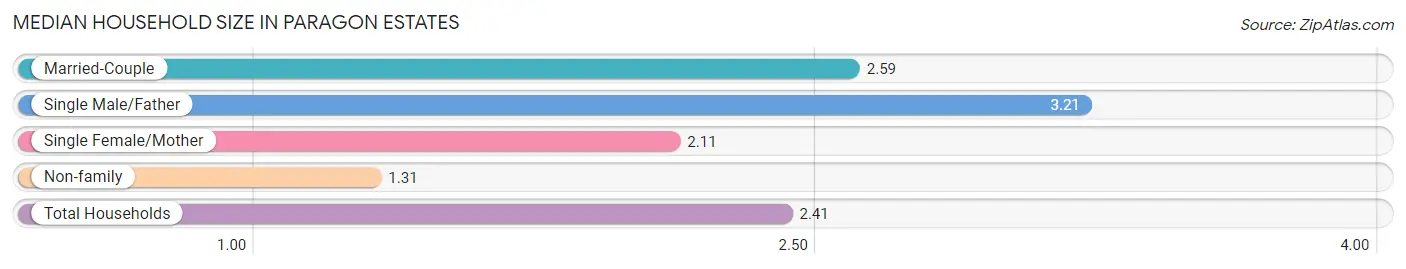
Median Household Size in Paragon Estates
The median household size in Paragon Estates is 2.41 persons per household, with single male/father households (52 | 14.6%) accounting for the largest median household size of 3.21 persons per household. non-family households (72 | 20.2%) represent the smallest median household size with 1.31 persons per household.
| Household Type | # Households | Household Size |
| Married-Couple | 223 (62.6%) | 2.59 |
| Single Male/Father | 52 (14.6%) | 3.21 |
| Single Female/Mother | 9 (2.5%) | 2.11 |
| Non-family | 72 (20.2%) | 1.31 |
| Total Households | 356 (100.0%) | 2.41 |
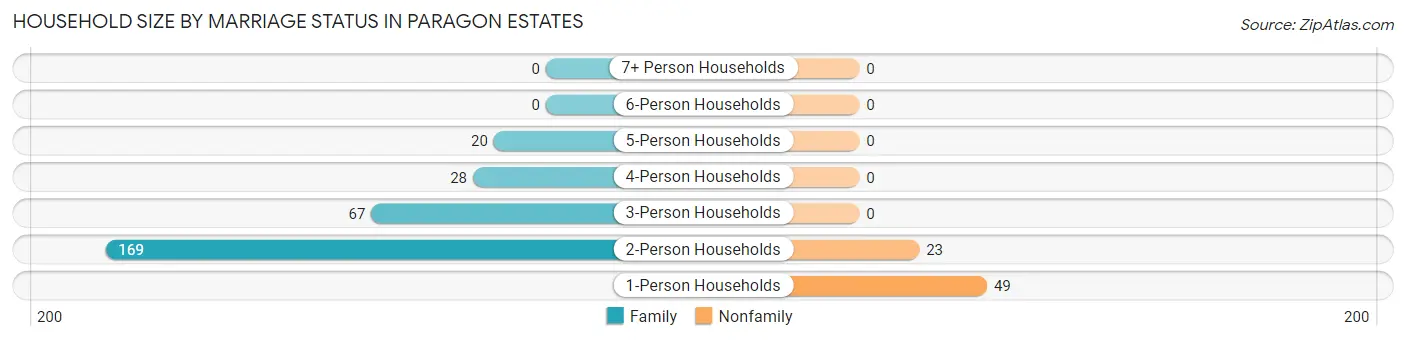
Household Size by Marriage Status in Paragon Estates
Out of a total of 356 households in Paragon Estates, 284 (79.8%) are family households, while 72 (20.2%) are nonfamily households. The most numerous type of family households are 2-person households, comprising 169, and the most common type of nonfamily households are 1-person households, comprising 49.
| Household Size | Family Households | Nonfamily Households |
| 1-Person Households | - | 49 (13.8%) |
| 2-Person Households | 169 (47.5%) | 23 (6.5%) |
| 3-Person Households | 67 (18.8%) | 0 (0.0%) |
| 4-Person Households | 28 (7.9%) | 0 (0.0%) |
| 5-Person Households | 20 (5.6%) | 0 (0.0%) |
| 6-Person Households | 0 (0.0%) | 0 (0.0%) |
| 7+ Person Households | 0 (0.0%) | 0 (0.0%) |
| Total | 284 (79.8%) | 72 (20.2%) |
Female Fertility in Paragon Estates
Fertility by Age in Paragon Estates
| Age Bracket | Women with Births | Births / 1,000 Women |
| 15 to 19 years | 0 (0.0%) | 0.0 |
| 20 to 34 years | 0 (0.0%) | 0.0 |
| 35 to 50 years | 0 (0.0%) | 0.0 |
| Total | 0 (0.0%) | 0.0 |
Fertility by Age by Marriage Status in Paragon Estates
| Age Bracket | Married | Unmarried |
| 15 to 19 years | 0 (0.0%) | 0 (0.0%) |
| 20 to 34 years | 0 (0.0%) | 0 (0.0%) |
| 35 to 50 years | 0 (0.0%) | 0 (0.0%) |
| Total | 0 (0.0%) | 0 (0.0%) |
Fertility by Education in Paragon Estates
| Educational Attainment | Women with Births | Births / 1,000 Women |
| Less than High School | 0 (0.0%) | 0.0 |
| High School Diploma | 0 (0.0%) | 0.0 |
| College or Associate's Degree | 0 (0.0%) | 0.0 |
| Bachelor's Degree | 0 (0.0%) | 0.0 |
| Graduate Degree | 0 (0.0%) | 0.0 |
| Total | 0 (0.0%) | 0.0 |
Fertility by Education by Marriage Status in Paragon Estates
| Educational Attainment | Married | Unmarried |
| Less than High School | 0 (0.0%) | 0 (0.0%) |
| High School Diploma | 0 (0.0%) | 0 (0.0%) |
| College or Associate's Degree | 0 (0.0%) | 0 (0.0%) |
| Bachelor's Degree | 0 (0.0%) | 0 (0.0%) |
| Graduate Degree | 0 (0.0%) | 0 (0.0%) |
| Total | 0 (0.0%) | 0 (0.0%) |
Income in Paragon Estates
Income Overview in Paragon Estates
Per Capita Income in Paragon Estates is $102,687, while median incomes of families and households are $216,333 and $170,556 respectively.
| Characteristic | Number | Measure |
| Per Capita Income | 857 | $102,687 |
| Median Family Income | 284 | $216,333 |
| Mean Family Income | 284 | $225,721 |
| Median Household Income | 356 | $170,556 |
| Mean Household Income | 356 | $240,777 |
| Income Deficit | 284 | $0 |
| Wage / Income Gap (%) | 857 | 31.41% |
| Wage / Income Gap ($) | 857 | 68.59¢ per $1 |
| Gini / Inequality Index | 857 | 0.44 |
Earnings by Sex in Paragon Estates
Average Earnings in Paragon Estates are $79,081, $113,170 for men and $77,619 for women, a difference of 31.4%.
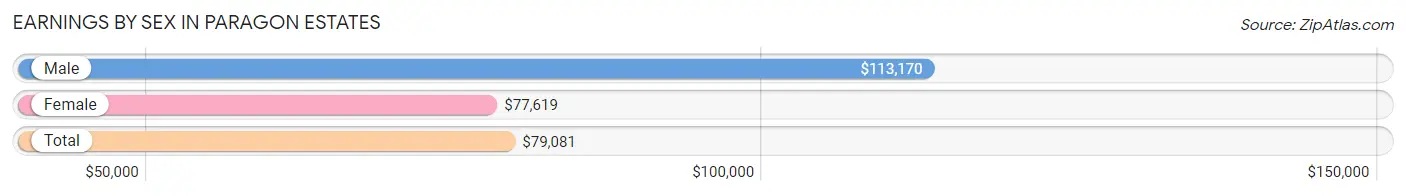
| Sex | Number | Average Earnings |
| Male | 181 (41.2%) | $113,170 |
| Female | 258 (58.8%) | $77,619 |
| Total | 439 (100.0%) | $79,081 |
Earnings by Sex by Income Bracket in Paragon Estates
The most common earnings brackets in Paragon Estates are $100,000+ for men (98 | 54.1%) and $75,000 to $99,999 for women (69 | 26.7%).
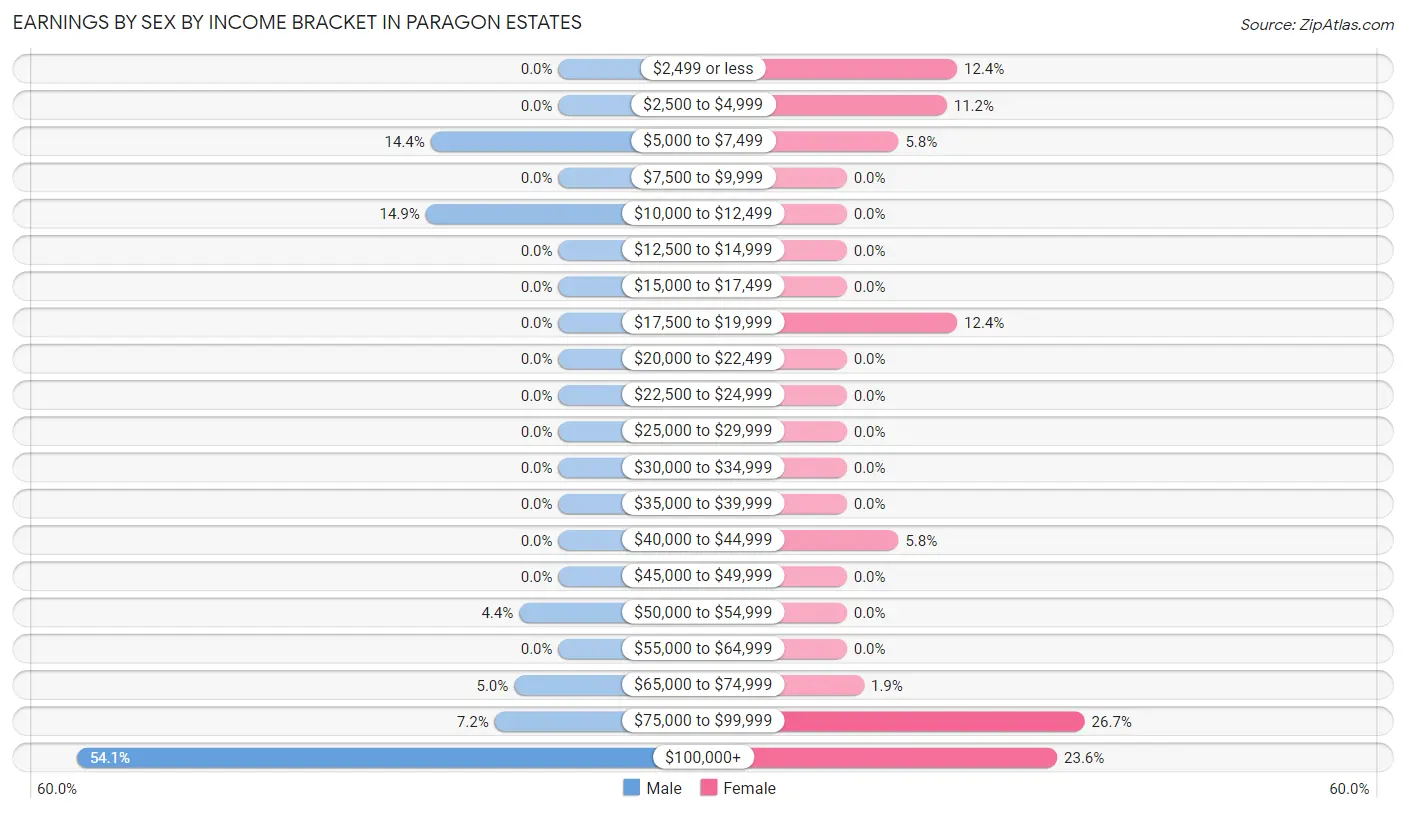
| Income | Male | Female |
| $2,499 or less | 0 (0.0%) | 32 (12.4%) |
| $2,500 to $4,999 | 0 (0.0%) | 29 (11.2%) |
| $5,000 to $7,499 | 26 (14.4%) | 15 (5.8%) |
| $7,500 to $9,999 | 0 (0.0%) | 0 (0.0%) |
| $10,000 to $12,499 | 27 (14.9%) | 0 (0.0%) |
| $12,500 to $14,999 | 0 (0.0%) | 0 (0.0%) |
| $15,000 to $17,499 | 0 (0.0%) | 0 (0.0%) |
| $17,500 to $19,999 | 0 (0.0%) | 32 (12.4%) |
| $20,000 to $22,499 | 0 (0.0%) | 0 (0.0%) |
| $22,500 to $24,999 | 0 (0.0%) | 0 (0.0%) |
| $25,000 to $29,999 | 0 (0.0%) | 0 (0.0%) |
| $30,000 to $34,999 | 0 (0.0%) | 0 (0.0%) |
| $35,000 to $39,999 | 0 (0.0%) | 0 (0.0%) |
| $40,000 to $44,999 | 0 (0.0%) | 15 (5.8%) |
| $45,000 to $49,999 | 0 (0.0%) | 0 (0.0%) |
| $50,000 to $54,999 | 8 (4.4%) | 0 (0.0%) |
| $55,000 to $64,999 | 0 (0.0%) | 0 (0.0%) |
| $65,000 to $74,999 | 9 (5.0%) | 5 (1.9%) |
| $75,000 to $99,999 | 13 (7.2%) | 69 (26.7%) |
| $100,000+ | 98 (54.1%) | 61 (23.6%) |
| Total | 181 (100.0%) | 258 (100.0%) |
Earnings by Sex by Educational Attainment in Paragon Estates
Average earnings in Paragon Estates are $113,973 for men and $78,810 for women, a difference of 30.8%. Men with an educational attainment of bachelor's degree enjoy the highest average annual earnings of $114,286, while those with bachelor's degree education earn the least with $114,286. Women with an educational attainment of bachelor's degree earn the most with the average annual earnings of $88,798, while those with graduate degree education have the smallest earnings of $78,333.
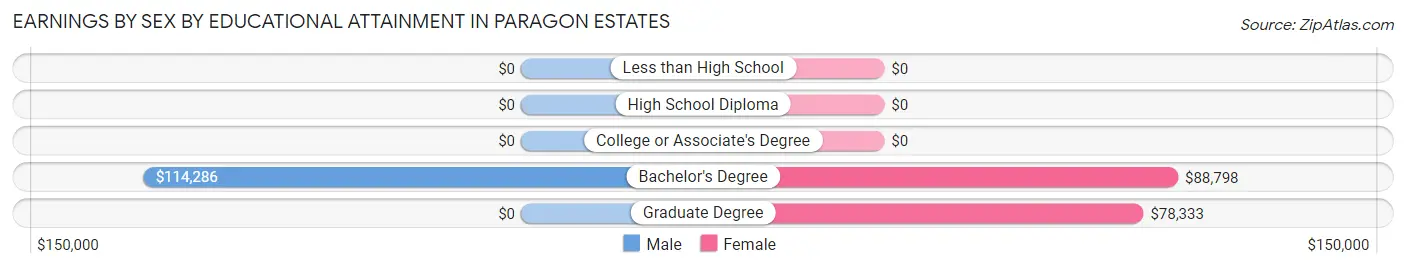
| Educational Attainment | Male Income | Female Income |
| Less than High School | - | - |
| High School Diploma | - | - |
| College or Associate's Degree | - | - |
| Bachelor's Degree | $114,286 | $88,798 |
| Graduate Degree | - | - |
| Total | $113,973 | $78,810 |
Family Income in Paragon Estates
Family Income Brackets in Paragon Estates
According to the Paragon Estates family income data, there are 150 families falling into the $200,000+ income range, which is the most common income bracket and makes up 52.8% of all families.
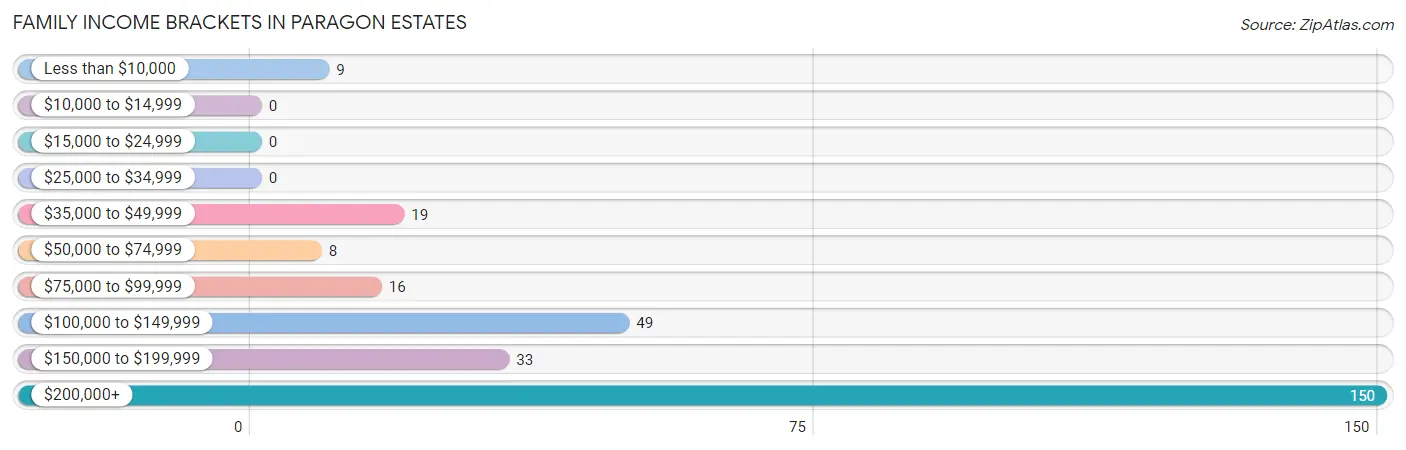
| Income Bracket | # Families | % Families |
| Less than $10,000 | 9 | 3.2% |
| $10,000 to $14,999 | 0 | 0.0% |
| $15,000 to $24,999 | 0 | 0.0% |
| $25,000 to $34,999 | 0 | 0.0% |
| $35,000 to $49,999 | 19 | 6.7% |
| $50,000 to $74,999 | 8 | 2.8% |
| $75,000 to $99,999 | 16 | 5.6% |
| $100,000 to $149,999 | 49 | 17.3% |
| $150,000 to $199,999 | 33 | 11.6% |
| $200,000+ | 150 | 52.8% |
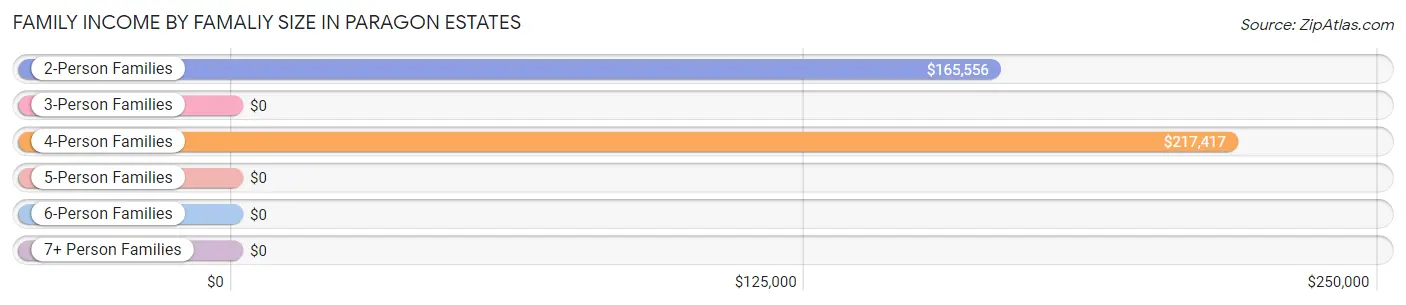
Family Income by Famaliy Size in Paragon Estates
4-person families (29 | 10.2%) account for the highest median family income in Paragon Estates with $217,417 per family, while 2-person families (190 | 66.9%) have the highest median income of $82,778 per family member.
| Income Bracket | # Families | Median Income |
| 2-Person Families | 190 (66.9%) | $165,556 |
| 3-Person Families | 46 (16.2%) | $0 |
| 4-Person Families | 29 (10.2%) | $217,417 |
| 5-Person Families | 19 (6.7%) | $0 |
| 6-Person Families | 0 (0.0%) | $0 |
| 7+ Person Families | 0 (0.0%) | $0 |
| Total | 284 (100.0%) | $216,333 |
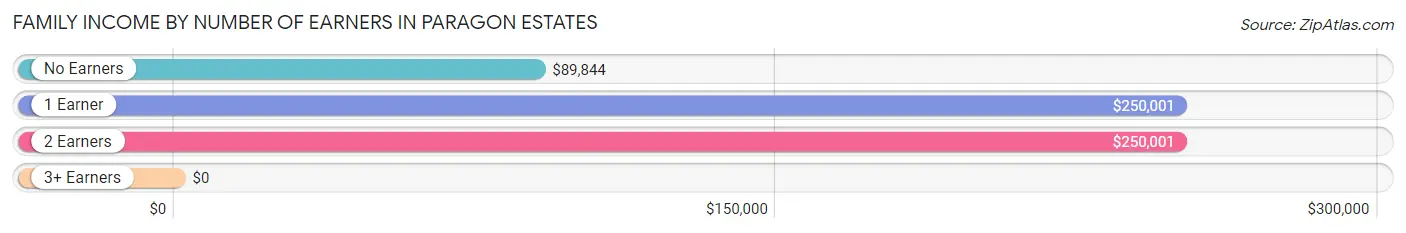
Family Income by Number of Earners in Paragon Estates
| Number of Earners | # Families | Median Income |
| No Earners | 71 (25.0%) | $89,844 |
| 1 Earner | 91 (32.0%) | $250,001 |
| 2 Earners | 105 (37.0%) | $250,001 |
| 3+ Earners | 17 (6.0%) | $0 |
| Total | 284 (100.0%) | $216,333 |
Household Income in Paragon Estates
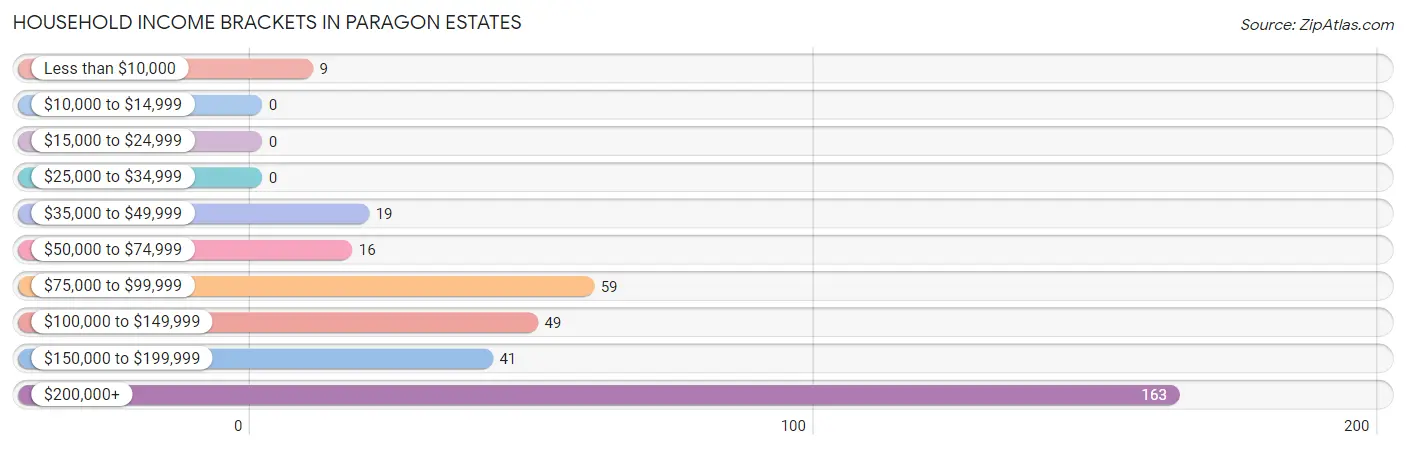
Household Income Brackets in Paragon Estates
With 163 households falling in the category, the $200,000+ income range is the most frequent in Paragon Estates, accounting for 45.8% of all households.
| Income Bracket | # Households | % Households |
| Less than $10,000 | 9 | 2.5% |
| $10,000 to $14,999 | 0 | 0.0% |
| $15,000 to $24,999 | 0 | 0.0% |
| $25,000 to $34,999 | 0 | 0.0% |
| $35,000 to $49,999 | 19 | 5.3% |
| $50,000 to $74,999 | 16 | 4.5% |
| $75,000 to $99,999 | 59 | 16.6% |
| $100,000 to $149,999 | 49 | 13.8% |
| $150,000 to $199,999 | 41 | 11.5% |
| $200,000+ | 163 | 45.8% |
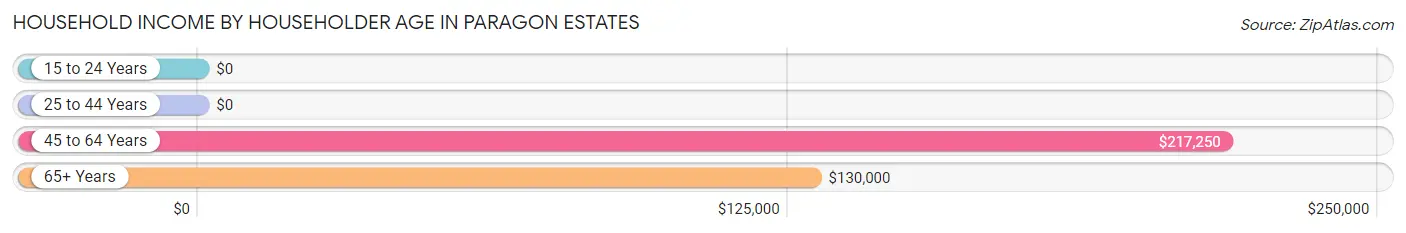
Household Income by Householder Age in Paragon Estates
The median household income in Paragon Estates is $170,556, with the highest median household income of $217,250 found in the 45 to 64 years age bracket for the primary householder. A total of 157 households (44.1%) fall into this category.
| Income Bracket | # Households | Median Income |
| 15 to 24 Years | 0 (0.0%) | $0 |
| 25 to 44 Years | 61 (17.1%) | $0 |
| 45 to 64 Years | 157 (44.1%) | $217,250 |
| 65+ Years | 138 (38.8%) | $130,000 |
| Total | 356 (100.0%) | $170,556 |
Poverty in Paragon Estates
Income Below Poverty by Sex and Age in Paragon Estates
With 2.0% poverty level for males and 4.9% for females among the residents of Paragon Estates, 55 to 64 year old males and 35 to 44 year old females are the most vulnerable to poverty, with 9 males (10.8%) and 11 females (33.3%) in their respective age groups living below the poverty level.
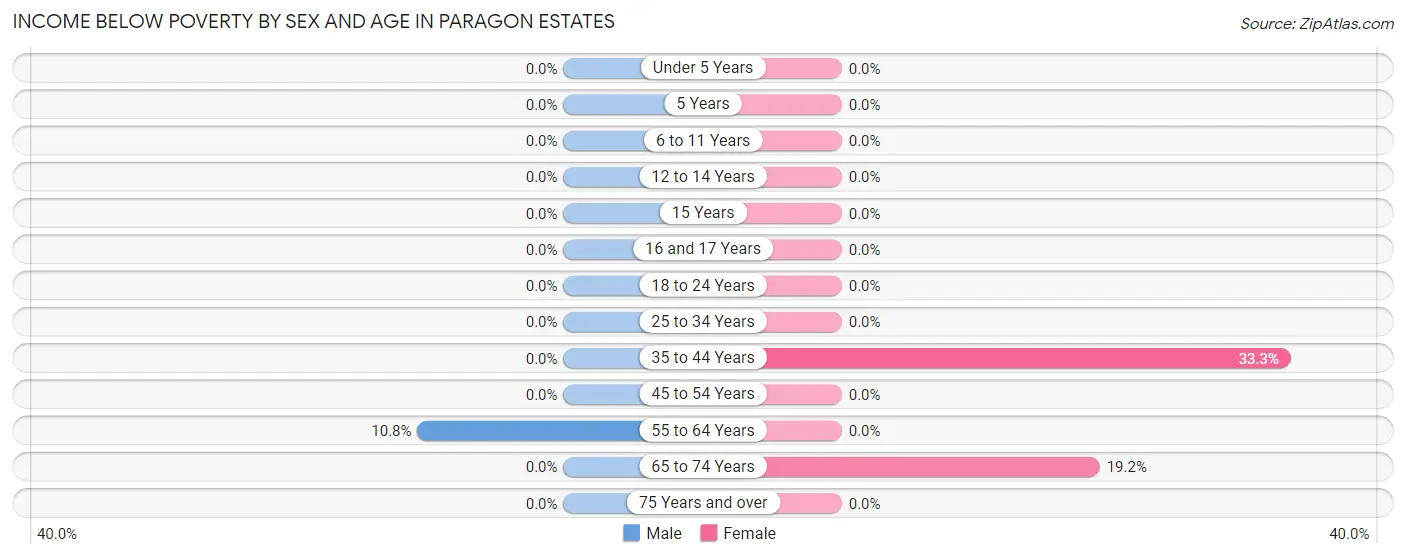
| Age Bracket | Male | Female |
| Under 5 Years | 0 (0.0%) | 0 (0.0%) |
| 5 Years | 0 (0.0%) | 0 (0.0%) |
| 6 to 11 Years | 0 (0.0%) | 0 (0.0%) |
| 12 to 14 Years | 0 (0.0%) | 0 (0.0%) |
| 15 Years | 0 (0.0%) | 0 (0.0%) |
| 16 and 17 Years | 0 (0.0%) | 0 (0.0%) |
| 18 to 24 Years | 0 (0.0%) | 0 (0.0%) |
| 25 to 34 Years | 0 (0.0%) | 0 (0.0%) |
| 35 to 44 Years | 0 (0.0%) | 11 (33.3%) |
| 45 to 54 Years | 0 (0.0%) | 0 (0.0%) |
| 55 to 64 Years | 9 (10.8%) | 0 (0.0%) |
| 65 to 74 Years | 0 (0.0%) | 9 (19.2%) |
| 75 Years and over | 0 (0.0%) | 0 (0.0%) |
| Total | 9 (2.0%) | 20 (4.9%) |
Income Above Poverty by Sex and Age in Paragon Estates
According to the poverty statistics in Paragon Estates, males aged under 5 years and females aged under 5 years are the age groups that are most secure financially, with 100.0% of males and 100.0% of females in these age groups living above the poverty line.
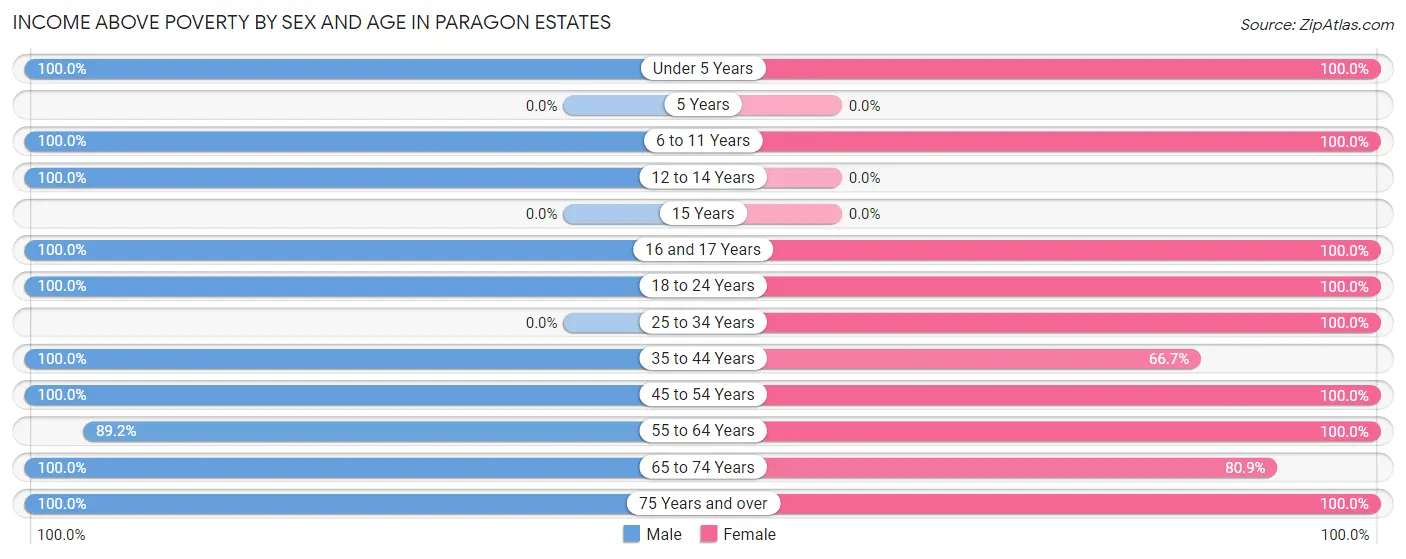
| Age Bracket | Male | Female |
| Under 5 Years | 30 (100.0%) | 19 (100.0%) |
| 5 Years | 0 (0.0%) | 0 (0.0%) |
| 6 to 11 Years | 14 (100.0%) | 15 (100.0%) |
| 12 to 14 Years | 10 (100.0%) | 0 (0.0%) |
| 15 Years | 0 (0.0%) | 0 (0.0%) |
| 16 and 17 Years | 10 (100.0%) | 10 (100.0%) |
| 18 to 24 Years | 34 (100.0%) | 10 (100.0%) |
| 25 to 34 Years | 0 (0.0%) | 42 (100.0%) |
| 35 to 44 Years | 47 (100.0%) | 22 (66.7%) |
| 45 to 54 Years | 84 (100.0%) | 87 (100.0%) |
| 55 to 64 Years | 74 (89.2%) | 92 (100.0%) |
| 65 to 74 Years | 50 (100.0%) | 38 (80.8%) |
| 75 Years and over | 86 (100.0%) | 54 (100.0%) |
| Total | 439 (98.0%) | 389 (95.1%) |
Income Below Poverty Among Married-Couple Families in Paragon Estates
The poverty statistics for married-couple families in Paragon Estates show that 4.0% or 9 of the total 223 families live below the poverty line. Families with no children have the highest poverty rate of 5.1%, comprising of 9 families. On the other hand, families with 1 or 2 children have the lowest poverty rate of 0.0%, which includes 0 families.
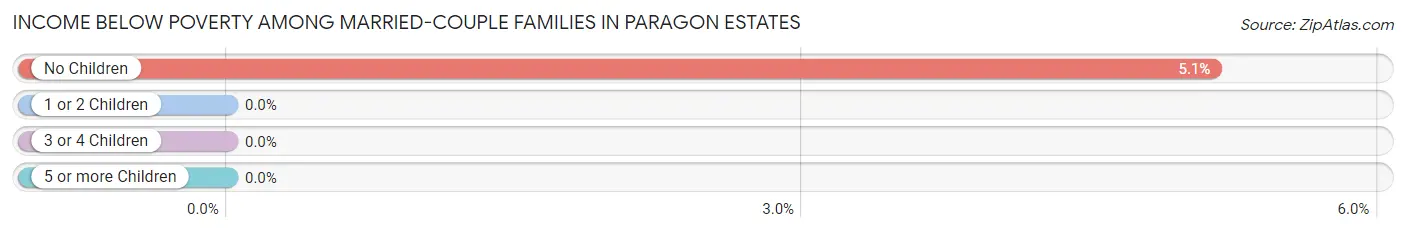
| Children | Above Poverty | Below Poverty |
| No Children | 166 (94.9%) | 9 (5.1%) |
| 1 or 2 Children | 48 (100.0%) | 0 (0.0%) |
| 3 or 4 Children | 0 (0.0%) | 0 (0.0%) |
| 5 or more Children | 0 (0.0%) | 0 (0.0%) |
| Total | 214 (96.0%) | 9 (4.0%) |
Income Below Poverty Among Single-Parent Households in Paragon Estates
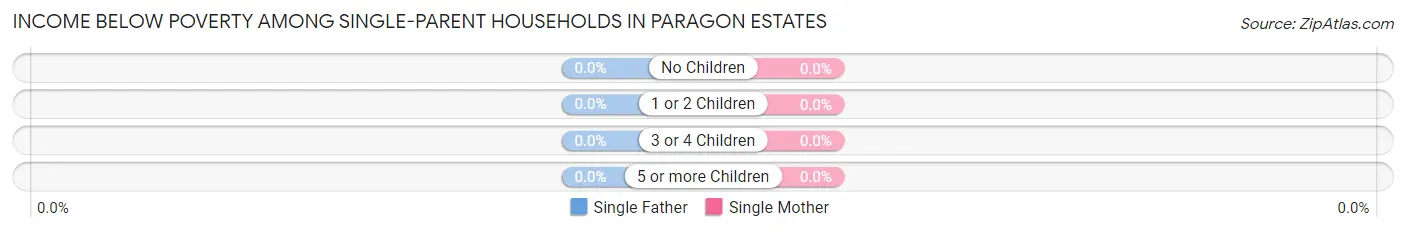
| Children | Single Father | Single Mother |
| No Children | 0 (0.0%) | 0 (0.0%) |
| 1 or 2 Children | 0 (0.0%) | 0 (0.0%) |
| 3 or 4 Children | 0 (0.0%) | 0 (0.0%) |
| 5 or more Children | 0 (0.0%) | 0 (0.0%) |
| Total | 0 (0.0%) | 0 (0.0%) |
Income Below Poverty Among Married-Couple vs Single-Parent Households in Paragon Estates
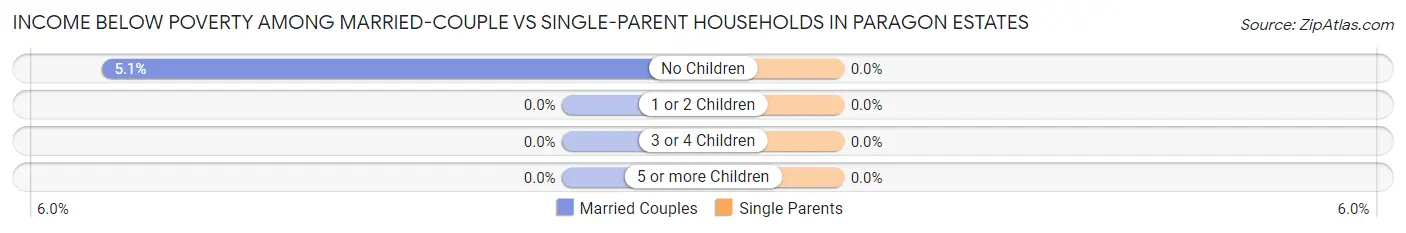
| Children | Married-Couple Families | Single-Parent Households |
| No Children | 9 (5.1%) | 0 (0.0%) |
| 1 or 2 Children | 0 (0.0%) | 0 (0.0%) |
| 3 or 4 Children | 0 (0.0%) | 0 (0.0%) |
| 5 or more Children | 0 (0.0%) | 0 (0.0%) |
| Total | 9 (4.0%) | 0 (0.0%) |
Employment Characteristics in Paragon Estates
Employment by Class of Employer in Paragon Estates
Among the 367 employed individuals in Paragon Estates, private company employees (202 | 55.0%), local government employees (72 | 19.6%), and self-employed (not incorporated) (65 | 17.7%) make up the most common classes of employment.
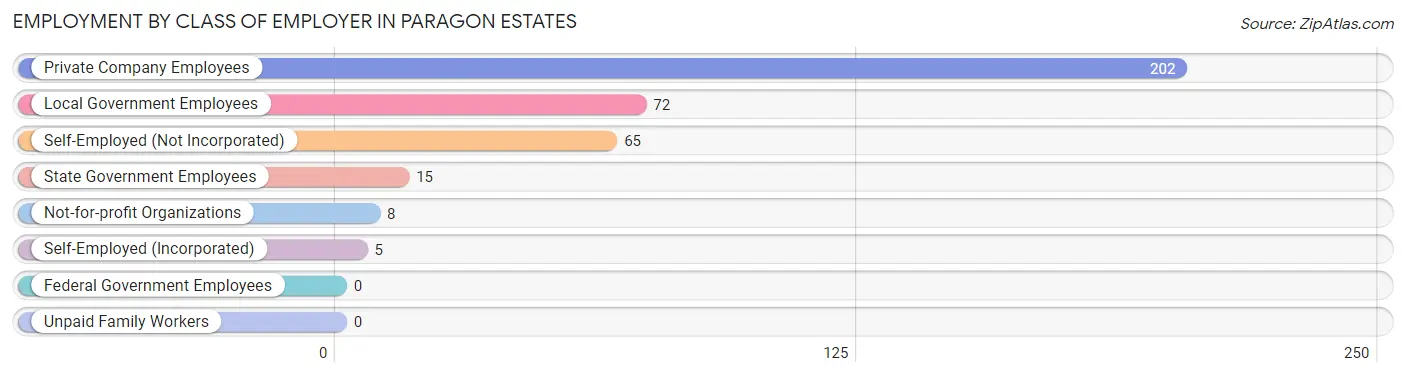
| Employer Class | # Employees | % Employees |
| Private Company Employees | 202 | 55.0% |
| Self-Employed (Incorporated) | 5 | 1.4% |
| Self-Employed (Not Incorporated) | 65 | 17.7% |
| Not-for-profit Organizations | 8 | 2.2% |
| Local Government Employees | 72 | 19.6% |
| State Government Employees | 15 | 4.1% |
| Federal Government Employees | 0 | 0.0% |
| Unpaid Family Workers | 0 | 0.0% |
| Total | 367 | 100.0% |
Employment Status by Age in Paragon Estates
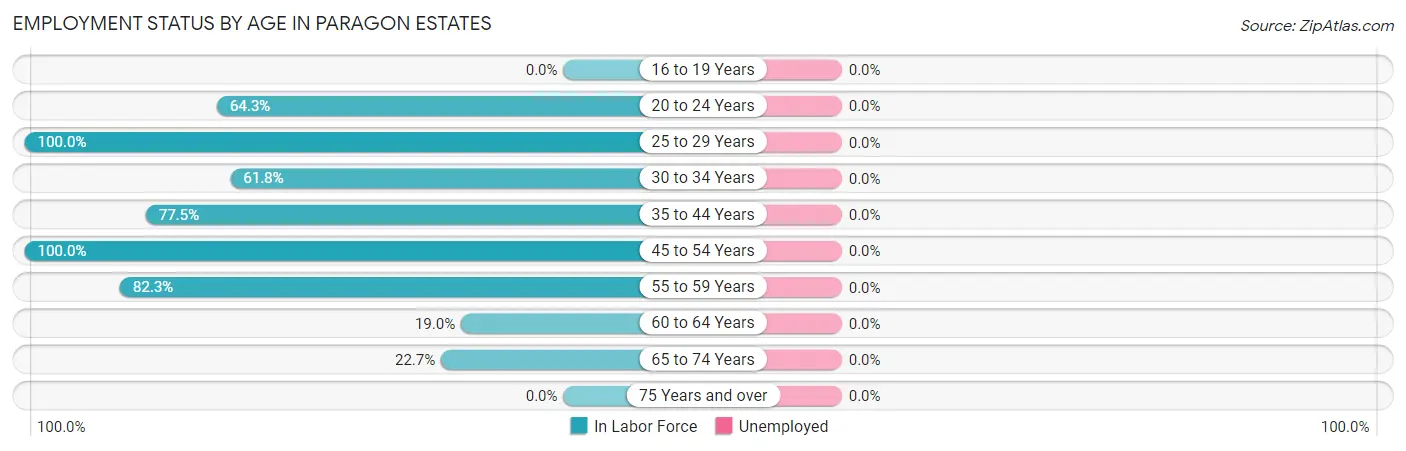
| Age Bracket | In Labor Force | Unemployed |
| 16 to 19 Years | 0 (0.0%) | 0 (0.0%) |
| 20 to 24 Years | 18 (64.3%) | 0 (0.0%) |
| 25 to 29 Years | 8 (100.0%) | 0 (0.0%) |
| 30 to 34 Years | 21 (61.8%) | 0 (0.0%) |
| 35 to 44 Years | 62 (77.5%) | 0 (0.0%) |
| 45 to 54 Years | 171 (100.0%) | 0 (0.0%) |
| 55 to 59 Years | 79 (82.3%) | 0 (0.0%) |
| 60 to 64 Years | 15 (19.0%) | 0 (0.0%) |
| 65 to 74 Years | 22 (22.7%) | 0 (0.0%) |
| 75 Years and over | 0 (0.0%) | 0 (0.0%) |
| Total | 396 (51.5%) | 0 (0.0%) |
Employment Status by Educational Attainment in Paragon Estates
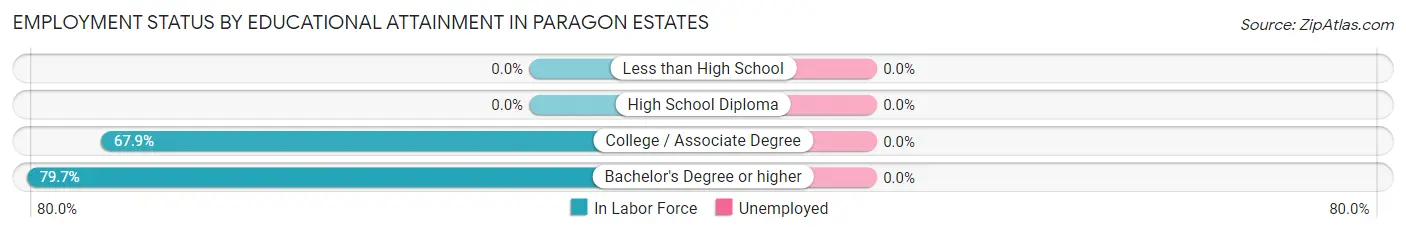
| Educational Attainment | In Labor Force | Unemployed |
| Less than High School | 0 (0.0%) | 0 (0.0%) |
| High School Diploma | 0 (0.0%) | 0 (0.0%) |
| College / Associate Degree | 19 (67.9%) | 0 (0.0%) |
| Bachelor's Degree or higher | 337 (79.7%) | 0 (0.0%) |
| Total | 356 (76.1%) | 0 (0.0%) |
Employment Occupations by Sex in Paragon Estates
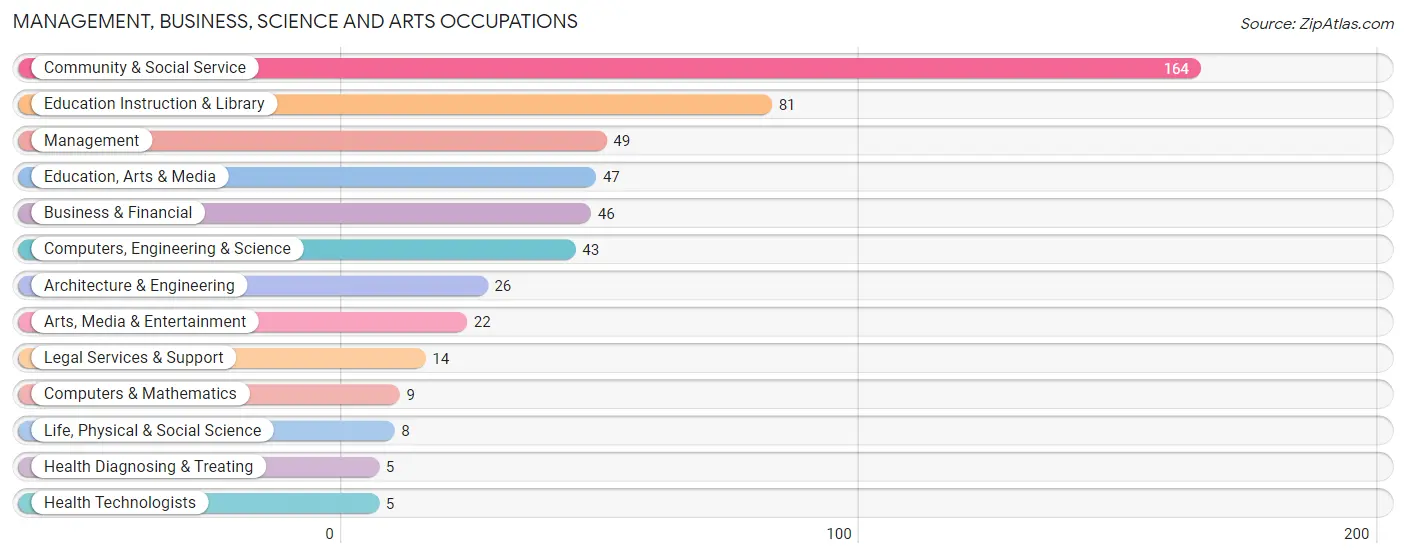
Management, Business, Science and Arts Occupations
The most common Management, Business, Science and Arts occupations in Paragon Estates are Community & Social Service (164 | 41.4%), Education Instruction & Library (81 | 20.4%), Management (49 | 12.4%), Education, Arts & Media (47 | 11.9%), and Business & Financial (46 | 11.6%).
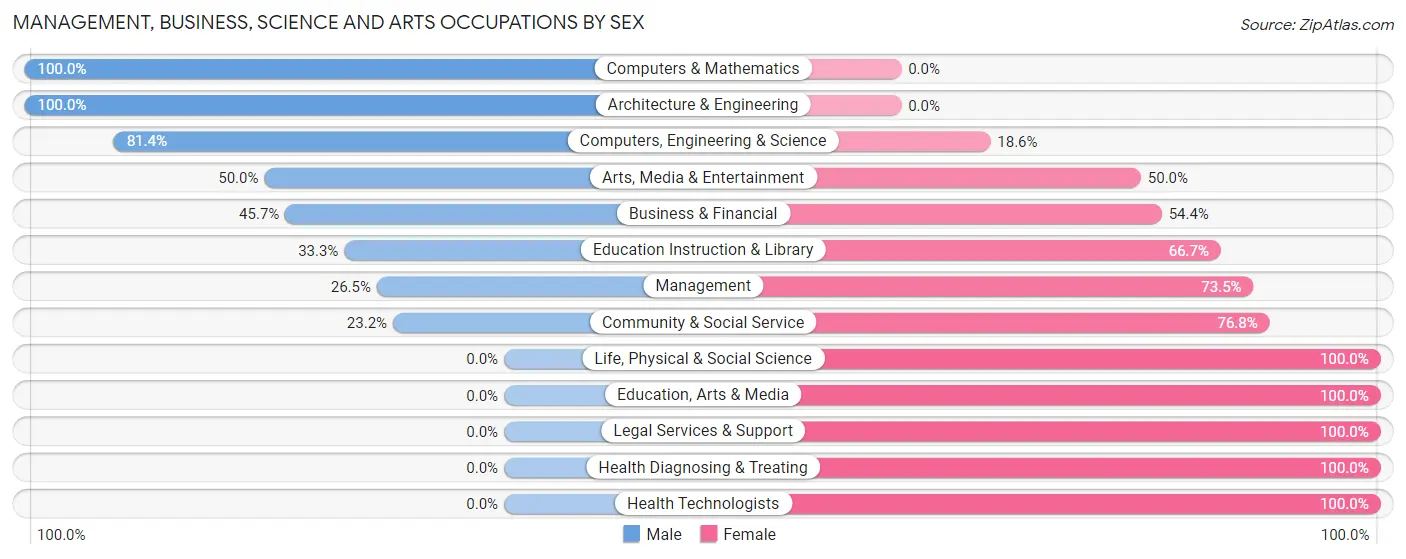
Management, Business, Science and Arts Occupations by Sex
Within the Management, Business, Science and Arts occupations in Paragon Estates, the most male-oriented occupations are Computers & Mathematics (100.0%), Architecture & Engineering (100.0%), and Computers, Engineering & Science (81.4%), while the most female-oriented occupations are Life, Physical & Social Science (100.0%), Education, Arts & Media (100.0%), and Legal Services & Support (100.0%).
| Occupation | Male | Female |
| Management | 13 (26.5%) | 36 (73.5%) |
| Business & Financial | 21 (45.7%) | 25 (54.3%) |
| Computers, Engineering & Science | 35 (81.4%) | 8 (18.6%) |
| Computers & Mathematics | 9 (100.0%) | 0 (0.0%) |
| Architecture & Engineering | 26 (100.0%) | 0 (0.0%) |
| Life, Physical & Social Science | 0 (0.0%) | 8 (100.0%) |
| Community & Social Service | 38 (23.2%) | 126 (76.8%) |
| Education, Arts & Media | 0 (0.0%) | 47 (100.0%) |
| Legal Services & Support | 0 (0.0%) | 14 (100.0%) |
| Education Instruction & Library | 27 (33.3%) | 54 (66.7%) |
| Arts, Media & Entertainment | 11 (50.0%) | 11 (50.0%) |
| Health Diagnosing & Treating | 0 (0.0%) | 5 (100.0%) |
| Health Technologists | 0 (0.0%) | 5 (100.0%) |
| Total (Category) | 107 (34.8%) | 200 (65.1%) |
| Total (Overall) | 173 (43.7%) | 223 (56.3%) |
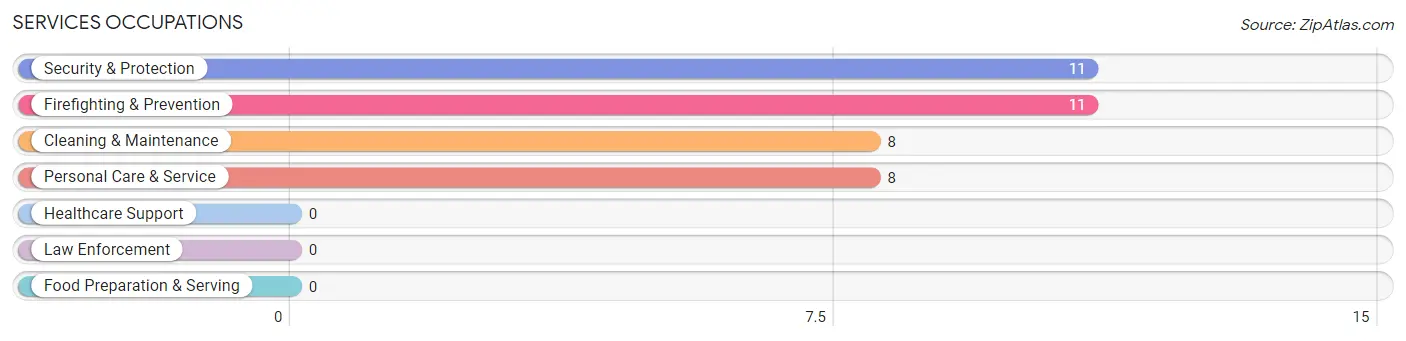
Services Occupations
The most common Services occupations in Paragon Estates are Security & Protection (11 | 2.8%), Firefighting & Prevention (11 | 2.8%), Cleaning & Maintenance (8 | 2.0%), and Personal Care & Service (8 | 2.0%).
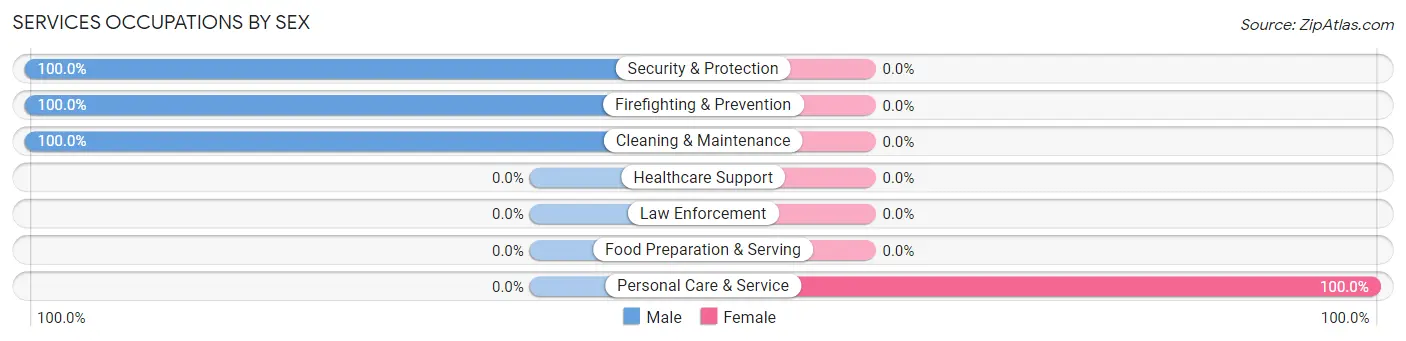
Services Occupations by Sex
| Occupation | Male | Female |
| Healthcare Support | 0 (0.0%) | 0 (0.0%) |
| Security & Protection | 11 (100.0%) | 0 (0.0%) |
| Firefighting & Prevention | 11 (100.0%) | 0 (0.0%) |
| Law Enforcement | 0 (0.0%) | 0 (0.0%) |
| Food Preparation & Serving | 0 (0.0%) | 0 (0.0%) |
| Cleaning & Maintenance | 8 (100.0%) | 0 (0.0%) |
| Personal Care & Service | 0 (0.0%) | 8 (100.0%) |
| Total (Category) | 19 (70.4%) | 8 (29.6%) |
| Total (Overall) | 173 (43.7%) | 223 (56.3%) |
Sales and Office Occupations
The most common Sales and Office occupations in Paragon Estates are Office & Administration (35 | 8.8%), and Sales & Related (27 | 6.8%).
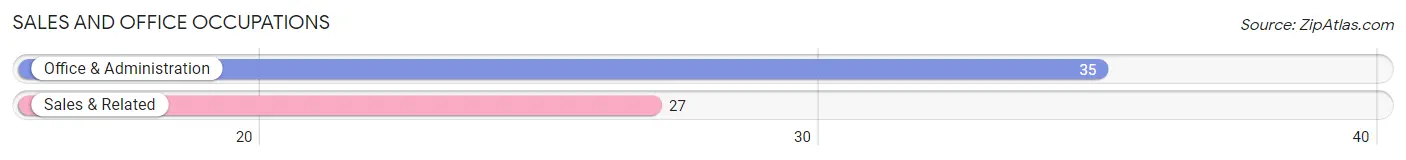
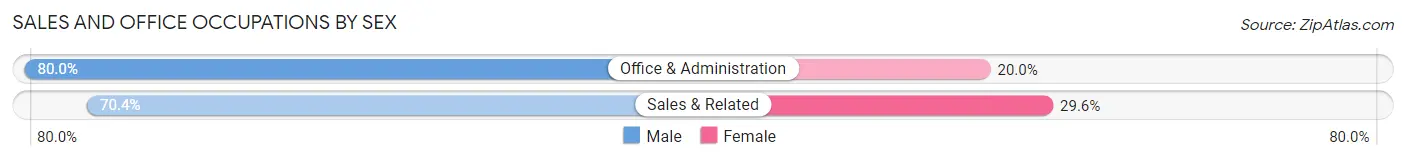
Sales and Office Occupations by Sex
| Occupation | Male | Female |
| Sales & Related | 19 (70.4%) | 8 (29.6%) |
| Office & Administration | 28 (80.0%) | 7 (20.0%) |
| Total (Category) | 47 (75.8%) | 15 (24.2%) |
| Total (Overall) | 173 (43.7%) | 223 (56.3%) |
Natural Resources, Construction and Maintenance Occupations
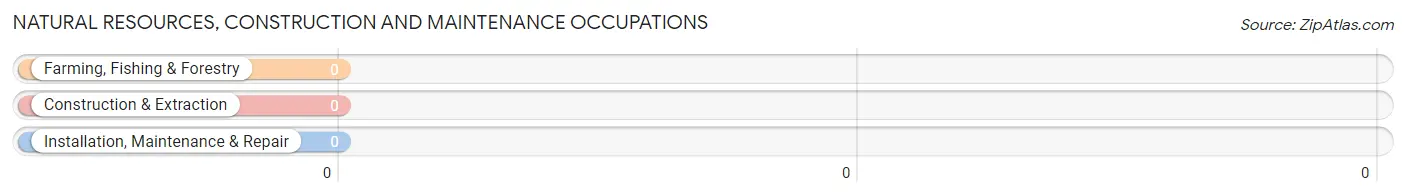
Natural Resources, Construction and Maintenance Occupations by Sex
| Occupation | Male | Female |
| Farming, Fishing & Forestry | 0 (0.0%) | 0 (0.0%) |
| Construction & Extraction | 0 (0.0%) | 0 (0.0%) |
| Installation, Maintenance & Repair | 0 (0.0%) | 0 (0.0%) |
| Total (Category) | 0 (0.0%) | 0 (0.0%) |
| Total (Overall) | 173 (43.7%) | 223 (56.3%) |
Production, Transportation and Moving Occupations
Production, Transportation and Moving Occupations by Sex
| Occupation | Male | Female |
| Production | 0 (0.0%) | 0 (0.0%) |
| Transportation | 0 (0.0%) | 0 (0.0%) |
| Material Moving | 0 (0.0%) | 0 (0.0%) |
| Total (Category) | 0 (0.0%) | 0 (0.0%) |
| Total (Overall) | 173 (43.7%) | 223 (56.3%) |
Employment Industries by Sex in Paragon Estates
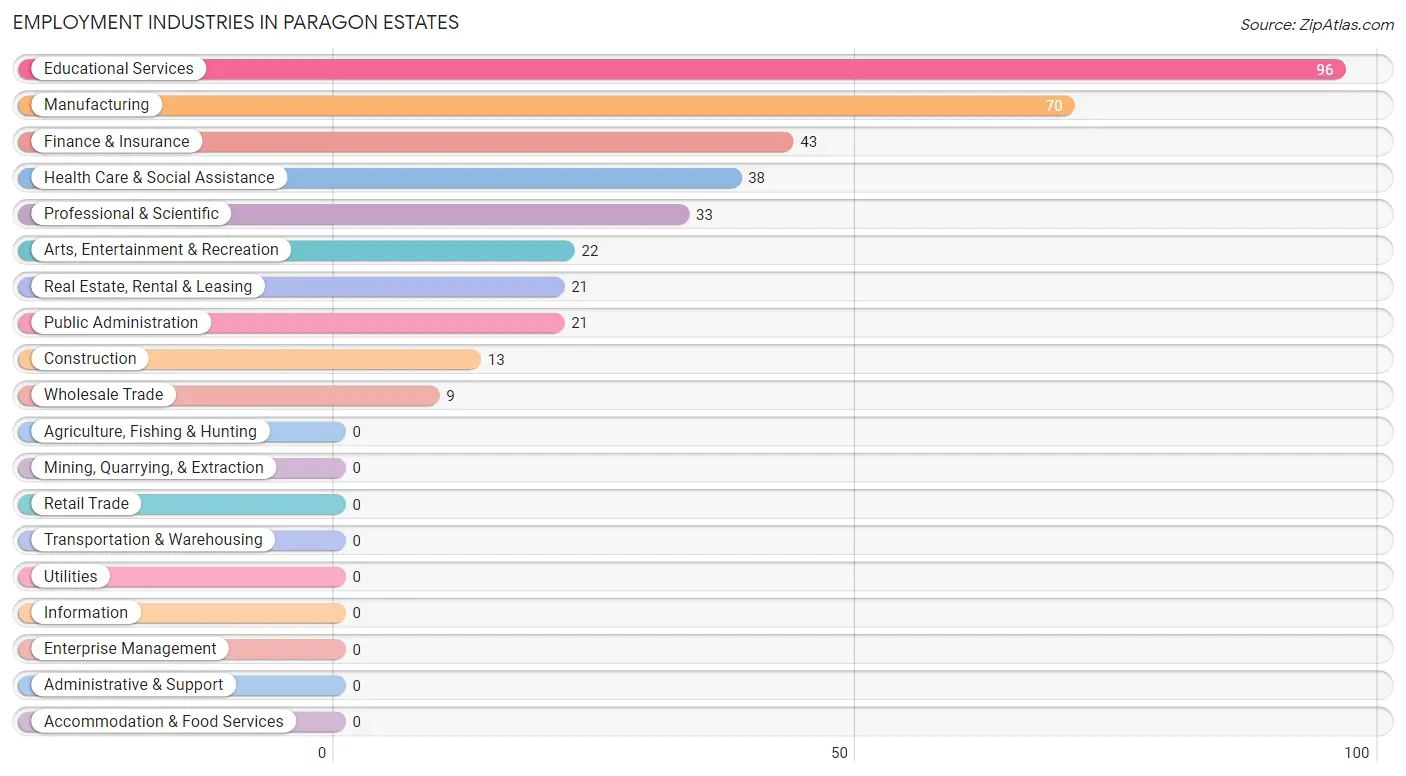
Employment Industries in Paragon Estates
The major employment industries in Paragon Estates include Educational Services (96 | 24.2%), Manufacturing (70 | 17.7%), Finance & Insurance (43 | 10.9%), Health Care & Social Assistance (38 | 9.6%), and Professional & Scientific (33 | 8.3%).
Employment Industries by Sex in Paragon Estates
The Paragon Estates industries that see more men than women are Construction (100.0%), Wholesale Trade (100.0%), and Manufacturing (75.7%), whereas the industries that tend to have a higher number of women are Real Estate, Rental & Leasing (100.0%), Public Administration (100.0%), and Health Care & Social Assistance (78.9%).
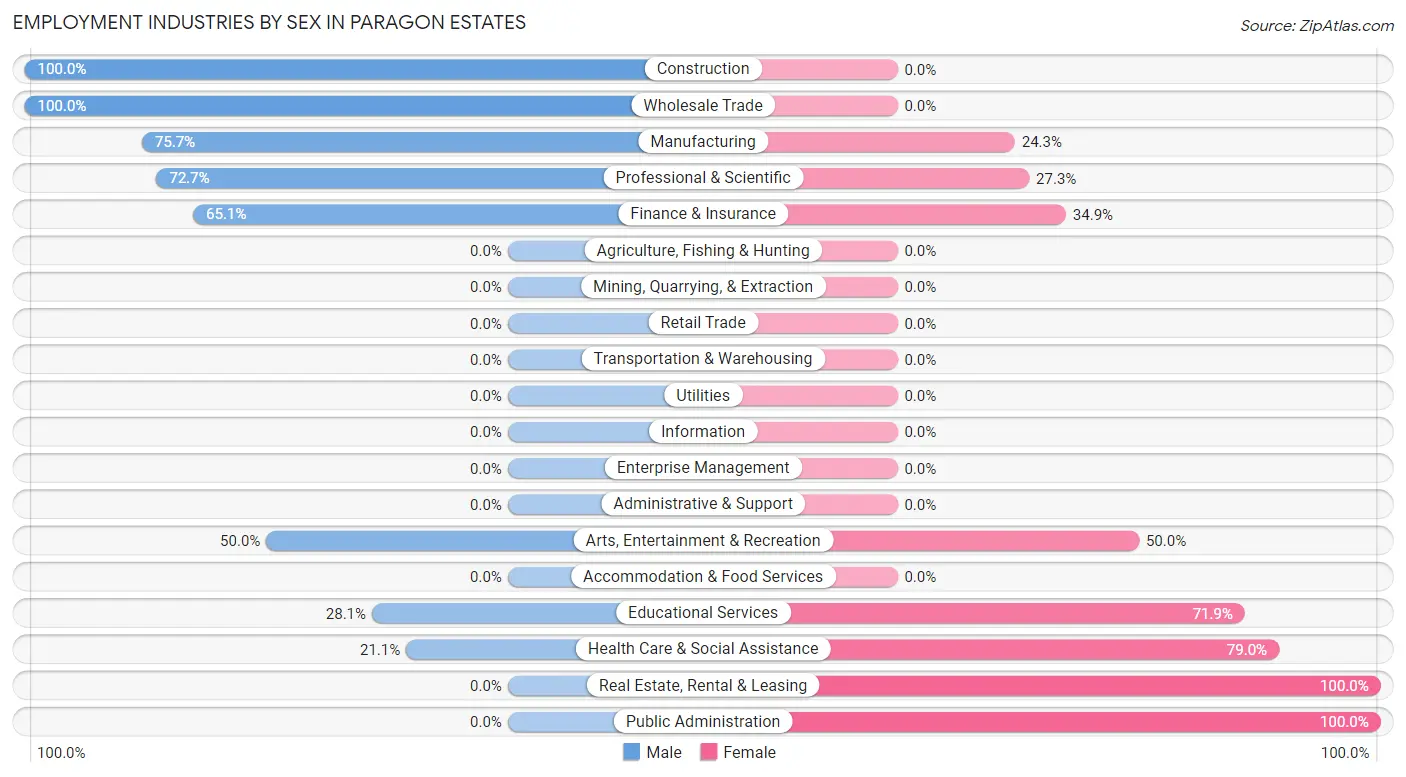
| Industry | Male | Female |
| Agriculture, Fishing & Hunting | 0 (0.0%) | 0 (0.0%) |
| Mining, Quarrying, & Extraction | 0 (0.0%) | 0 (0.0%) |
| Construction | 13 (100.0%) | 0 (0.0%) |
| Manufacturing | 53 (75.7%) | 17 (24.3%) |
| Wholesale Trade | 9 (100.0%) | 0 (0.0%) |
| Retail Trade | 0 (0.0%) | 0 (0.0%) |
| Transportation & Warehousing | 0 (0.0%) | 0 (0.0%) |
| Utilities | 0 (0.0%) | 0 (0.0%) |
| Information | 0 (0.0%) | 0 (0.0%) |
| Finance & Insurance | 28 (65.1%) | 15 (34.9%) |
| Real Estate, Rental & Leasing | 0 (0.0%) | 21 (100.0%) |
| Professional & Scientific | 24 (72.7%) | 9 (27.3%) |
| Enterprise Management | 0 (0.0%) | 0 (0.0%) |
| Administrative & Support | 0 (0.0%) | 0 (0.0%) |
| Educational Services | 27 (28.1%) | 69 (71.9%) |
| Health Care & Social Assistance | 8 (21.0%) | 30 (78.9%) |
| Arts, Entertainment & Recreation | 11 (50.0%) | 11 (50.0%) |
| Accommodation & Food Services | 0 (0.0%) | 0 (0.0%) |
| Public Administration | 0 (0.0%) | 21 (100.0%) |
| Total | 173 (43.7%) | 223 (56.3%) |
Education in Paragon Estates
School Enrollment in Paragon Estates
The most common levels of schooling among the 146 students in Paragon Estates are college / undergraduate (50 | 34.3%), elementary school (28 | 19.2%), and graduate / professional (27 | 18.5%).
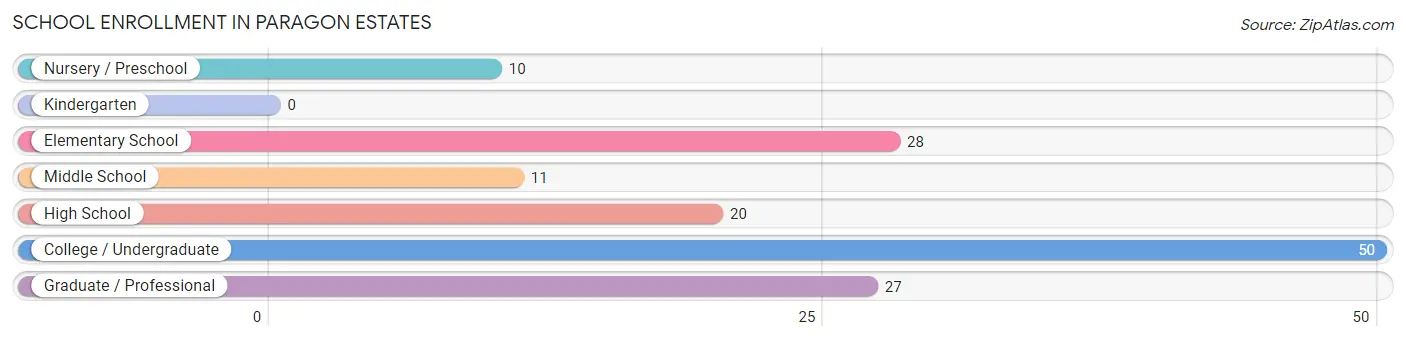
| School Level | # Students | % Students |
| Nursery / Preschool | 10 | 6.9% |
| Kindergarten | 0 | 0.0% |
| Elementary School | 28 | 19.2% |
| Middle School | 11 | 7.5% |
| High School | 20 | 13.7% |
| College / Undergraduate | 50 | 34.3% |
| Graduate / Professional | 27 | 18.5% |
| Total | 146 | 100.0% |
School Enrollment by Age by Funding Source in Paragon Estates
Out of a total of 146 students who are enrolled in schools in Paragon Estates, 20 (13.7%) attend a private institution, while the remaining 126 (86.3%) are enrolled in public schools. The age group of 3 to 4 year olds has the highest likelihood of being enrolled in private schools, with 10 (100.0% in the age bracket) enrolled. Conversely, the age group of 5 to 9 year old has the lowest likelihood of being enrolled in a private school, with 28 (100.0% in the age bracket) attending a public institution.
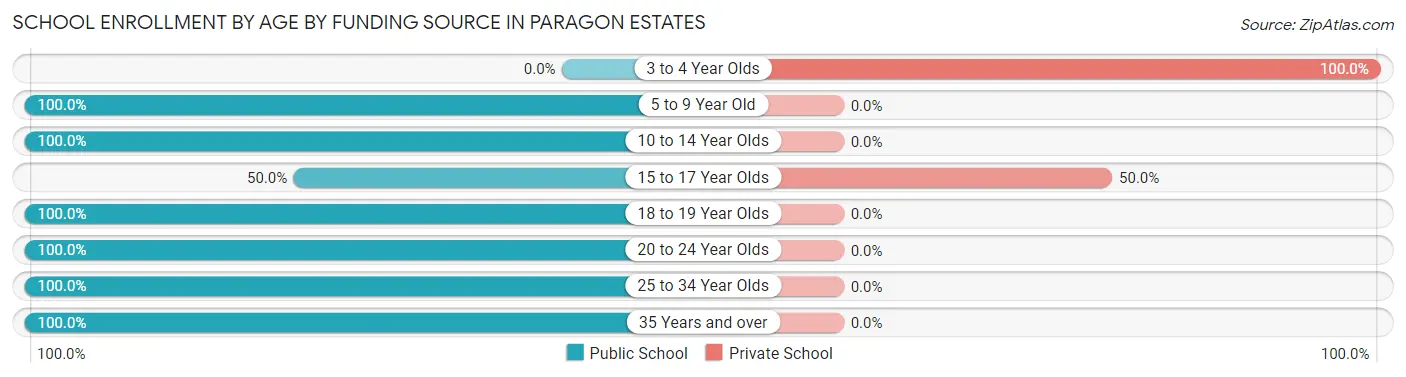
| Age Bracket | Public School | Private School |
| 3 to 4 Year Olds | 0 (0.0%) | 10 (100.0%) |
| 5 to 9 Year Old | 28 (100.0%) | 0 (0.0%) |
| 10 to 14 Year Olds | 11 (100.0%) | 0 (0.0%) |
| 15 to 17 Year Olds | 10 (50.0%) | 10 (50.0%) |
| 18 to 19 Year Olds | 16 (100.0%) | 0 (0.0%) |
| 20 to 24 Year Olds | 21 (100.0%) | 0 (0.0%) |
| 25 to 34 Year Olds | 8 (100.0%) | 0 (0.0%) |
| 35 Years and over | 32 (100.0%) | 0 (0.0%) |
| Total | 126 (86.3%) | 20 (13.7%) |
Educational Attainment by Field of Study in Paragon Estates
Engineering (94 | 13.6%), social sciences (85 | 12.3%), business (84 | 12.1%), physical & health sciences (71 | 10.2%), and bio, nature & agricultural (65 | 9.4%) are the most common fields of study among 693 individuals in Paragon Estates who have obtained a bachelor's degree or higher.
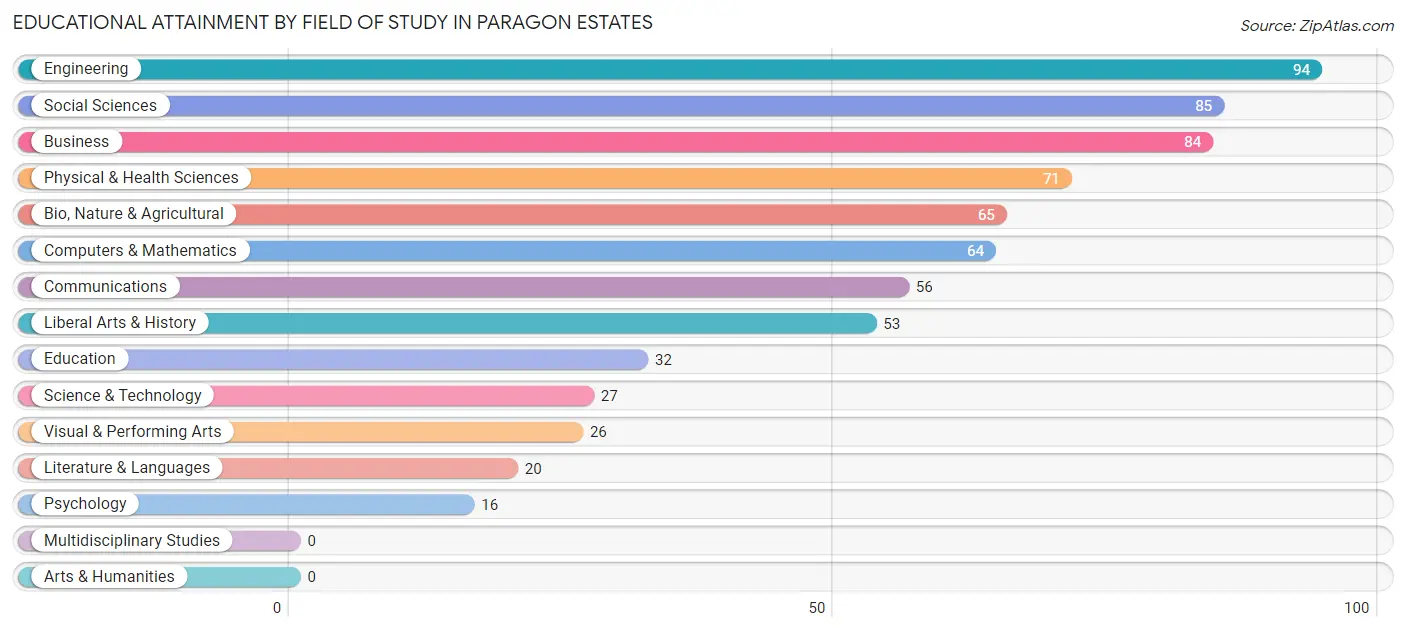
| Field of Study | # Graduates | % Graduates |
| Computers & Mathematics | 64 | 9.2% |
| Bio, Nature & Agricultural | 65 | 9.4% |
| Physical & Health Sciences | 71 | 10.2% |
| Psychology | 16 | 2.3% |
| Social Sciences | 85 | 12.3% |
| Engineering | 94 | 13.6% |
| Multidisciplinary Studies | 0 | 0.0% |
| Science & Technology | 27 | 3.9% |
| Business | 84 | 12.1% |
| Education | 32 | 4.6% |
| Literature & Languages | 20 | 2.9% |
| Liberal Arts & History | 53 | 7.6% |
| Visual & Performing Arts | 26 | 3.7% |
| Communications | 56 | 8.1% |
| Arts & Humanities | 0 | 0.0% |
| Total | 693 | 100.0% |
Transportation & Commute in Paragon Estates
Vehicle Availability by Sex in Paragon Estates
The most prevalent vehicle ownership categories in Paragon Estates are males with 3 vehicles (70, accounting for 40.5%) and females with 3 vehicles (75, making up 36.1%).
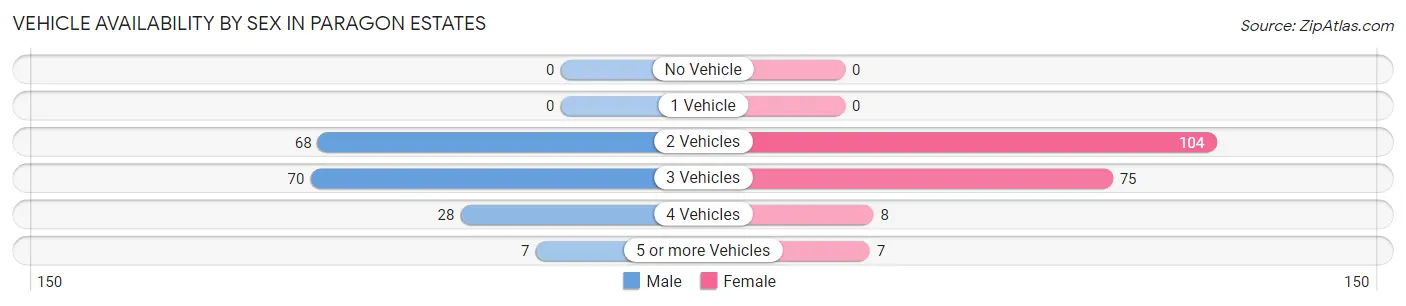
| Vehicles Available | Male | Female |
| No Vehicle | 0 (0.0%) | 0 (0.0%) |
| 1 Vehicle | 0 (0.0%) | 0 (0.0%) |
| 2 Vehicles | 68 (39.3%) | 104 (53.6%) |
| 3 Vehicles | 70 (40.5%) | 75 (38.7%) |
| 4 Vehicles | 28 (16.2%) | 8 (4.1%) |
| 5 or more Vehicles | 7 (4.1%) | 7 (3.6%) |
| Total | 173 (100.0%) | 194 (100.0%) |
Commute Time in Paragon Estates
The most frequently occuring commute durations in Paragon Estates are 10 to 14 minutes (91 commuters, 33.5%), 15 to 19 minutes (63 commuters, 23.2%), and 25 to 29 minutes (36 commuters, 13.2%).
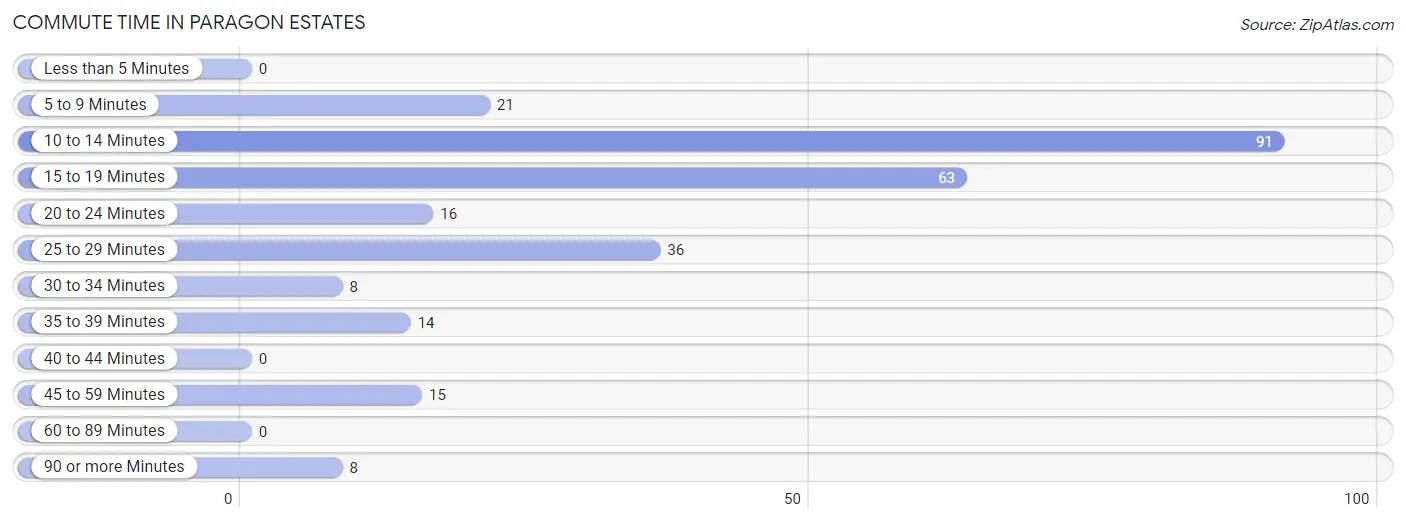
| Commute Time | # Commuters | % Commuters |
| Less than 5 Minutes | 0 | 0.0% |
| 5 to 9 Minutes | 21 | 7.7% |
| 10 to 14 Minutes | 91 | 33.5% |
| 15 to 19 Minutes | 63 | 23.2% |
| 20 to 24 Minutes | 16 | 5.9% |
| 25 to 29 Minutes | 36 | 13.2% |
| 30 to 34 Minutes | 8 | 2.9% |
| 35 to 39 Minutes | 14 | 5.1% |
| 40 to 44 Minutes | 0 | 0.0% |
| 45 to 59 Minutes | 15 | 5.5% |
| 60 to 89 Minutes | 0 | 0.0% |
| 90 or more Minutes | 8 | 2.9% |
Commute Time by Sex in Paragon Estates
The most common commute times in Paragon Estates are 10 to 14 minutes (48 commuters, 32.2%) for males and 10 to 14 minutes (43 commuters, 35.0%) for females.
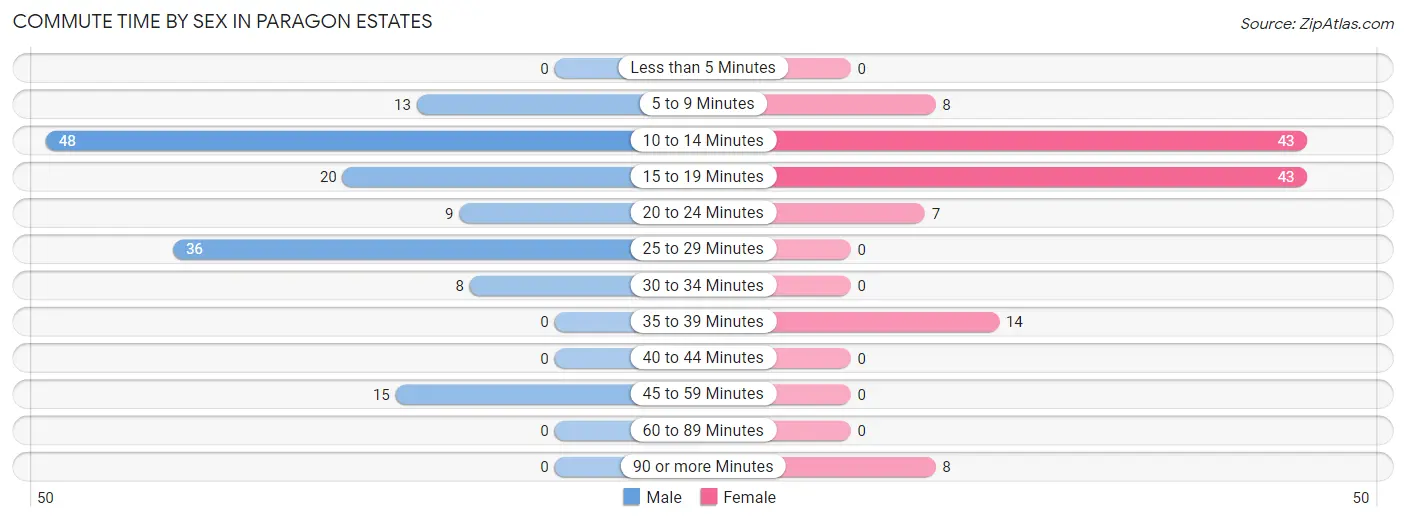
| Commute Time | Male | Female |
| Less than 5 Minutes | 0 (0.0%) | 0 (0.0%) |
| 5 to 9 Minutes | 13 (8.7%) | 8 (6.5%) |
| 10 to 14 Minutes | 48 (32.2%) | 43 (35.0%) |
| 15 to 19 Minutes | 20 (13.4%) | 43 (35.0%) |
| 20 to 24 Minutes | 9 (6.0%) | 7 (5.7%) |
| 25 to 29 Minutes | 36 (24.2%) | 0 (0.0%) |
| 30 to 34 Minutes | 8 (5.4%) | 0 (0.0%) |
| 35 to 39 Minutes | 0 (0.0%) | 14 (11.4%) |
| 40 to 44 Minutes | 0 (0.0%) | 0 (0.0%) |
| 45 to 59 Minutes | 15 (10.1%) | 0 (0.0%) |
| 60 to 89 Minutes | 0 (0.0%) | 0 (0.0%) |
| 90 or more Minutes | 0 (0.0%) | 8 (6.5%) |
Time of Departure to Work by Sex in Paragon Estates
The most frequent times of departure to work in Paragon Estates are 8:00 AM to 8:29 AM (56, 37.6%) for males and 10:00 AM to 10:59 AM (34, 27.6%) for females.
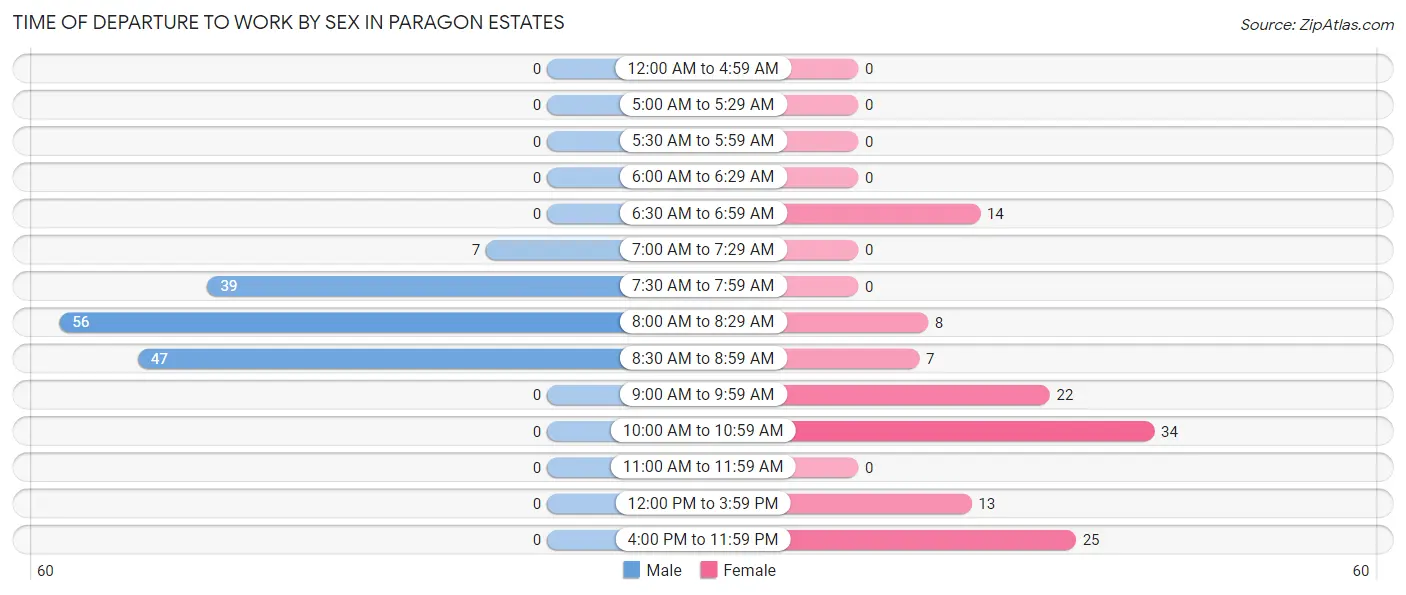
| Time of Departure | Male | Female |
| 12:00 AM to 4:59 AM | 0 (0.0%) | 0 (0.0%) |
| 5:00 AM to 5:29 AM | 0 (0.0%) | 0 (0.0%) |
| 5:30 AM to 5:59 AM | 0 (0.0%) | 0 (0.0%) |
| 6:00 AM to 6:29 AM | 0 (0.0%) | 0 (0.0%) |
| 6:30 AM to 6:59 AM | 0 (0.0%) | 14 (11.4%) |
| 7:00 AM to 7:29 AM | 7 (4.7%) | 0 (0.0%) |
| 7:30 AM to 7:59 AM | 39 (26.2%) | 0 (0.0%) |
| 8:00 AM to 8:29 AM | 56 (37.6%) | 8 (6.5%) |
| 8:30 AM to 8:59 AM | 47 (31.5%) | 7 (5.7%) |
| 9:00 AM to 9:59 AM | 0 (0.0%) | 22 (17.9%) |
| 10:00 AM to 10:59 AM | 0 (0.0%) | 34 (27.6%) |
| 11:00 AM to 11:59 AM | 0 (0.0%) | 0 (0.0%) |
| 12:00 PM to 3:59 PM | 0 (0.0%) | 13 (10.6%) |
| 4:00 PM to 11:59 PM | 0 (0.0%) | 25 (20.3%) |
| Total | 149 (100.0%) | 123 (100.0%) |
Housing Occupancy in Paragon Estates
Occupancy by Ownership in Paragon Estates
Of the total 356 dwellings in Paragon Estates, owner-occupied units account for 356 (100.0%), while renter-occupied units make up 0 (0.0%).
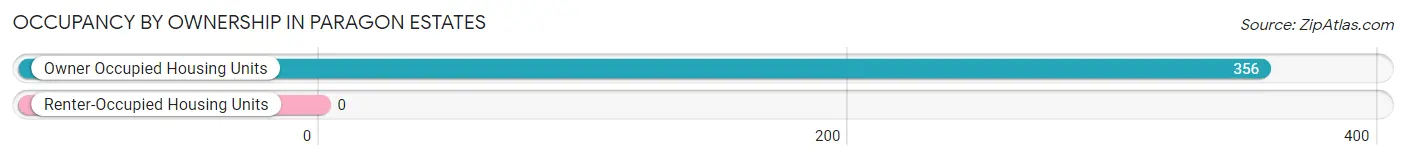
| Occupancy | # Housing Units | % Housing Units |
| Owner Occupied Housing Units | 356 | 100.0% |
| Renter-Occupied Housing Units | 0 | 0.0% |
| Total Occupied Housing Units | 356 | 100.0% |
Occupancy by Household Size in Paragon Estates
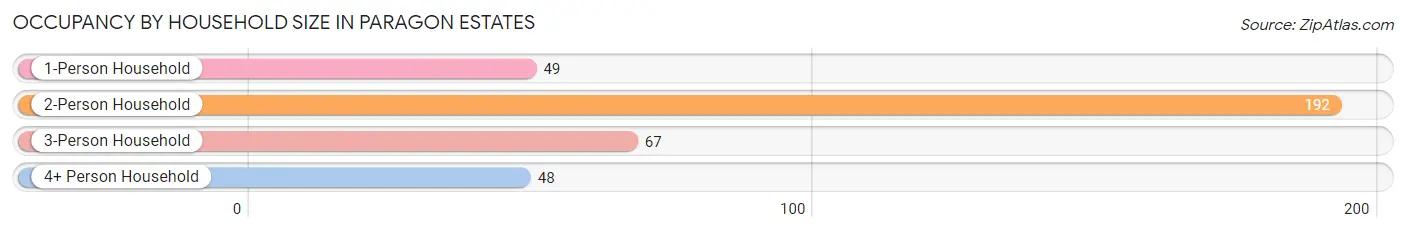
| Household Size | # Housing Units | % Housing Units |
| 1-Person Household | 49 | 13.8% |
| 2-Person Household | 192 | 53.9% |
| 3-Person Household | 67 | 18.8% |
| 4+ Person Household | 48 | 13.5% |
| Total Housing Units | 356 | 100.0% |
Occupancy by Ownership by Household Size in Paragon Estates
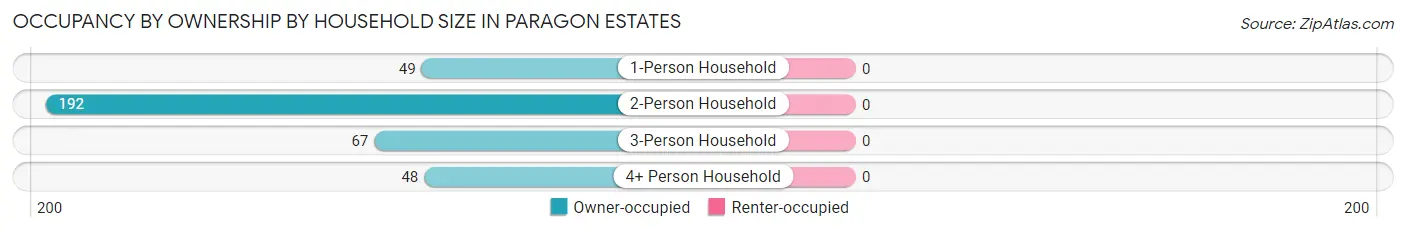
| Household Size | Owner-occupied | Renter-occupied |
| 1-Person Household | 49 (100.0%) | 0 (0.0%) |
| 2-Person Household | 192 (100.0%) | 0 (0.0%) |
| 3-Person Household | 67 (100.0%) | 0 (0.0%) |
| 4+ Person Household | 48 (100.0%) | 0 (0.0%) |
| Total Housing Units | 356 (100.0%) | 0 (0.0%) |
Occupancy by Educational Attainment in Paragon Estates
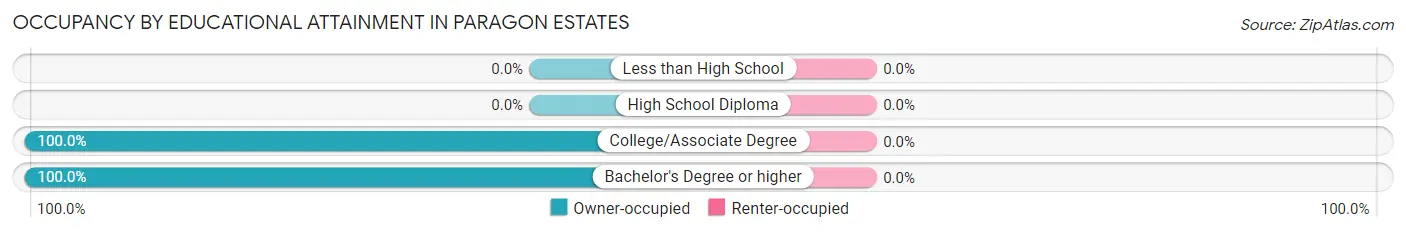
| Household Size | Owner-occupied | Renter-occupied |
| Less than High School | 0 (0.0%) | 0 (0.0%) |
| High School Diploma | 0 (0.0%) | 0 (0.0%) |
| College/Associate Degree | 17 (100.0%) | 0 (0.0%) |
| Bachelor's Degree or higher | 339 (100.0%) | 0 (0.0%) |
Occupancy by Age of Householder in Paragon Estates
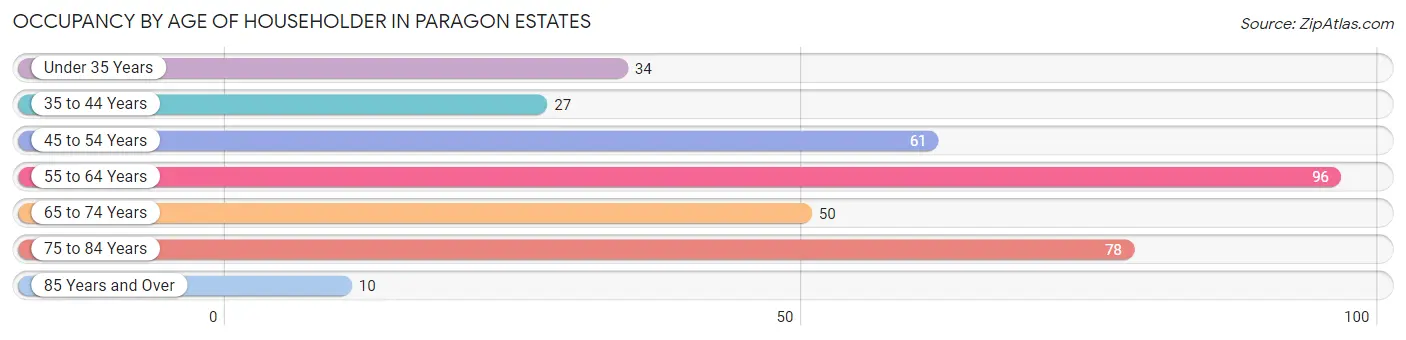
| Age Bracket | # Households | % Households |
| Under 35 Years | 34 | 9.6% |
| 35 to 44 Years | 27 | 7.6% |
| 45 to 54 Years | 61 | 17.1% |
| 55 to 64 Years | 96 | 27.0% |
| 65 to 74 Years | 50 | 14.0% |
| 75 to 84 Years | 78 | 21.9% |
| 85 Years and Over | 10 | 2.8% |
| Total | 356 | 100.0% |
Housing Finances in Paragon Estates
Median Income by Occupancy in Paragon Estates
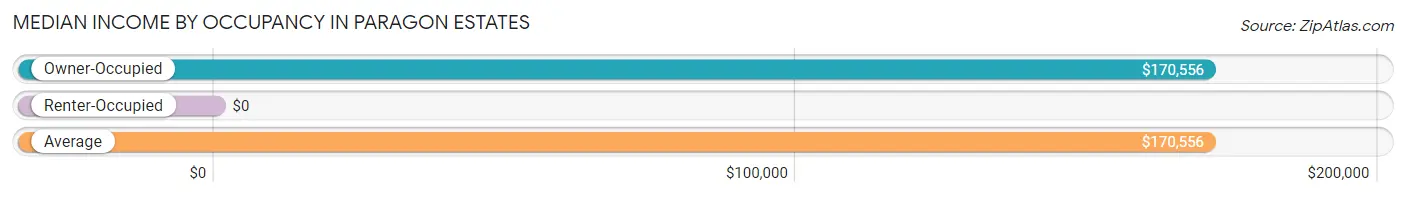
| Occupancy Type | # Households | Median Income |
| Owner-Occupied | 356 (100.0%) | $170,556 |
| Renter-Occupied | 0 (0.0%) | $0 |
| Average | 356 (100.0%) | $170,556 |
Occupancy by Householder Income Bracket in Paragon Estates
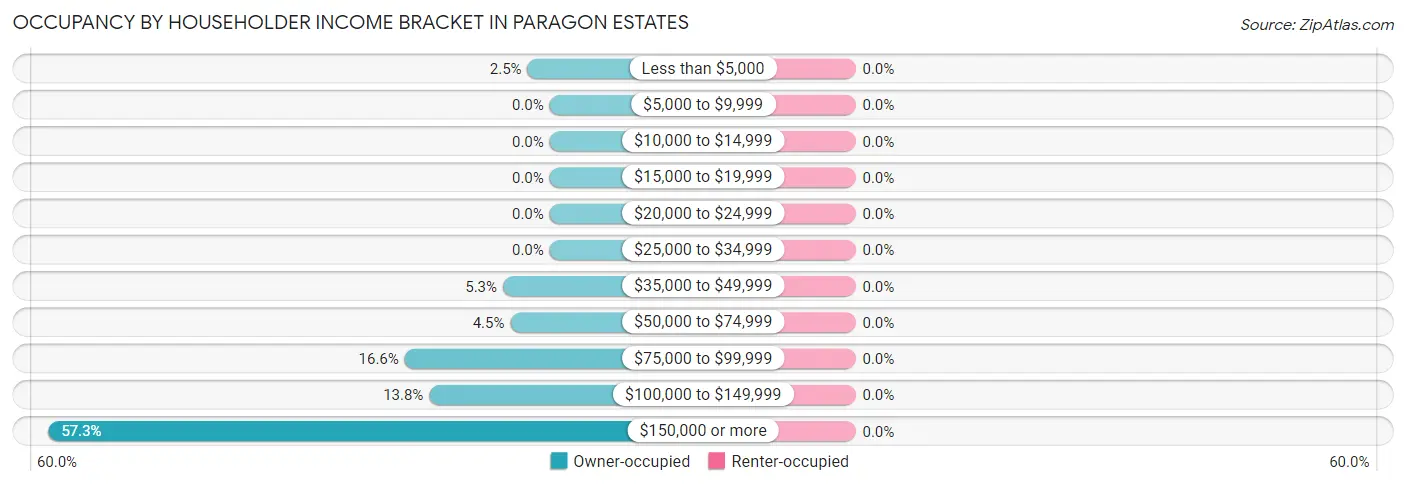
| Income Bracket | Owner-occupied | Renter-occupied |
| Less than $5,000 | 9 (2.5%) | 0 (0.0%) |
| $5,000 to $9,999 | 0 (0.0%) | 0 (0.0%) |
| $10,000 to $14,999 | 0 (0.0%) | 0 (0.0%) |
| $15,000 to $19,999 | 0 (0.0%) | 0 (0.0%) |
| $20,000 to $24,999 | 0 (0.0%) | 0 (0.0%) |
| $25,000 to $34,999 | 0 (0.0%) | 0 (0.0%) |
| $35,000 to $49,999 | 19 (5.3%) | 0 (0.0%) |
| $50,000 to $74,999 | 16 (4.5%) | 0 (0.0%) |
| $75,000 to $99,999 | 59 (16.6%) | 0 (0.0%) |
| $100,000 to $149,999 | 49 (13.8%) | 0 (0.0%) |
| $150,000 or more | 204 (57.3%) | 0 (0.0%) |
| Total | 356 (100.0%) | 0 (0.0%) |
Monthly Housing Cost Tiers in Paragon Estates
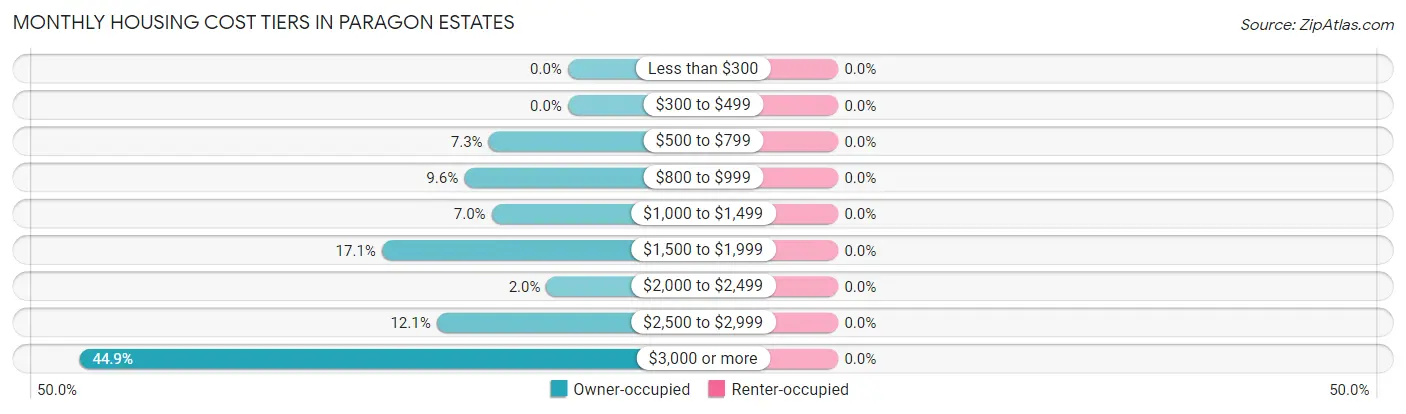
| Monthly Cost | Owner-occupied | Renter-occupied |
| Less than $300 | 0 (0.0%) | 0 (0.0%) |
| $300 to $499 | 0 (0.0%) | 0 (0.0%) |
| $500 to $799 | 26 (7.3%) | 0 (0.0%) |
| $800 to $999 | 34 (9.6%) | 0 (0.0%) |
| $1,000 to $1,499 | 25 (7.0%) | 0 (0.0%) |
| $1,500 to $1,999 | 61 (17.1%) | 0 (0.0%) |
| $2,000 to $2,499 | 7 (2.0%) | 0 (0.0%) |
| $2,500 to $2,999 | 43 (12.1%) | 0 (0.0%) |
| $3,000 or more | 160 (44.9%) | 0 (0.0%) |
| Total | 356 (100.0%) | 0 (0.0%) |
Physical Housing Characteristics in Paragon Estates
Housing Structures in Paragon Estates
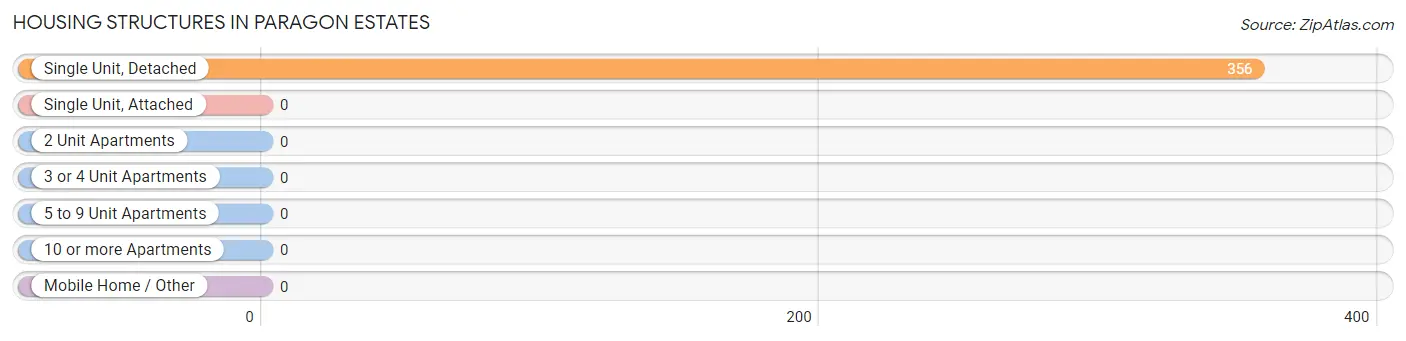
| Structure Type | # Housing Units | % Housing Units |
| Single Unit, Detached | 356 | 100.0% |
| Single Unit, Attached | 0 | 0.0% |
| 2 Unit Apartments | 0 | 0.0% |
| 3 or 4 Unit Apartments | 0 | 0.0% |
| 5 to 9 Unit Apartments | 0 | 0.0% |
| 10 or more Apartments | 0 | 0.0% |
| Mobile Home / Other | 0 | 0.0% |
| Total | 356 | 100.0% |
Housing Structures by Occupancy in Paragon Estates
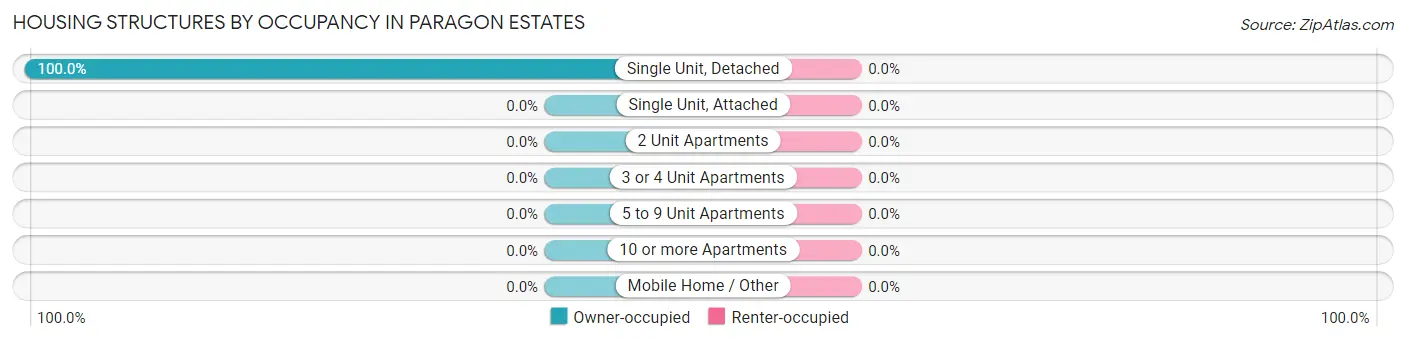
| Structure Type | Owner-occupied | Renter-occupied |
| Single Unit, Detached | 356 (100.0%) | 0 (0.0%) |
| Single Unit, Attached | 0 (0.0%) | 0 (0.0%) |
| 2 Unit Apartments | 0 (0.0%) | 0 (0.0%) |
| 3 or 4 Unit Apartments | 0 (0.0%) | 0 (0.0%) |
| 5 to 9 Unit Apartments | 0 (0.0%) | 0 (0.0%) |
| 10 or more Apartments | 0 (0.0%) | 0 (0.0%) |
| Mobile Home / Other | 0 (0.0%) | 0 (0.0%) |
| Total | 356 (100.0%) | 0 (0.0%) |
Housing Structures by Number of Rooms in Paragon Estates
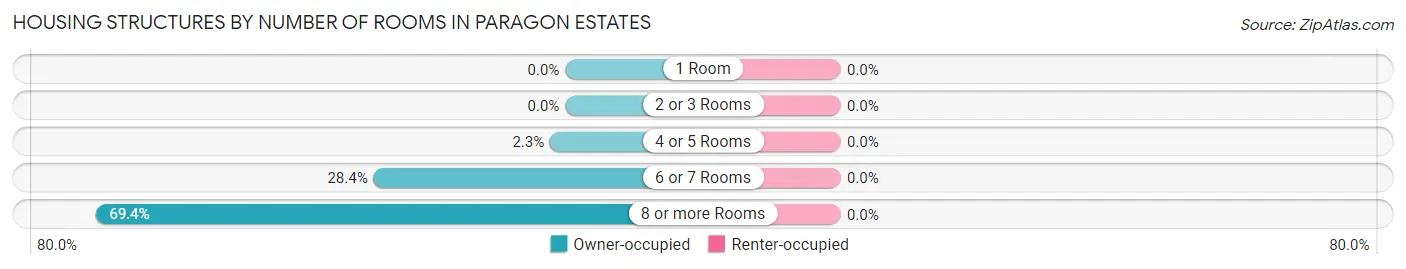
| Number of Rooms | Owner-occupied | Renter-occupied |
| 1 Room | 0 (0.0%) | 0 (0.0%) |
| 2 or 3 Rooms | 0 (0.0%) | 0 (0.0%) |
| 4 or 5 Rooms | 8 (2.2%) | 0 (0.0%) |
| 6 or 7 Rooms | 101 (28.4%) | 0 (0.0%) |
| 8 or more Rooms | 247 (69.4%) | 0 (0.0%) |
| Total | 356 (100.0%) | 0 (0.0%) |
Housing Structure by Heating Type in Paragon Estates
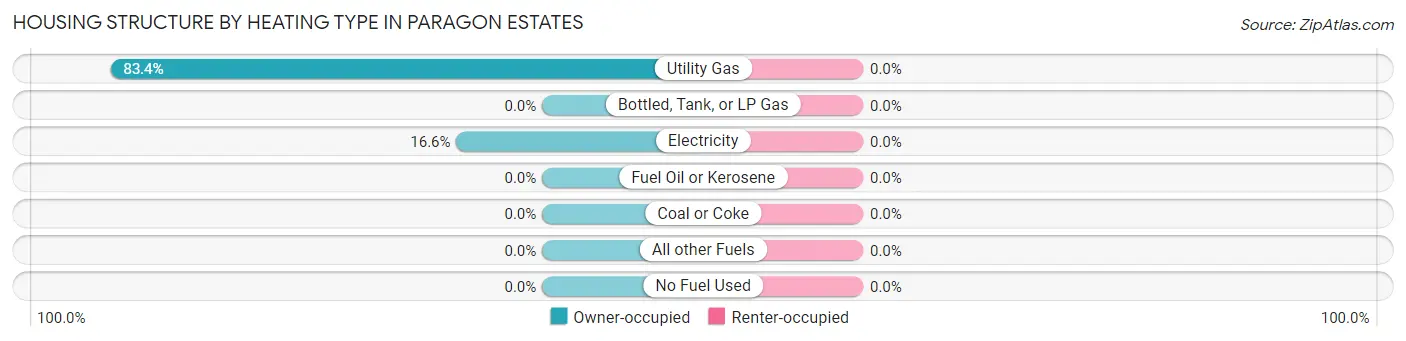
| Heating Type | Owner-occupied | Renter-occupied |
| Utility Gas | 297 (83.4%) | 0 (0.0%) |
| Bottled, Tank, or LP Gas | 0 (0.0%) | 0 (0.0%) |
| Electricity | 59 (16.6%) | 0 (0.0%) |
| Fuel Oil or Kerosene | 0 (0.0%) | 0 (0.0%) |
| Coal or Coke | 0 (0.0%) | 0 (0.0%) |
| All other Fuels | 0 (0.0%) | 0 (0.0%) |
| No Fuel Used | 0 (0.0%) | 0 (0.0%) |
| Total | 356 (100.0%) | 0 (0.0%) |
Household Vehicle Usage in Paragon Estates
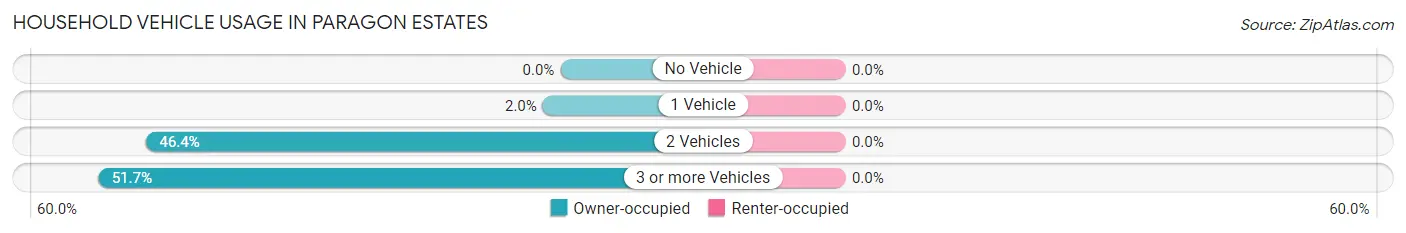
| Vehicles per Household | Owner-occupied | Renter-occupied |
| No Vehicle | 0 (0.0%) | 0 (0.0%) |
| 1 Vehicle | 7 (2.0%) | 0 (0.0%) |
| 2 Vehicles | 165 (46.4%) | 0 (0.0%) |
| 3 or more Vehicles | 184 (51.7%) | 0 (0.0%) |
| Total | 356 (100.0%) | 0 (0.0%) |
Real Estate & Mortgages in Paragon Estates
Real Estate and Mortgage Overview in Paragon Estates
| Characteristic | Without Mortgage | With Mortgage |
| Housing Units | 164 | 192 |
| Median Property Value | $1,825,800 | $1,416,700 |
| Median Household Income | $132,083 | $134 |
| Monthly Housing Costs | $1,373 | $160 |
| Real Estate Taxes | $9,464 | $0 |
Property Value by Mortgage Status in Paragon Estates
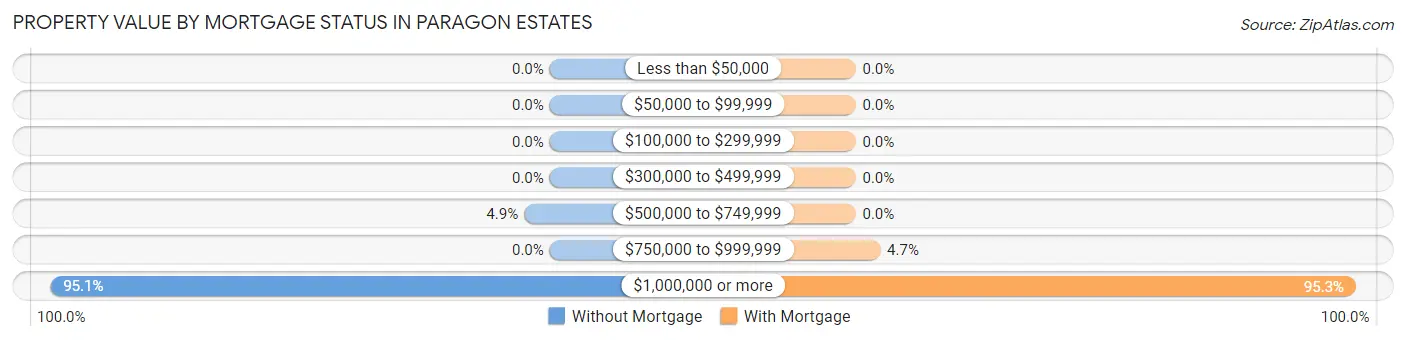
| Property Value | Without Mortgage | With Mortgage |
| Less than $50,000 | 0 (0.0%) | 0 (0.0%) |
| $50,000 to $99,999 | 0 (0.0%) | 0 (0.0%) |
| $100,000 to $299,999 | 0 (0.0%) | 0 (0.0%) |
| $300,000 to $499,999 | 0 (0.0%) | 0 (0.0%) |
| $500,000 to $749,999 | 8 (4.9%) | 0 (0.0%) |
| $750,000 to $999,999 | 0 (0.0%) | 9 (4.7%) |
| $1,000,000 or more | 156 (95.1%) | 183 (95.3%) |
| Total | 164 (100.0%) | 192 (100.0%) |
Household Income by Mortgage Status in Paragon Estates
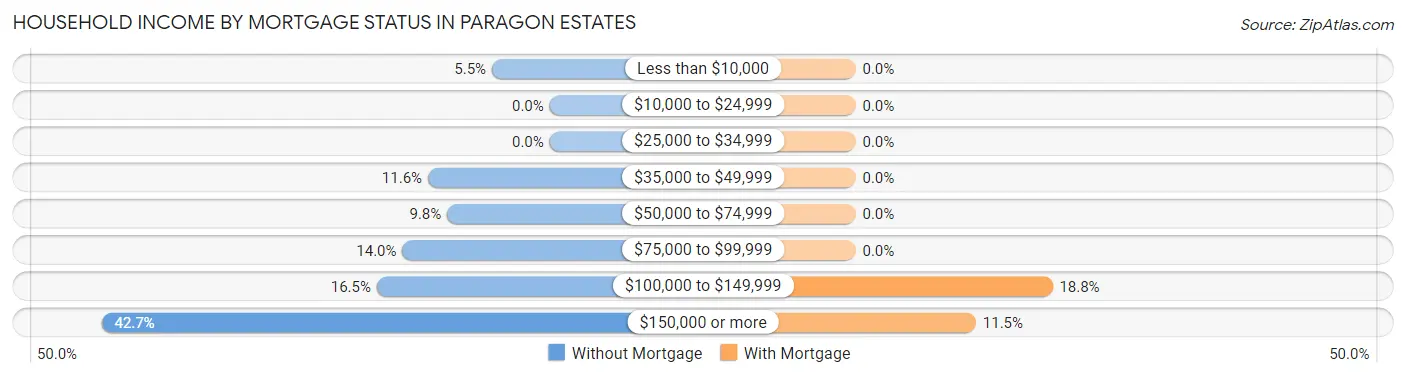
| Household Income | Without Mortgage | With Mortgage |
| Less than $10,000 | 9 (5.5%) | 0 (0.0%) |
| $10,000 to $24,999 | 0 (0.0%) | 0 (0.0%) |
| $25,000 to $34,999 | 0 (0.0%) | 0 (0.0%) |
| $35,000 to $49,999 | 19 (11.6%) | 0 (0.0%) |
| $50,000 to $74,999 | 16 (9.8%) | 0 (0.0%) |
| $75,000 to $99,999 | 23 (14.0%) | 0 (0.0%) |
| $100,000 to $149,999 | 27 (16.5%) | 36 (18.8%) |
| $150,000 or more | 70 (42.7%) | 22 (11.5%) |
| Total | 164 (100.0%) | 192 (100.0%) |
Property Value to Household Income Ratio in Paragon Estates
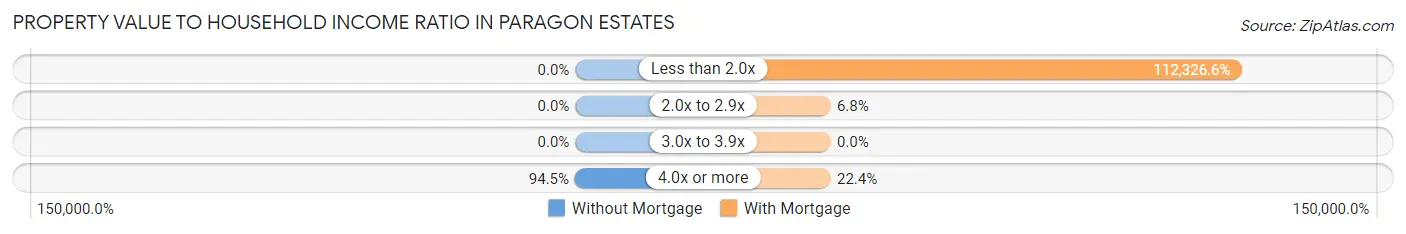
| Value-to-Income Ratio | Without Mortgage | With Mortgage |
| Less than 2.0x | 0 (0.0%) | 215,667 (112,326.6%) |
| 2.0x to 2.9x | 0 (0.0%) | 13 (6.8%) |
| 3.0x to 3.9x | 0 (0.0%) | 0 (0.0%) |
| 4.0x or more | 155 (94.5%) | 43 (22.4%) |
| Total | 164 (100.0%) | 192 (100.0%) |
Real Estate Taxes by Mortgage Status in Paragon Estates
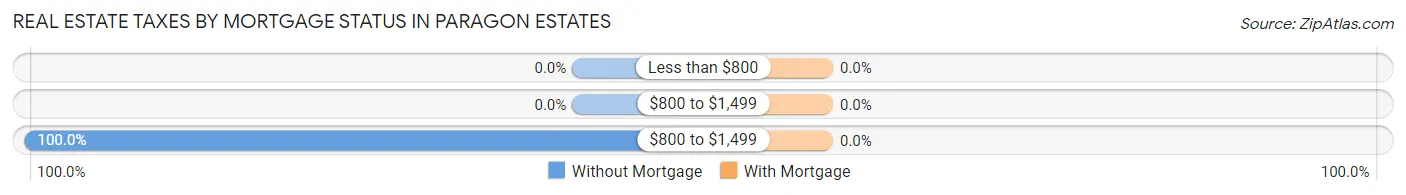
| Property Taxes | Without Mortgage | With Mortgage |
| Less than $800 | 0 (0.0%) | 0 (0.0%) |
| $800 to $1,499 | 0 (0.0%) | 0 (0.0%) |
| $800 to $1,499 | 164 (100.0%) | 0 (0.0%) |
| Total | 164 (100.0%) | 192 (100.0%) |
Health & Disability in Paragon Estates
Health Insurance Coverage by Age in Paragon Estates
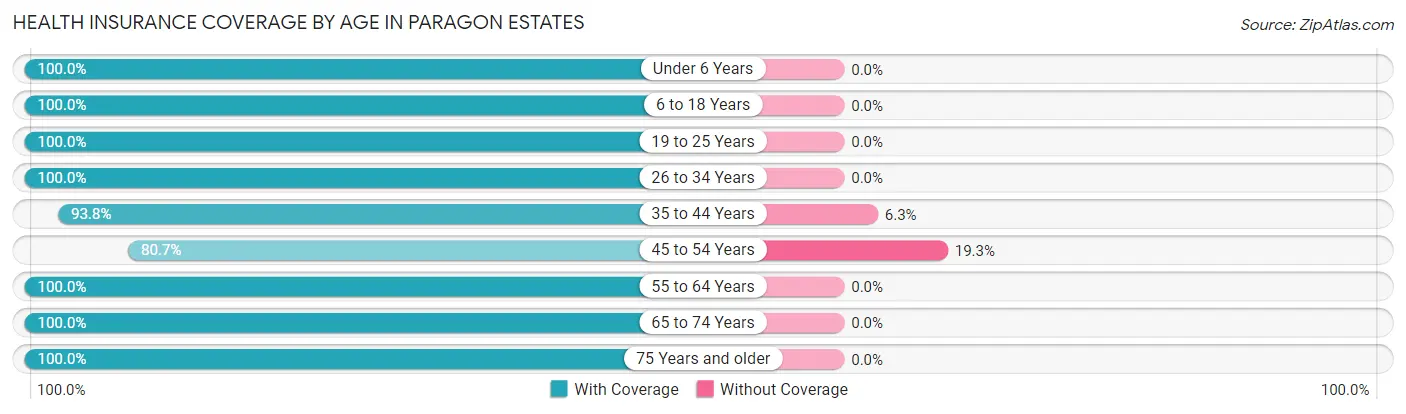
| Age Bracket | With Coverage | Without Coverage |
| Under 6 Years | 49 (100.0%) | 0 (0.0%) |
| 6 to 18 Years | 59 (100.0%) | 0 (0.0%) |
| 19 to 25 Years | 52 (100.0%) | 0 (0.0%) |
| 26 to 34 Years | 34 (100.0%) | 0 (0.0%) |
| 35 to 44 Years | 75 (93.8%) | 5 (6.2%) |
| 45 to 54 Years | 138 (80.7%) | 33 (19.3%) |
| 55 to 64 Years | 175 (100.0%) | 0 (0.0%) |
| 65 to 74 Years | 97 (100.0%) | 0 (0.0%) |
| 75 Years and older | 140 (100.0%) | 0 (0.0%) |
| Total | 819 (95.6%) | 38 (4.4%) |
Health Insurance Coverage by Citizenship Status in Paragon Estates
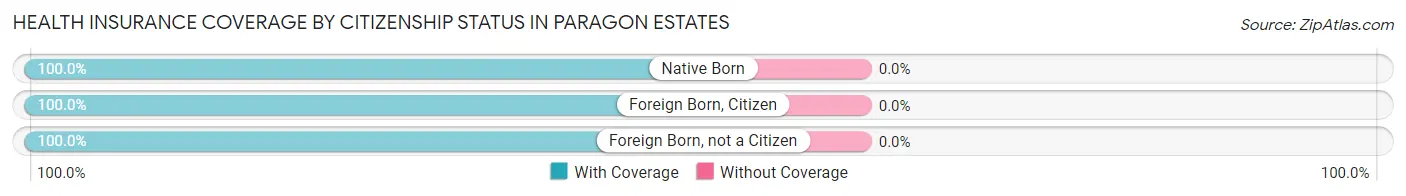
| Citizenship Status | With Coverage | Without Coverage |
| Native Born | 49 (100.0%) | 0 (0.0%) |
| Foreign Born, Citizen | 59 (100.0%) | 0 (0.0%) |
| Foreign Born, not a Citizen | 52 (100.0%) | 0 (0.0%) |
Health Insurance Coverage by Household Income in Paragon Estates
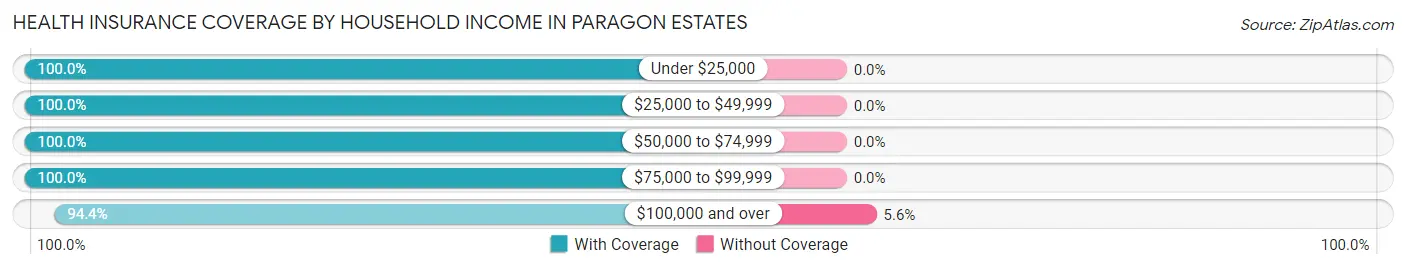
| Household Income | With Coverage | Without Coverage |
| Under $25,000 | 18 (100.0%) | 0 (0.0%) |
| $25,000 to $49,999 | 37 (100.0%) | 0 (0.0%) |
| $50,000 to $74,999 | 25 (100.0%) | 0 (0.0%) |
| $75,000 to $99,999 | 96 (100.0%) | 0 (0.0%) |
| $100,000 and over | 643 (94.4%) | 38 (5.6%) |
Public vs Private Health Insurance Coverage by Age in Paragon Estates
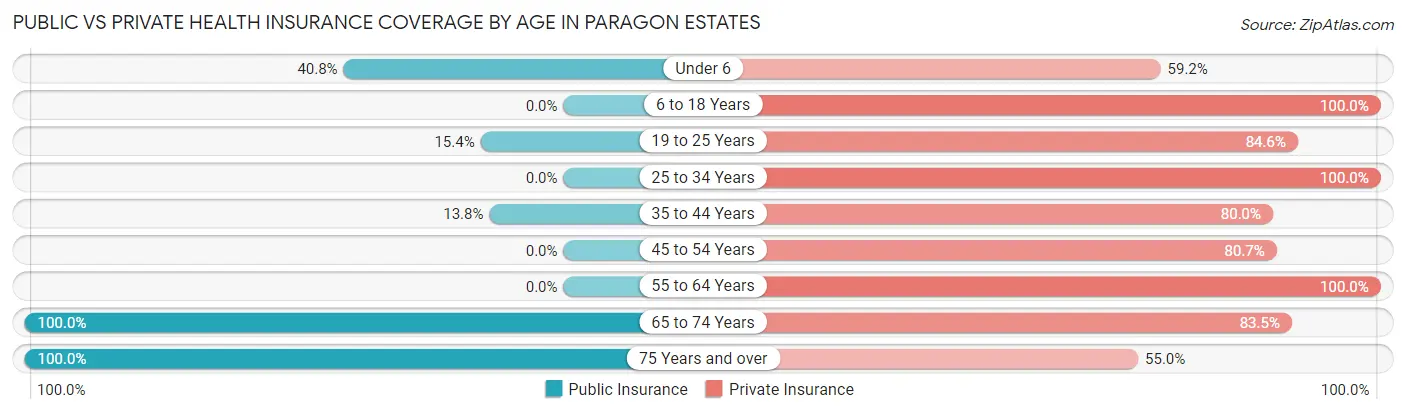
| Age Bracket | Public Insurance | Private Insurance |
| Under 6 | 20 (40.8%) | 29 (59.2%) |
| 6 to 18 Years | 0 (0.0%) | 59 (100.0%) |
| 19 to 25 Years | 8 (15.4%) | 44 (84.6%) |
| 25 to 34 Years | 0 (0.0%) | 34 (100.0%) |
| 35 to 44 Years | 11 (13.8%) | 64 (80.0%) |
| 45 to 54 Years | 0 (0.0%) | 138 (80.7%) |
| 55 to 64 Years | 0 (0.0%) | 175 (100.0%) |
| 65 to 74 Years | 97 (100.0%) | 81 (83.5%) |
| 75 Years and over | 140 (100.0%) | 77 (55.0%) |
| Total | 276 (32.2%) | 701 (81.8%) |
Disability Status by Sex by Age in Paragon Estates
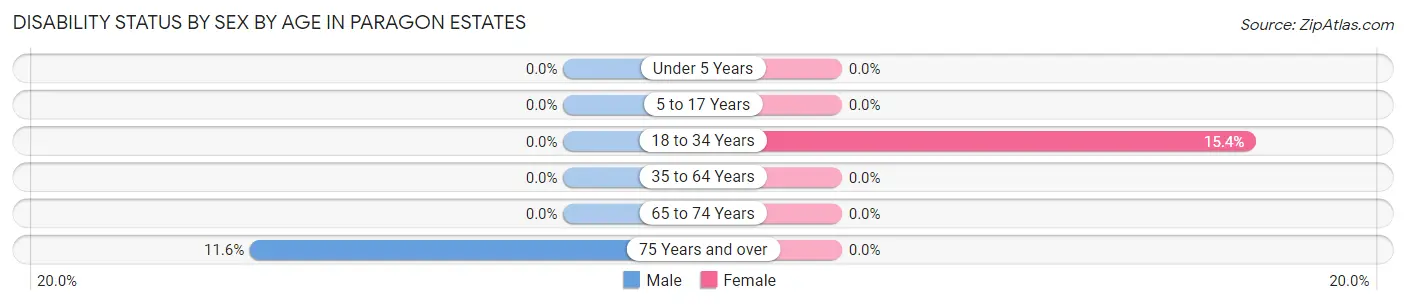
| Age Bracket | Male | Female |
| Under 5 Years | 0 (0.0%) | 0 (0.0%) |
| 5 to 17 Years | 0 (0.0%) | 0 (0.0%) |
| 18 to 34 Years | 0 (0.0%) | 8 (15.4%) |
| 35 to 64 Years | 0 (0.0%) | 0 (0.0%) |
| 65 to 74 Years | 0 (0.0%) | 0 (0.0%) |
| 75 Years and over | 10 (11.6%) | 0 (0.0%) |
Disability Class by Sex by Age in Paragon Estates
Disability Class: Hearing Difficulty
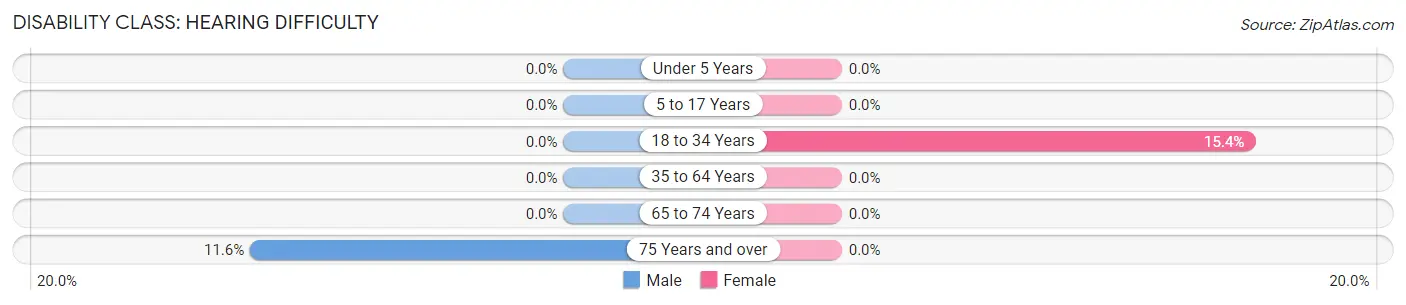
| Age Bracket | Male | Female |
| Under 5 Years | 0 (0.0%) | 0 (0.0%) |
| 5 to 17 Years | 0 (0.0%) | 0 (0.0%) |
| 18 to 34 Years | 0 (0.0%) | 8 (15.4%) |
| 35 to 64 Years | 0 (0.0%) | 0 (0.0%) |
| 65 to 74 Years | 0 (0.0%) | 0 (0.0%) |
| 75 Years and over | 10 (11.6%) | 0 (0.0%) |
Disability Class: Vision Difficulty
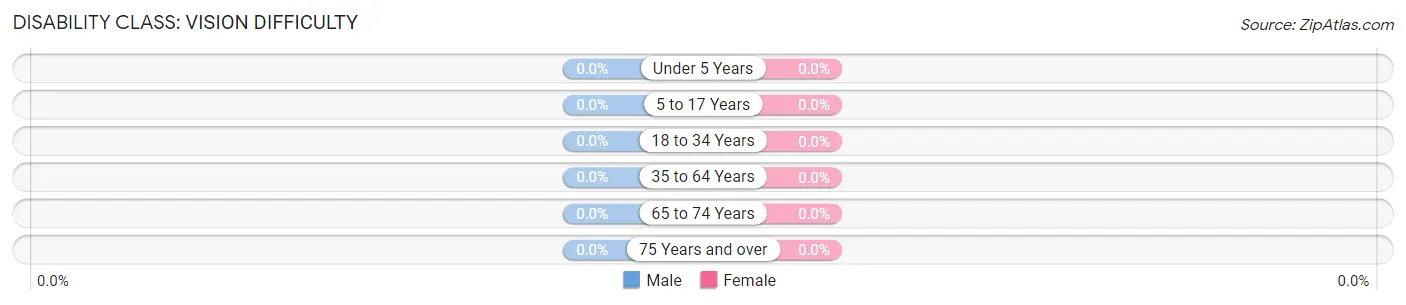
| Age Bracket | Male | Female |
| Under 5 Years | 0 (0.0%) | 0 (0.0%) |
| 5 to 17 Years | 0 (0.0%) | 0 (0.0%) |
| 18 to 34 Years | 0 (0.0%) | 0 (0.0%) |
| 35 to 64 Years | 0 (0.0%) | 0 (0.0%) |
| 65 to 74 Years | 0 (0.0%) | 0 (0.0%) |
| 75 Years and over | 0 (0.0%) | 0 (0.0%) |
Disability Class: Cognitive Difficulty
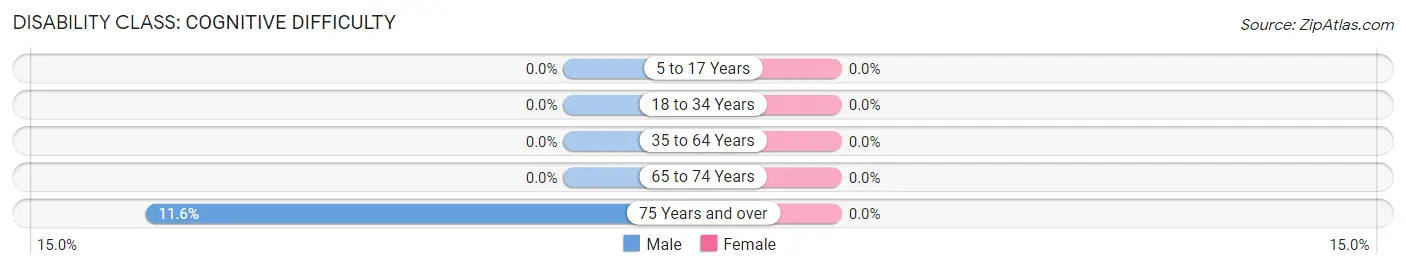
| Age Bracket | Male | Female |
| 5 to 17 Years | 0 (0.0%) | 0 (0.0%) |
| 18 to 34 Years | 0 (0.0%) | 0 (0.0%) |
| 35 to 64 Years | 0 (0.0%) | 0 (0.0%) |
| 65 to 74 Years | 0 (0.0%) | 0 (0.0%) |
| 75 Years and over | 10 (11.6%) | 0 (0.0%) |
Disability Class: Ambulatory Difficulty
| Age Bracket | Male | Female |
| 5 to 17 Years | 0 (0.0%) | 0 (0.0%) |
| 18 to 34 Years | 0 (0.0%) | 0 (0.0%) |
| 35 to 64 Years | 0 (0.0%) | 0 (0.0%) |
| 65 to 74 Years | 0 (0.0%) | 0 (0.0%) |
| 75 Years and over | 0 (0.0%) | 0 (0.0%) |
Disability Class: Self-Care Difficulty
| Age Bracket | Male | Female |
| 5 to 17 Years | 0 (0.0%) | 0 (0.0%) |
| 18 to 34 Years | 0 (0.0%) | 0 (0.0%) |
| 35 to 64 Years | 0 (0.0%) | 0 (0.0%) |
| 65 to 74 Years | 0 (0.0%) | 0 (0.0%) |
| 75 Years and over | 0 (0.0%) | 0 (0.0%) |
Technology Access in Paragon Estates
Computing Device Access in Paragon Estates
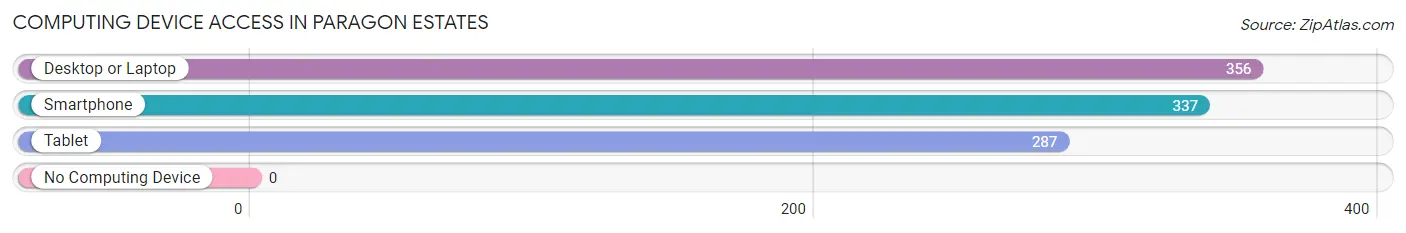
| Device Type | # Households | % Households |
| Desktop or Laptop | 356 | 100.0% |
| Smartphone | 337 | 94.7% |
| Tablet | 287 | 80.6% |
| No Computing Device | 0 | 0.0% |
| Total | 356 | 100.0% |
Internet Access in Paragon Estates
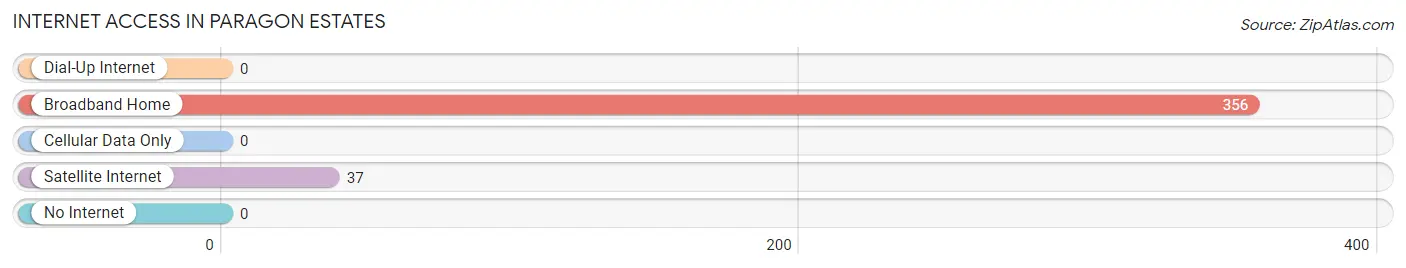
| Internet Type | # Households | % Households |
| Dial-Up Internet | 0 | 0.0% |
| Broadband Home | 356 | 100.0% |
| Cellular Data Only | 0 | 0.0% |
| Satellite Internet | 37 | 10.4% |
| No Internet | 0 | 0.0% |
| Total | 356 | 100.0% |
Paragon Estates Summary
Paragon Estates is a small town located in the state of Colorado, United States. It is situated in the foothills of the Rocky Mountains, approximately 30 miles north of Denver. The town has a population of approximately 1,500 people and is known for its rural charm and scenic beauty.
History
Paragon Estates was founded in 1876 by a group of settlers from the Midwest. The town was originally called Paragon City, but the name was changed to Paragon Estates in 1883. The town was founded as a farming community and was known for its abundance of natural resources. The town was also home to a number of small businesses, including a general store, a blacksmith, and a post office.
In the early 1900s, the town began to experience a period of growth and prosperity. The population increased and the town began to attract more businesses. In the 1920s, the town was home to a number of small factories, including a flour mill, a sawmill, and a brickyard.
Geography
Paragon Estates is located in the foothills of the Rocky Mountains, approximately 30 miles north of Denver. The town is situated at an elevation of 6,000 feet above sea level. The town is surrounded by rolling hills and is home to a number of small lakes and streams. The town is also home to a number of parks and recreational areas, including the Paragon Estates State Park.
Economy
Paragon Estates is a small town with a limited economy. The town is home to a number of small businesses, including a general store, a post office, and a few restaurants. The town is also home to a number of small manufacturing businesses, including a flour mill, a sawmill, and a brickyard.
The town is also home to a number of small farms, which produce a variety of crops, including corn, wheat, and hay. The town is also home to a number of small ranches, which raise cattle and horses.
Demographics
As of the 2010 census, the population of Paragon Estates was 1,500. The town is predominantly white, with approximately 95% of the population being of European descent. The town is also home to a small Hispanic population, with approximately 5% of the population being of Hispanic or Latino origin. The town is also home to a small Native American population, with approximately 1% of the population being of Native American descent.
The median household income in Paragon Estates is approximately $50,000 per year. The town has a low unemployment rate, with approximately 3% of the population being unemployed. The town also has a low poverty rate, with approximately 5% of the population living below the poverty line.
Common Questions
What is the Total Population of Paragon Estates?
Total Population of Paragon Estates is 857.
What is the Total Male Population of Paragon Estates?
Total Male Population of Paragon Estates is 448.
What is the Total Female Population of Paragon Estates?
Total Female Population of Paragon Estates is 409.
What is the Ratio of Males per 100 Females in Paragon Estates?
There are 109.54 Males per 100 Females in Paragon Estates.
What is the Ratio of Females per 100 Males in Paragon Estates?
There are 91.29 Females per 100 Males in Paragon Estates.
What is the Median Population Age in Paragon Estates?
Median Population Age in Paragon Estates is 54.4 Years.
What is the Average Family Size in Paragon Estates
Average Family Size in Paragon Estates is 2.6 People.
What is the Average Household Size in Paragon Estates
Average Household Size in Paragon Estates is 2.4 People.
What is Per Capita Income in Paragon Estates?
Per Capita income in Paragon Estates is $102,687.
What is the Median Family Income in Paragon Estates?
Median Family Income in Paragon Estates is $216,333.
What is the Median Household income in Paragon Estates?
Median Household Income in Paragon Estates is $170,556.
What is Income or Wage Gap in Paragon Estates?
Income or Wage Gap in Paragon Estates is 31.4%.
Women in Paragon Estates earn 68.6 cents for every dollar earned by a man.
What is Inequality or Gini Index in Paragon Estates?
Inequality or Gini Index in Paragon Estates is 0.44.
How Large is the Labor Force in Paragon Estates?
There are 396 People in the Labor Forcein in Paragon Estates.
What is the Percentage of People in the Labor Force in Paragon Estates?
51.5% of People are in the Labor Force in Paragon Estates.