Elizabeth, CO
Elizabeth Map
Elizabeth Overview
1,830
TOTAL POPULATION
883
MALE POPULATION
947
FEMALE POPULATION
93.24
MALES / 100 FEMALES
107.25
FEMALES / 100 MALES
32.2
MEDIAN AGE
2.9
AVG FAMILY SIZE
2.6
AVG HOUSEHOLD SIZE
$39,534
PER CAPITA INCOME
$106,827
AVG FAMILY INCOME
$99,889
AVG HOUSEHOLD INCOME
14.2%
WAGE / INCOME GAP [ % ]
85.8¢/ $1
WAGE / INCOME GAP [ $ ]
$16,560
FAMILY INCOME DEFICIT
0.27
INEQUALITY / GINI INDEX
1,046
LABOR FORCE [ PEOPLE ]
70.5%
PERCENT IN LABOR FORCE
3.0%
UNEMPLOYMENT RATE
Elizabeth Zip Codes
Elizabeth Area Codes
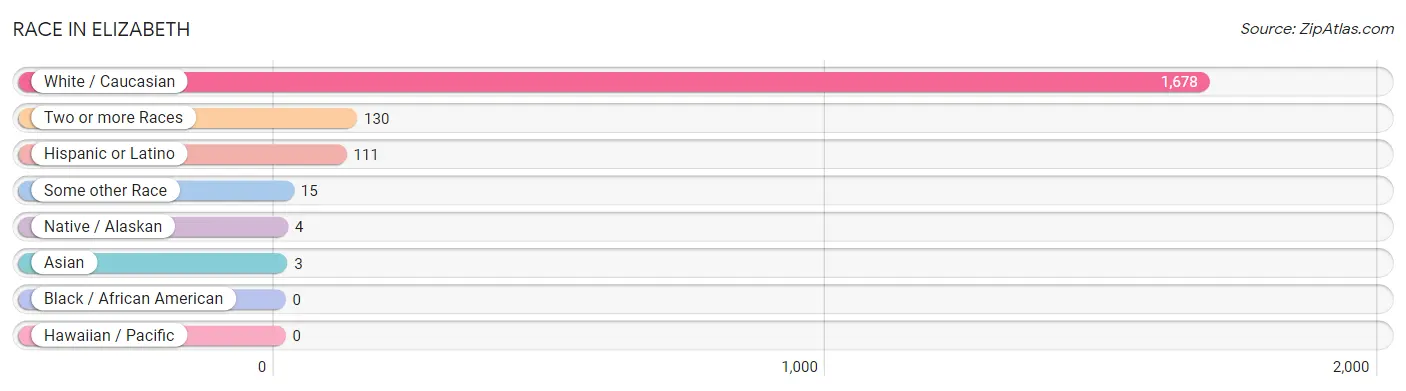
Race in Elizabeth
The most populous races in Elizabeth are White / Caucasian (1,678 | 91.7%), Two or more Races (130 | 7.1%), and Hispanic or Latino (111 | 6.1%).
| Race | # Population | % Population |
| Asian | 3 | 0.2% |
| Black / African American | 0 | 0.0% |
| Hawaiian / Pacific | 0 | 0.0% |
| Hispanic or Latino | 111 | 6.1% |
| Native / Alaskan | 4 | 0.2% |
| White / Caucasian | 1,678 | 91.7% |
| Two or more Races | 130 | 7.1% |
| Some other Race | 15 | 0.8% |
| Total | 1,830 | 100.0% |
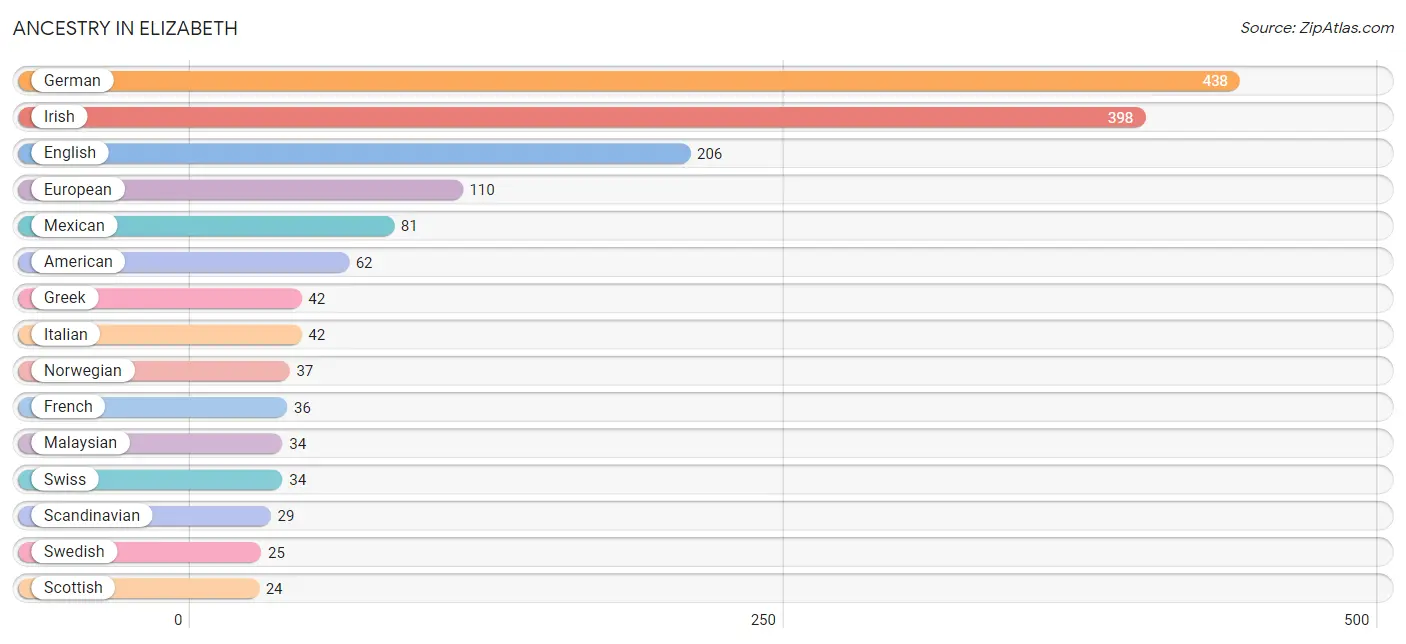
Ancestry in Elizabeth
The most populous ancestries reported in Elizabeth are German (438 | 23.9%), Irish (398 | 21.7%), English (206 | 11.3%), European (110 | 6.0%), and Mexican (81 | 4.4%), together accounting for 67.4% of all Elizabeth residents.
| Ancestry | # Population | % Population |
| American | 62 | 3.4% |
| Apache | 10 | 0.5% |
| Austrian | 2 | 0.1% |
| Bhutanese | 3 | 0.2% |
| British | 8 | 0.4% |
| Cajun | 2 | 0.1% |
| Celtic | 5 | 0.3% |
| Central American | 3 | 0.2% |
| Cherokee | 20 | 1.1% |
| Cuban | 10 | 0.5% |
| Czechoslovakian | 11 | 0.6% |
| Danish | 18 | 1.0% |
| English | 206 | 11.3% |
| European | 110 | 6.0% |
| Finnish | 6 | 0.3% |
| French | 36 | 2.0% |
| French Canadian | 10 | 0.5% |
| German | 438 | 23.9% |
| Greek | 42 | 2.3% |
| Guamanian / Chamorro | 18 | 1.0% |
| Guatemalan | 3 | 0.2% |
| Irish | 398 | 21.7% |
| Italian | 42 | 2.3% |
| Korean | 3 | 0.2% |
| Malaysian | 34 | 1.9% |
| Mexican | 81 | 4.4% |
| Mexican American Indian | 10 | 0.5% |
| Norwegian | 37 | 2.0% |
| Polish | 3 | 0.2% |
| Puerto Rican | 3 | 0.2% |
| Scandinavian | 29 | 1.6% |
| Scotch-Irish | 7 | 0.4% |
| Scottish | 24 | 1.3% |
| Serbian | 4 | 0.2% |
| Spanish | 14 | 0.8% |
| Swedish | 25 | 1.4% |
| Swiss | 34 | 1.9% |
| Welsh | 18 | 1.0% | View All 38 Rows |
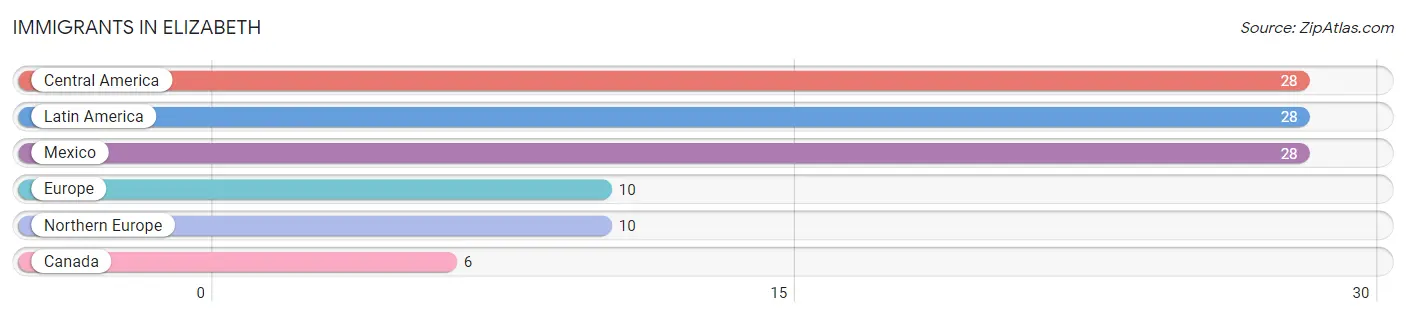
Immigrants in Elizabeth
The most numerous immigrant groups reported in Elizabeth came from Central America (28 | 1.5%), Latin America (28 | 1.5%), Mexico (28 | 1.5%), Europe (10 | 0.5%), and Northern Europe (10 | 0.5%), together accounting for 5.7% of all Elizabeth residents.
| Immigration Origin | # Population | % Population |
| Canada | 6 | 0.3% |
| Central America | 28 | 1.5% |
| Europe | 10 | 0.5% |
| Latin America | 28 | 1.5% |
| Mexico | 28 | 1.5% |
| Northern Europe | 10 | 0.5% | View All 6 Rows |
Sex and Age in Elizabeth
Sex and Age in Elizabeth
The most populous age groups in Elizabeth are 30 to 34 Years (159 | 18.0%) for men and 30 to 34 Years (131 | 13.8%) for women.
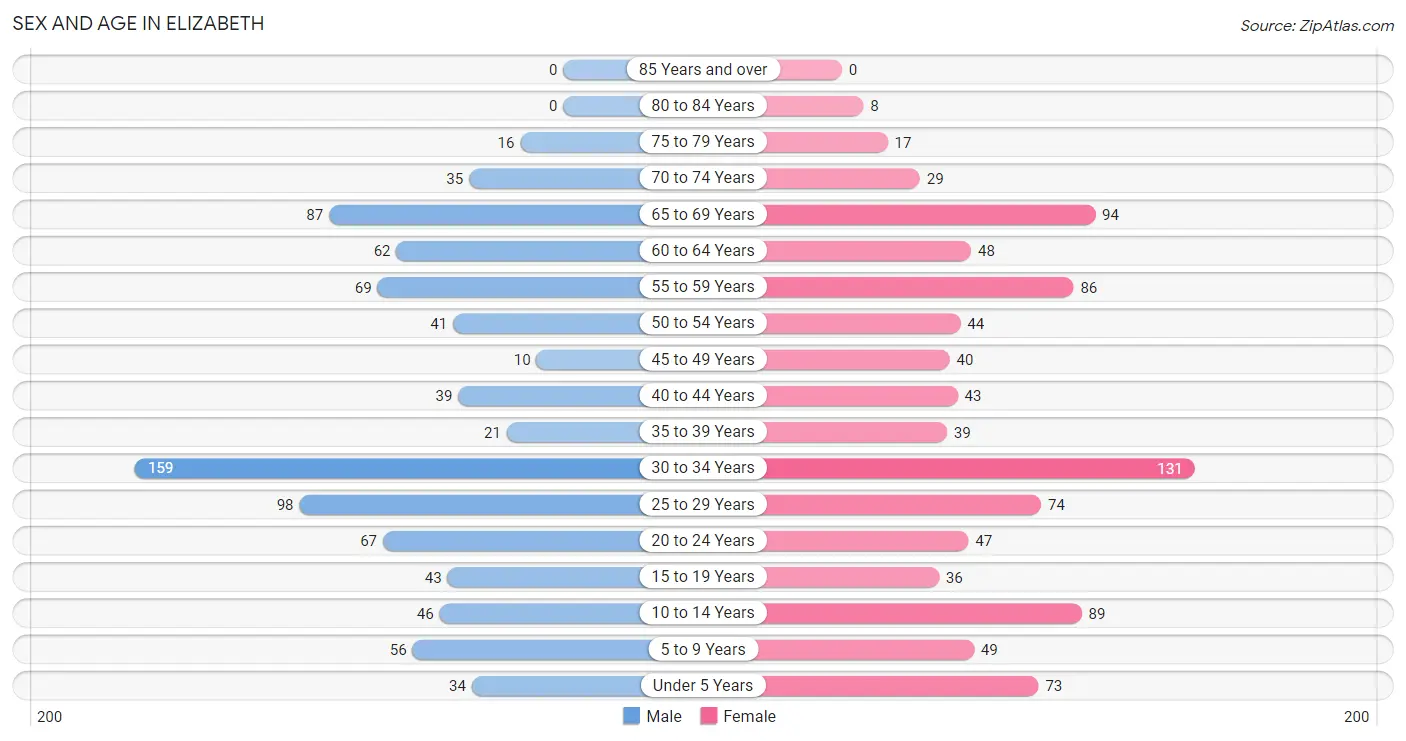
| Age Bracket | Male | Female |
| Under 5 Years | 34 (3.8%) | 73 (7.7%) |
| 5 to 9 Years | 56 (6.3%) | 49 (5.2%) |
| 10 to 14 Years | 46 (5.2%) | 89 (9.4%) |
| 15 to 19 Years | 43 (4.9%) | 36 (3.8%) |
| 20 to 24 Years | 67 (7.6%) | 47 (5.0%) |
| 25 to 29 Years | 98 (11.1%) | 74 (7.8%) |
| 30 to 34 Years | 159 (18.0%) | 131 (13.8%) |
| 35 to 39 Years | 21 (2.4%) | 39 (4.1%) |
| 40 to 44 Years | 39 (4.4%) | 43 (4.5%) |
| 45 to 49 Years | 10 (1.1%) | 40 (4.2%) |
| 50 to 54 Years | 41 (4.6%) | 44 (4.6%) |
| 55 to 59 Years | 69 (7.8%) | 86 (9.1%) |
| 60 to 64 Years | 62 (7.0%) | 48 (5.1%) |
| 65 to 69 Years | 87 (9.9%) | 94 (9.9%) |
| 70 to 74 Years | 35 (4.0%) | 29 (3.1%) |
| 75 to 79 Years | 16 (1.8%) | 17 (1.8%) |
| 80 to 84 Years | 0 (0.0%) | 8 (0.8%) |
| 85 Years and over | 0 (0.0%) | 0 (0.0%) |
| Total | 883 (100.0%) | 947 (100.0%) |
Families and Households in Elizabeth
Median Family Size in Elizabeth
The median family size in Elizabeth is 2.94 persons per family, with married-couple families (480 | 86.2%) accounting for the largest median family size of 3.07 persons per family. On the other hand, single female/mother families (23 | 4.1%) represent the smallest median family size with 2.04 persons per family.
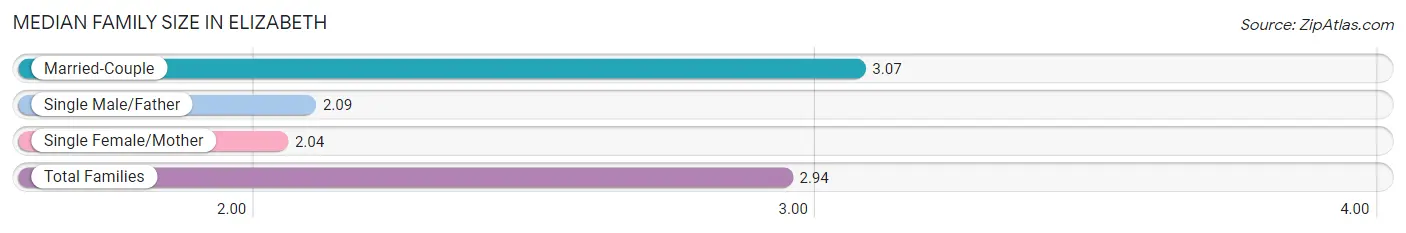
| Family Type | # Families | Family Size |
| Married-Couple | 480 (86.2%) | 3.07 |
| Single Male/Father | 54 (9.7%) | 2.09 |
| Single Female/Mother | 23 (4.1%) | 2.04 |
| Total Families | 557 (100.0%) | 2.94 |
Median Household Size in Elizabeth
The median household size in Elizabeth is 2.64 persons per household, with married-couple households (480 | 69.4%) accounting for the largest median household size of 3.07 persons per household. non-family households (135 | 19.5%) represent the smallest median household size with 1.42 persons per household.
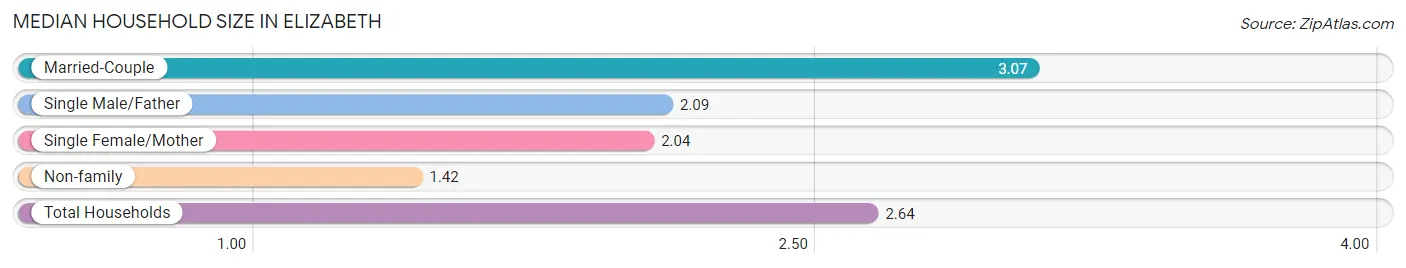
| Household Type | # Households | Household Size |
| Married-Couple | 480 (69.4%) | 3.07 |
| Single Male/Father | 54 (7.8%) | 2.09 |
| Single Female/Mother | 23 (3.3%) | 2.04 |
| Non-family | 135 (19.5%) | 1.42 |
| Total Households | 692 (100.0%) | 2.64 |
Household Size by Marriage Status in Elizabeth
Out of a total of 692 households in Elizabeth, 557 (80.5%) are family households, while 135 (19.5%) are nonfamily households. The most numerous type of family households are 2-person households, comprising 341, and the most common type of nonfamily households are 2-person households, comprising 73.
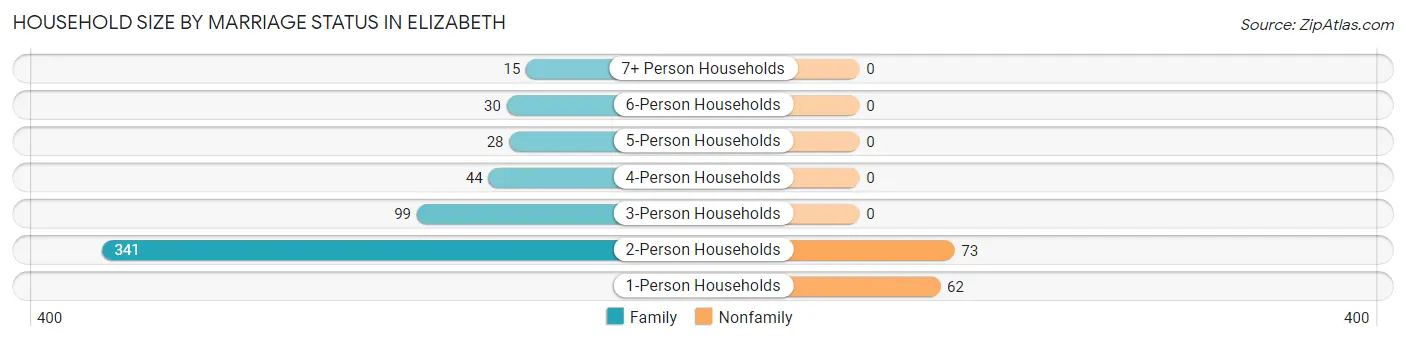
| Household Size | Family Households | Nonfamily Households |
| 1-Person Households | - | 62 (9.0%) |
| 2-Person Households | 341 (49.3%) | 73 (10.5%) |
| 3-Person Households | 99 (14.3%) | 0 (0.0%) |
| 4-Person Households | 44 (6.4%) | 0 (0.0%) |
| 5-Person Households | 28 (4.1%) | 0 (0.0%) |
| 6-Person Households | 30 (4.3%) | 0 (0.0%) |
| 7+ Person Households | 15 (2.2%) | 0 (0.0%) |
| Total | 557 (80.5%) | 135 (19.5%) |
Female Fertility in Elizabeth
Fertility by Age in Elizabeth
Average fertility rate in Elizabeth is 101.0 births per 1,000 women. Women in the age bracket of 20 to 34 years have the highest fertility rate with 135.0 births per 1,000 women. Women in the age bracket of 20 to 34 years acount for 80.9% of all women with births.
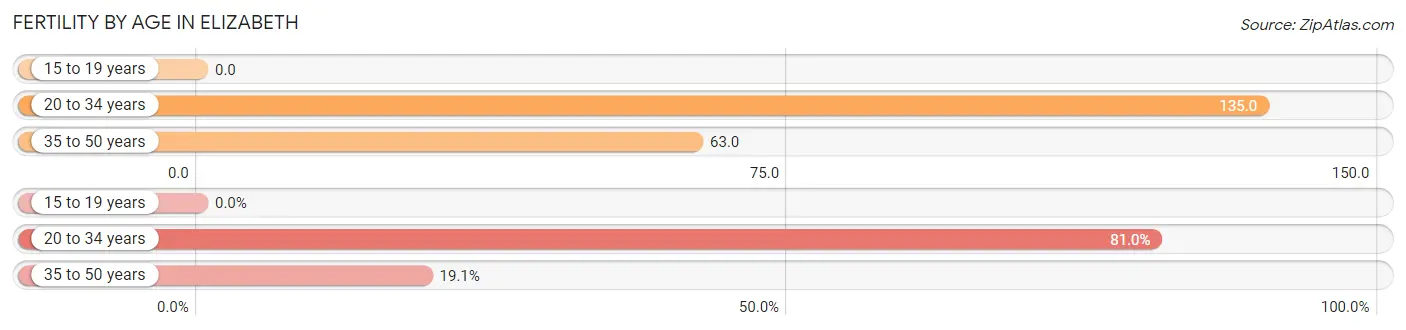
| Age Bracket | Women with Births | Births / 1,000 Women |
| 15 to 19 years | 0 (0.0%) | 0.0 |
| 20 to 34 years | 34 (80.9%) | 135.0 |
| 35 to 50 years | 8 (19.1%) | 63.0 |
| Total | 42 (100.0%) | 101.0 |
Fertility by Age by Marriage Status in Elizabeth
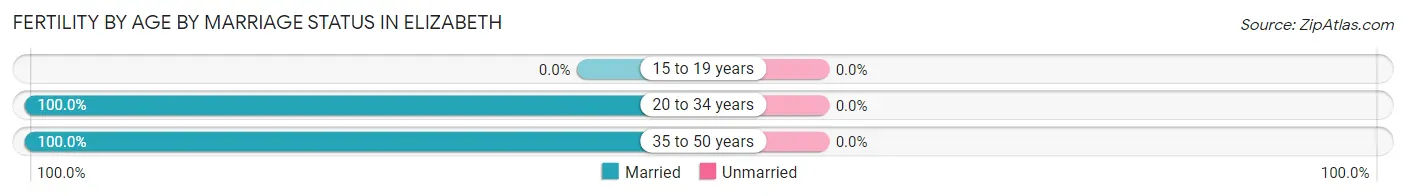
| Age Bracket | Married | Unmarried |
| 15 to 19 years | 0 (0.0%) | 0 (0.0%) |
| 20 to 34 years | 34 (100.0%) | 0 (0.0%) |
| 35 to 50 years | 8 (100.0%) | 0 (0.0%) |
| Total | 42 (100.0%) | 0 (0.0%) |
Fertility by Education in Elizabeth
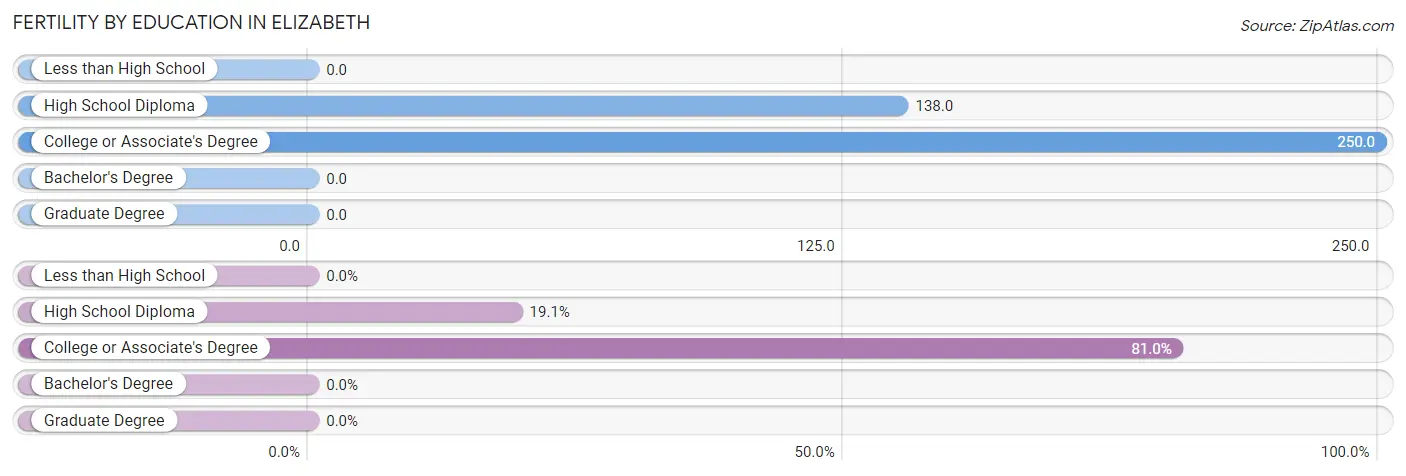
| Educational Attainment | Women with Births | Births / 1,000 Women |
| Less than High School | 0 (0.0%) | 0.0 |
| High School Diploma | 8 (19.1%) | 138.0 |
| College or Associate's Degree | 34 (80.9%) | 250.0 |
| Bachelor's Degree | 0 (0.0%) | 0.0 |
| Graduate Degree | 0 (0.0%) | 0.0 |
| Total | 42 (100.0%) | 101.0 |
Fertility by Education by Marriage Status in Elizabeth
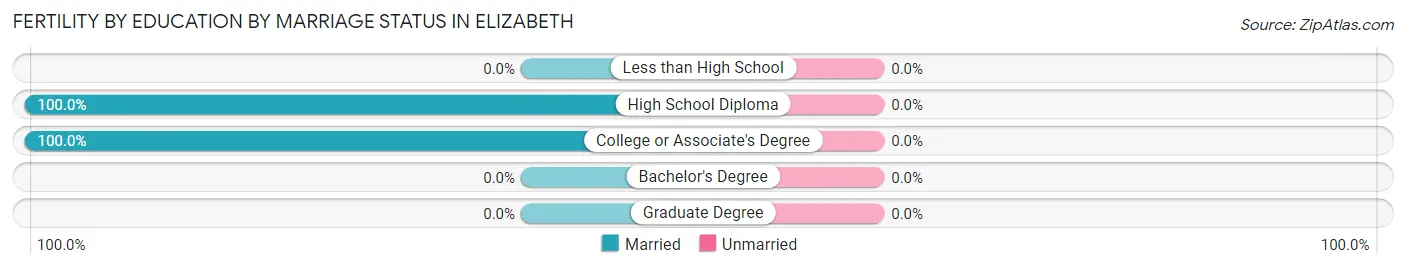
| Educational Attainment | Married | Unmarried |
| Less than High School | 0 (0.0%) | 0 (0.0%) |
| High School Diploma | 8 (100.0%) | 0 (0.0%) |
| College or Associate's Degree | 34 (100.0%) | 0 (0.0%) |
| Bachelor's Degree | 0 (0.0%) | 0 (0.0%) |
| Graduate Degree | 0 (0.0%) | 0 (0.0%) |
| Total | 42 (100.0%) | 0 (0.0%) |
Income in Elizabeth
Income Overview in Elizabeth
Per Capita Income in Elizabeth is $39,534, while median incomes of families and households are $106,827 and $99,889 respectively.
| Characteristic | Number | Measure |
| Per Capita Income | 1,830 | $39,534 |
| Median Family Income | 557 | $106,827 |
| Mean Family Income | 557 | $105,731 |
| Median Household Income | 692 | $99,889 |
| Mean Household Income | 692 | $99,336 |
| Income Deficit | 557 | $16,560 |
| Wage / Income Gap (%) | 1,830 | 14.25% |
| Wage / Income Gap ($) | 1,830 | 85.75¢ per $1 |
| Gini / Inequality Index | 1,830 | 0.27 |
Earnings by Sex in Elizabeth
Average Earnings in Elizabeth are $53,505, $56,250 for men and $48,235 for women, a difference of 14.2%.
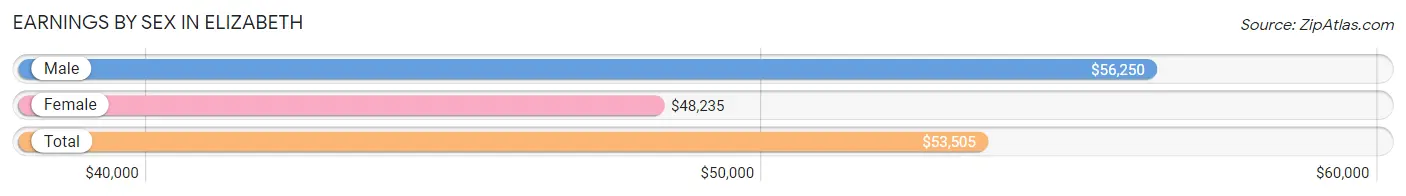
| Sex | Number | Average Earnings |
| Male | 587 (50.4%) | $56,250 |
| Female | 578 (49.6%) | $48,235 |
| Total | 1,165 (100.0%) | $53,505 |
Earnings by Sex by Income Bracket in Elizabeth
The most common earnings brackets in Elizabeth are $55,000 to $64,999 for men (129 | 22.0%) and $55,000 to $64,999 for women (132 | 22.8%).
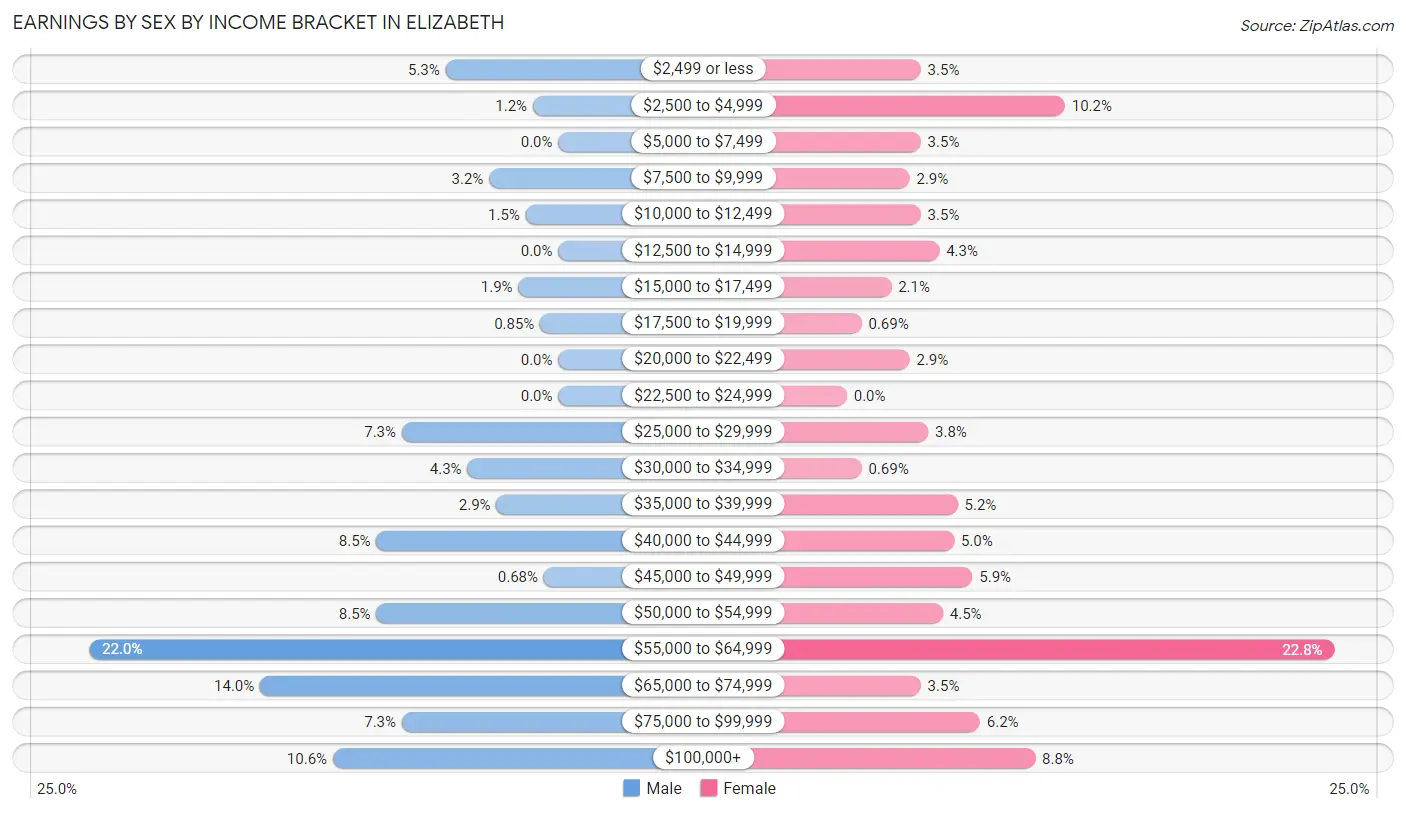
| Income | Male | Female |
| $2,499 or less | 31 (5.3%) | 20 (3.5%) |
| $2,500 to $4,999 | 7 (1.2%) | 59 (10.2%) |
| $5,000 to $7,499 | 0 (0.0%) | 20 (3.5%) |
| $7,500 to $9,999 | 19 (3.2%) | 17 (2.9%) |
| $10,000 to $12,499 | 9 (1.5%) | 20 (3.5%) |
| $12,500 to $14,999 | 0 (0.0%) | 25 (4.3%) |
| $15,000 to $17,499 | 11 (1.9%) | 12 (2.1%) |
| $17,500 to $19,999 | 5 (0.9%) | 4 (0.7%) |
| $20,000 to $22,499 | 0 (0.0%) | 17 (2.9%) |
| $22,500 to $24,999 | 0 (0.0%) | 0 (0.0%) |
| $25,000 to $29,999 | 43 (7.3%) | 22 (3.8%) |
| $30,000 to $34,999 | 25 (4.3%) | 4 (0.7%) |
| $35,000 to $39,999 | 17 (2.9%) | 30 (5.2%) |
| $40,000 to $44,999 | 50 (8.5%) | 29 (5.0%) |
| $45,000 to $49,999 | 4 (0.7%) | 34 (5.9%) |
| $50,000 to $54,999 | 50 (8.5%) | 26 (4.5%) |
| $55,000 to $64,999 | 129 (22.0%) | 132 (22.8%) |
| $65,000 to $74,999 | 82 (14.0%) | 20 (3.5%) |
| $75,000 to $99,999 | 43 (7.3%) | 36 (6.2%) |
| $100,000+ | 62 (10.6%) | 51 (8.8%) |
| Total | 587 (100.0%) | 578 (100.0%) |
Earnings by Sex by Educational Attainment in Elizabeth
Average earnings in Elizabeth are $58,333 for men and $49,485 for women, a difference of 15.2%. Men with an educational attainment of bachelor's degree enjoy the highest average annual earnings of $62,500, while those with college or associate's degree education earn the least with $54,022. Women with an educational attainment of graduate degree earn the most with the average annual earnings of $105,469, while those with college or associate's degree education have the smallest earnings of $36,172.
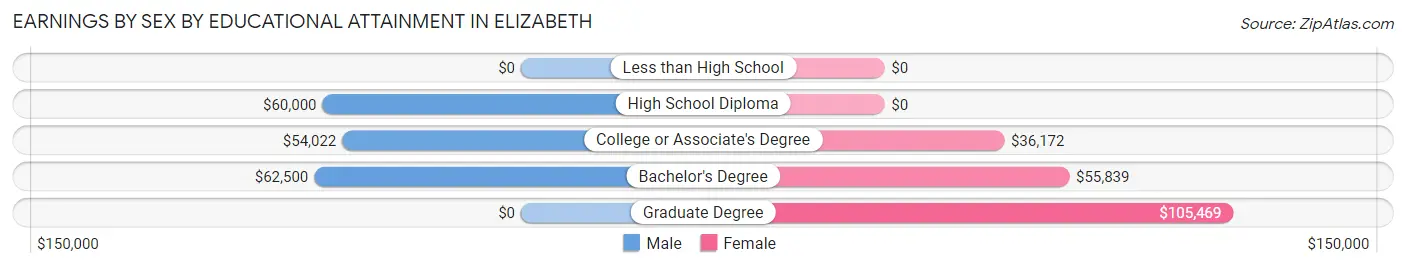
| Educational Attainment | Male Income | Female Income |
| Less than High School | - | - |
| High School Diploma | $60,000 | $0 |
| College or Associate's Degree | $54,022 | $36,172 |
| Bachelor's Degree | $62,500 | $55,839 |
| Graduate Degree | - | - |
| Total | $58,333 | $49,485 |
Family Income in Elizabeth
Family Income Brackets in Elizabeth
According to the Elizabeth family income data, there are 228 families falling into the $100,000 to $149,999 income range, which is the most common income bracket and makes up 40.9% of all families.
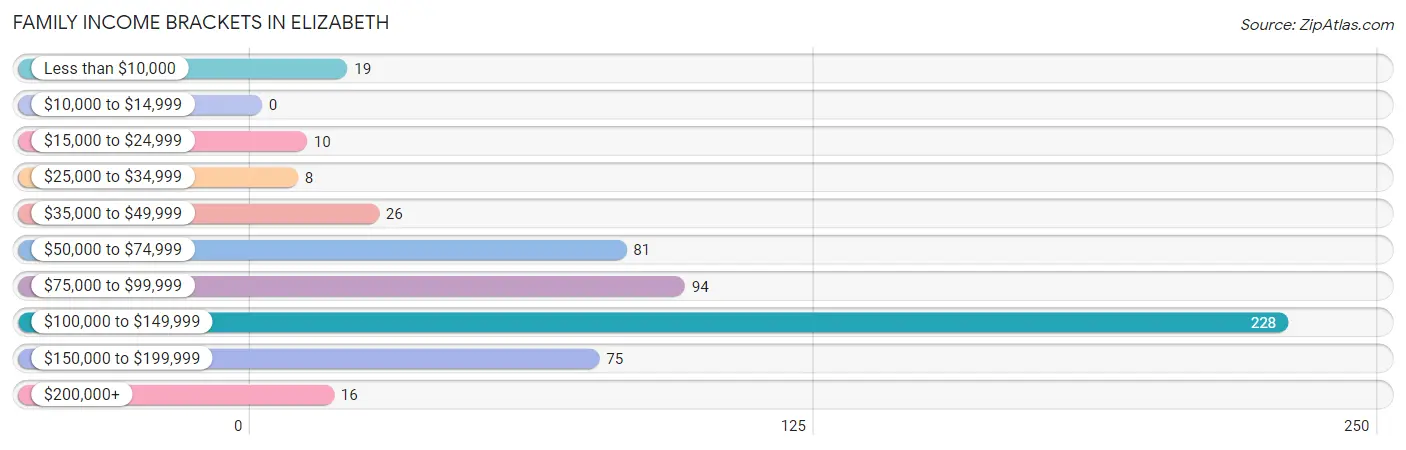
| Income Bracket | # Families | % Families |
| Less than $10,000 | 19 | 3.4% |
| $10,000 to $14,999 | 0 | 0.0% |
| $15,000 to $24,999 | 10 | 1.8% |
| $25,000 to $34,999 | 8 | 1.4% |
| $35,000 to $49,999 | 26 | 4.7% |
| $50,000 to $74,999 | 81 | 14.5% |
| $75,000 to $99,999 | 94 | 16.9% |
| $100,000 to $149,999 | 228 | 40.9% |
| $150,000 to $199,999 | 75 | 13.5% |
| $200,000+ | 16 | 2.9% |
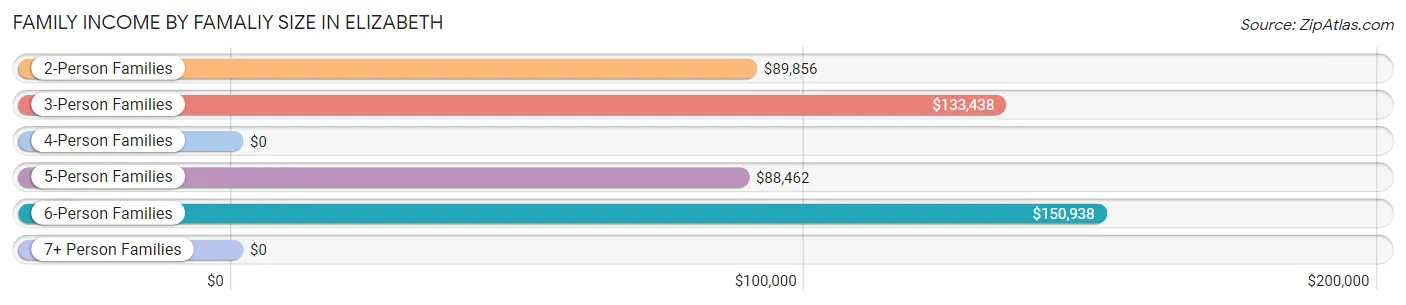
Family Income by Famaliy Size in Elizabeth
6-person families (30 | 5.4%) account for the highest median family income in Elizabeth with $150,938 per family, while 2-person families (341 | 61.2%) have the highest median income of $44,928 per family member.
| Income Bracket | # Families | Median Income |
| 2-Person Families | 341 (61.2%) | $89,856 |
| 3-Person Families | 99 (17.8%) | $133,438 |
| 4-Person Families | 44 (7.9%) | $0 |
| 5-Person Families | 28 (5.0%) | $88,462 |
| 6-Person Families | 30 (5.4%) | $150,938 |
| 7+ Person Families | 15 (2.7%) | $0 |
| Total | 557 (100.0%) | $106,827 |
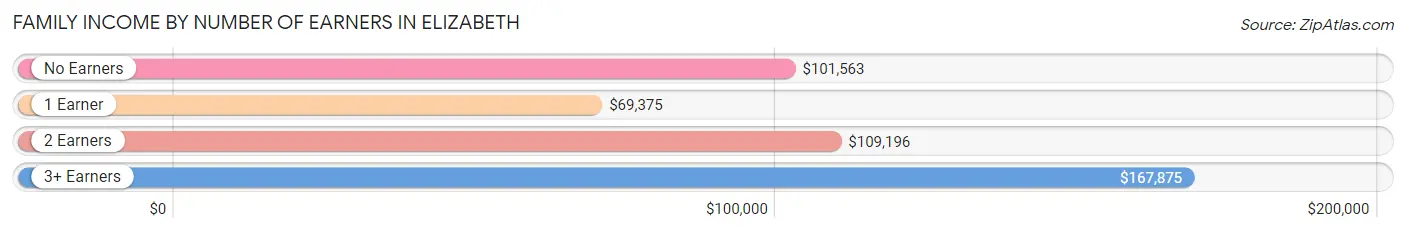
Family Income by Number of Earners in Elizabeth
The median family income in Elizabeth is $106,827, with families comprising 3+ earners (29) having the highest median family income of $167,875, while families with 1 earner (188) have the lowest median family income of $69,375, accounting for 5.2% and 33.8% of families, respectively.
| Number of Earners | # Families | Median Income |
| No Earners | 34 (6.1%) | $101,563 |
| 1 Earner | 188 (33.8%) | $69,375 |
| 2 Earners | 306 (54.9%) | $109,196 |
| 3+ Earners | 29 (5.2%) | $167,875 |
| Total | 557 (100.0%) | $106,827 |
Household Income in Elizabeth
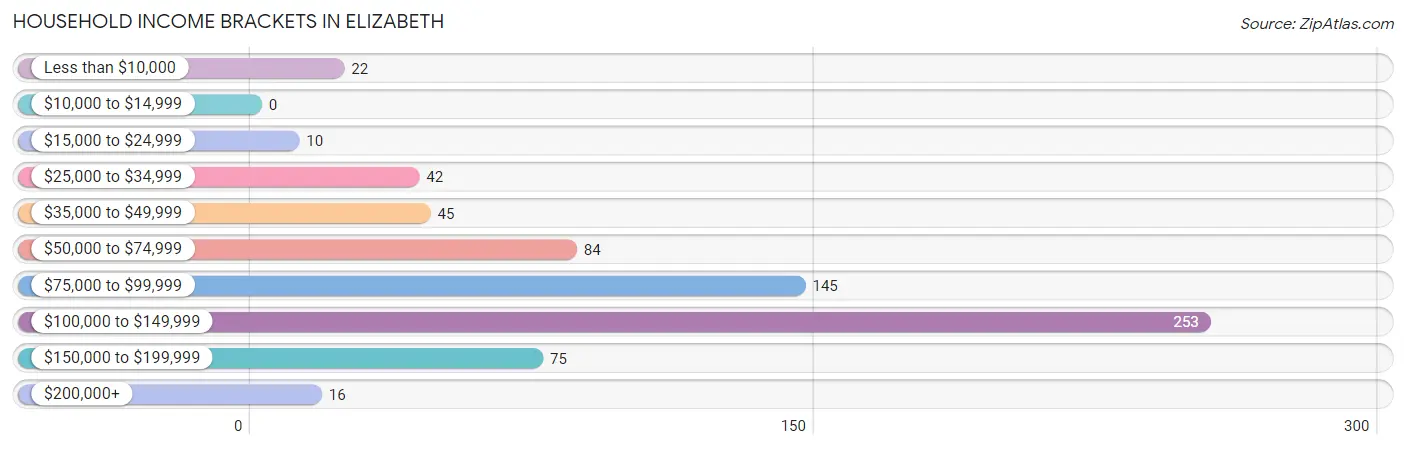
Household Income Brackets in Elizabeth
With 253 households falling in the category, the $100,000 to $149,999 income range is the most frequent in Elizabeth, accounting for 36.6% of all households.
| Income Bracket | # Households | % Households |
| Less than $10,000 | 22 | 3.2% |
| $10,000 to $14,999 | 0 | 0.0% |
| $15,000 to $24,999 | 10 | 1.4% |
| $25,000 to $34,999 | 42 | 6.1% |
| $35,000 to $49,999 | 45 | 6.5% |
| $50,000 to $74,999 | 84 | 12.1% |
| $75,000 to $99,999 | 145 | 21.0% |
| $100,000 to $149,999 | 253 | 36.6% |
| $150,000 to $199,999 | 75 | 10.8% |
| $200,000+ | 16 | 2.3% |
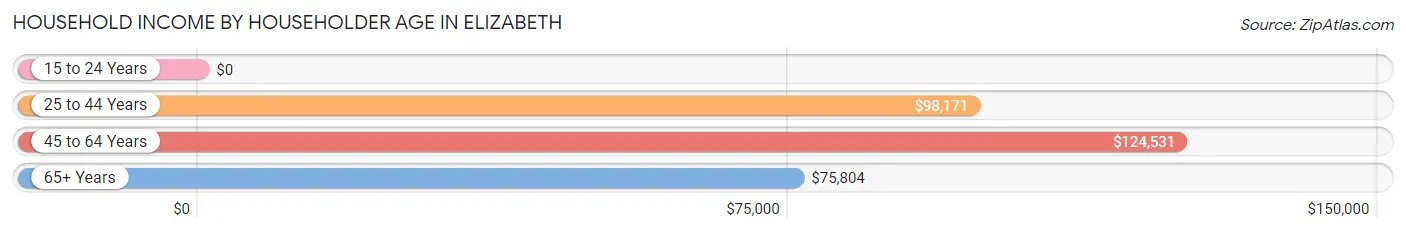
Household Income by Householder Age in Elizabeth
The median household income in Elizabeth is $99,889, with the highest median household income of $124,531 found in the 45 to 64 years age bracket for the primary householder. A total of 213 households (30.8%) fall into this category. Meanwhile, the 15 to 24 years age bracket for the primary householder has the lowest median household income of $0, with 14 households (2.0%) in this group.
| Income Bracket | # Households | Median Income |
| 15 to 24 Years | 14 (2.0%) | $0 |
| 25 to 44 Years | 308 (44.5%) | $98,171 |
| 45 to 64 Years | 213 (30.8%) | $124,531 |
| 65+ Years | 157 (22.7%) | $75,804 |
| Total | 692 (100.0%) | $99,889 |
Poverty in Elizabeth
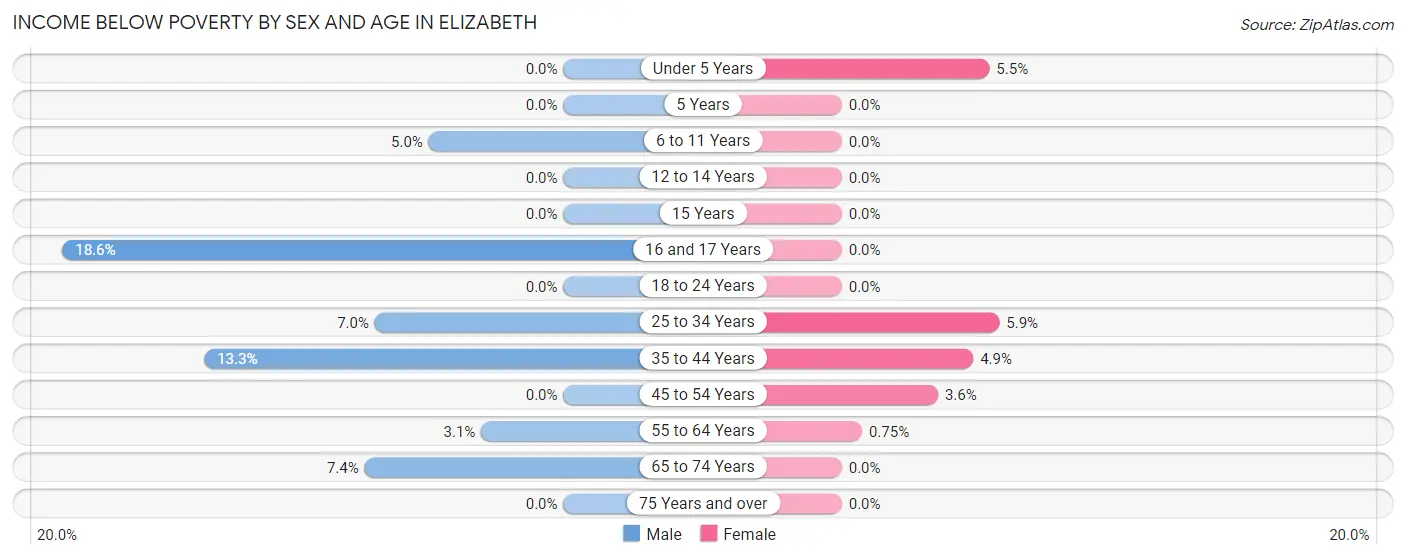
Income Below Poverty by Sex and Age in Elizabeth
With 5.7% poverty level for males and 2.5% for females among the residents of Elizabeth, 16 and 17 year old males and 25 to 34 year old females are the most vulnerable to poverty, with 8 males (18.6%) and 12 females (5.9%) in their respective age groups living below the poverty level.
| Age Bracket | Male | Female |
| Under 5 Years | 0 (0.0%) | 4 (5.5%) |
| 5 Years | 0 (0.0%) | 0 (0.0%) |
| 6 to 11 Years | 3 (5.0%) | 0 (0.0%) |
| 12 to 14 Years | 0 (0.0%) | 0 (0.0%) |
| 15 Years | 0 (0.0%) | 0 (0.0%) |
| 16 and 17 Years | 8 (18.6%) | 0 (0.0%) |
| 18 to 24 Years | 0 (0.0%) | 0 (0.0%) |
| 25 to 34 Years | 18 (7.0%) | 12 (5.9%) |
| 35 to 44 Years | 8 (13.3%) | 4 (4.9%) |
| 45 to 54 Years | 0 (0.0%) | 3 (3.6%) |
| 55 to 64 Years | 4 (3.0%) | 1 (0.7%) |
| 65 to 74 Years | 9 (7.4%) | 0 (0.0%) |
| 75 Years and over | 0 (0.0%) | 0 (0.0%) |
| Total | 50 (5.7%) | 24 (2.5%) |
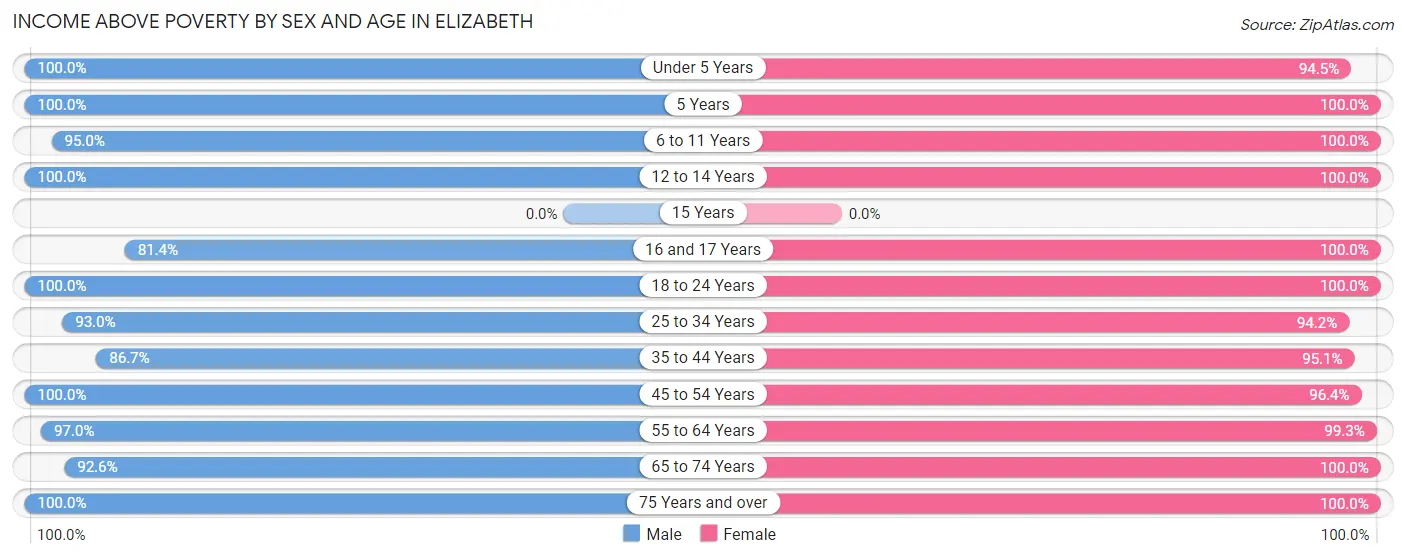
Income Above Poverty by Sex and Age in Elizabeth
According to the poverty statistics in Elizabeth, males aged under 5 years and females aged 5 years are the age groups that are most secure financially, with 100.0% of males and 100.0% of females in these age groups living above the poverty line.
| Age Bracket | Male | Female |
| Under 5 Years | 34 (100.0%) | 69 (94.5%) |
| 5 Years | 8 (100.0%) | 3 (100.0%) |
| 6 to 11 Years | 57 (95.0%) | 91 (100.0%) |
| 12 to 14 Years | 34 (100.0%) | 44 (100.0%) |
| 15 Years | 0 (0.0%) | 0 (0.0%) |
| 16 and 17 Years | 35 (81.4%) | 7 (100.0%) |
| 18 to 24 Years | 67 (100.0%) | 76 (100.0%) |
| 25 to 34 Years | 239 (93.0%) | 193 (94.2%) |
| 35 to 44 Years | 52 (86.7%) | 78 (95.1%) |
| 45 to 54 Years | 51 (100.0%) | 81 (96.4%) |
| 55 to 64 Years | 127 (97.0%) | 133 (99.3%) |
| 65 to 74 Years | 113 (92.6%) | 123 (100.0%) |
| 75 Years and over | 16 (100.0%) | 25 (100.0%) |
| Total | 833 (94.3%) | 923 (97.5%) |
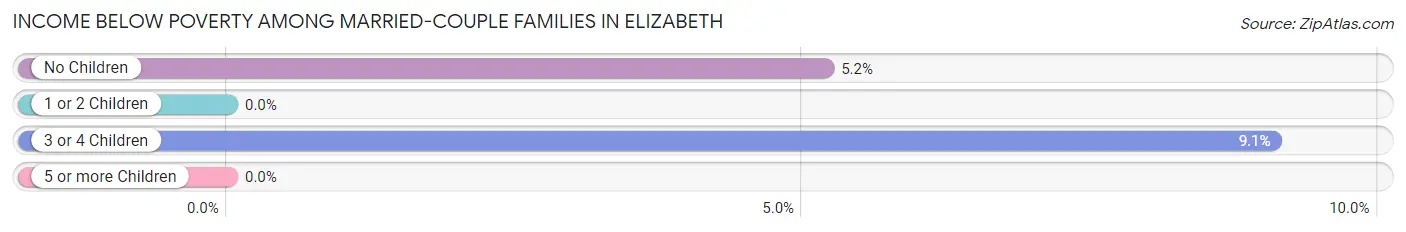
Income Below Poverty Among Married-Couple Families in Elizabeth
The poverty statistics for married-couple families in Elizabeth show that 4.2% or 20 of the total 480 families live below the poverty line. Families with 3 or 4 children have the highest poverty rate of 9.1%, comprising of 4 families. On the other hand, families with 1 or 2 children have the lowest poverty rate of 0.0%, which includes 0 families.
| Children | Above Poverty | Below Poverty |
| No Children | 292 (94.8%) | 16 (5.2%) |
| 1 or 2 Children | 113 (100.0%) | 0 (0.0%) |
| 3 or 4 Children | 40 (90.9%) | 4 (9.1%) |
| 5 or more Children | 15 (100.0%) | 0 (0.0%) |
| Total | 460 (95.8%) | 20 (4.2%) |
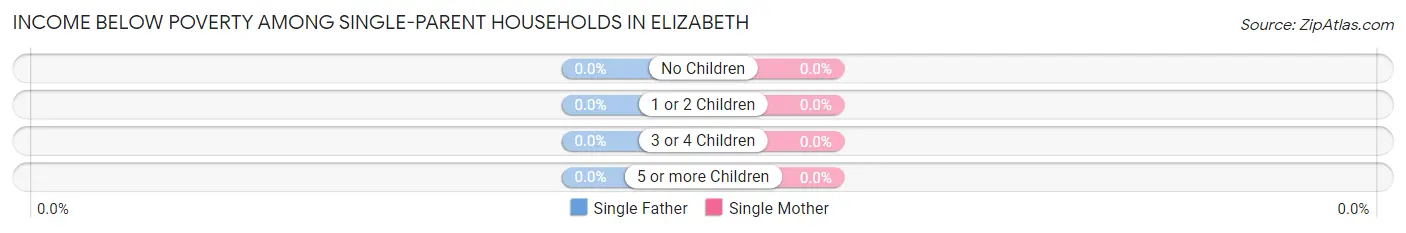
Income Below Poverty Among Single-Parent Households in Elizabeth
| Children | Single Father | Single Mother |
| No Children | 0 (0.0%) | 0 (0.0%) |
| 1 or 2 Children | 0 (0.0%) | 0 (0.0%) |
| 3 or 4 Children | 0 (0.0%) | 0 (0.0%) |
| 5 or more Children | 0 (0.0%) | 0 (0.0%) |
| Total | 0 (0.0%) | 0 (0.0%) |
Income Below Poverty Among Married-Couple vs Single-Parent Households in Elizabeth
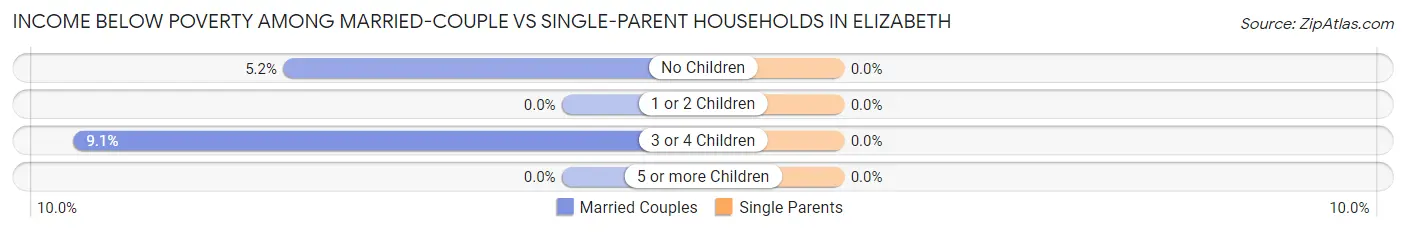
| Children | Married-Couple Families | Single-Parent Households |
| No Children | 16 (5.2%) | 0 (0.0%) |
| 1 or 2 Children | 0 (0.0%) | 0 (0.0%) |
| 3 or 4 Children | 4 (9.1%) | 0 (0.0%) |
| 5 or more Children | 0 (0.0%) | 0 (0.0%) |
| Total | 20 (4.2%) | 0 (0.0%) |
Employment Characteristics in Elizabeth
Employment by Class of Employer in Elizabeth
Among the 1,011 employed individuals in Elizabeth, private company employees (497 | 49.2%), not-for-profit organizations (152 | 15.0%), and local government employees (125 | 12.4%) make up the most common classes of employment.
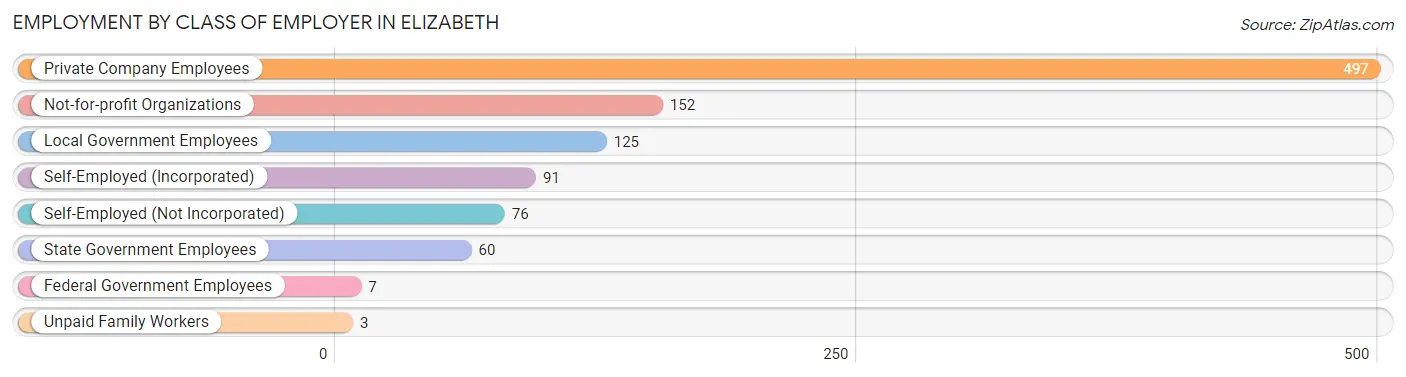
| Employer Class | # Employees | % Employees |
| Private Company Employees | 497 | 49.2% |
| Self-Employed (Incorporated) | 91 | 9.0% |
| Self-Employed (Not Incorporated) | 76 | 7.5% |
| Not-for-profit Organizations | 152 | 15.0% |
| Local Government Employees | 125 | 12.4% |
| State Government Employees | 60 | 5.9% |
| Federal Government Employees | 7 | 0.7% |
| Unpaid Family Workers | 3 | 0.3% |
| Total | 1,011 | 100.0% |
Employment Status by Age in Elizabeth
According to the labor force statistics for Elizabeth, out of the total population over 16 years of age (1,483), 70.5% or 1,046 individuals are in the labor force, with 3.0% or 31 of them unemployed. The age group with the highest labor force participation rate is 35 to 44 years, with 97.9% or 139 individuals in the labor force. Within the labor force, the 35 to 44 years age range has the highest percentage of unemployed individuals, with 15.8% or 22 of them being unemployed.
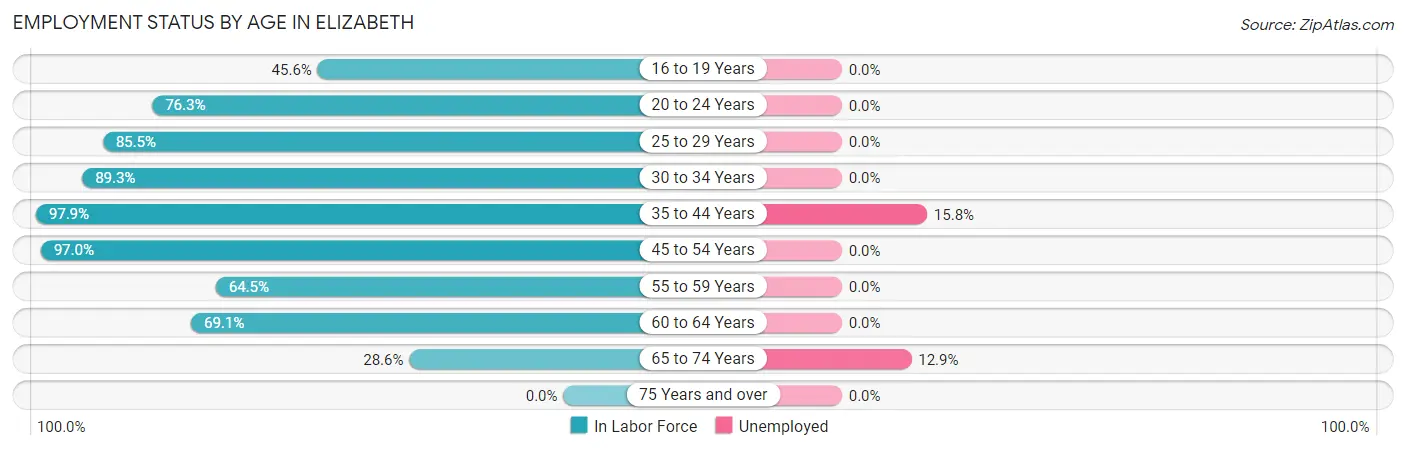
| Age Bracket | In Labor Force | Unemployed |
| 16 to 19 Years | 36 (45.6%) | 0 (0.0%) |
| 20 to 24 Years | 87 (76.3%) | 0 (0.0%) |
| 25 to 29 Years | 147 (85.5%) | 0 (0.0%) |
| 30 to 34 Years | 259 (89.3%) | 0 (0.0%) |
| 35 to 44 Years | 139 (97.9%) | 22 (15.8%) |
| 45 to 54 Years | 131 (97.0%) | 0 (0.0%) |
| 55 to 59 Years | 100 (64.5%) | 0 (0.0%) |
| 60 to 64 Years | 76 (69.1%) | 0 (0.0%) |
| 65 to 74 Years | 70 (28.6%) | 9 (12.9%) |
| 75 Years and over | 0 (0.0%) | 0 (0.0%) |
| Total | 1,046 (70.5%) | 31 (3.0%) |
Employment Status by Educational Attainment in Elizabeth
According to labor force statistics for Elizabeth, 84.9% of individuals (852) out of the total population between 25 and 64 years of age (1,004) are in the labor force, with 2.6% or 22 of them being unemployed. The group with the highest labor force participation rate are those with the educational attainment of bachelor's degree or higher, with 90.8% or 317 individuals in the labor force. Within the labor force, individuals with high school diploma education have the highest percentage of unemployment, with 6.9% or 17 of them being unemployed.
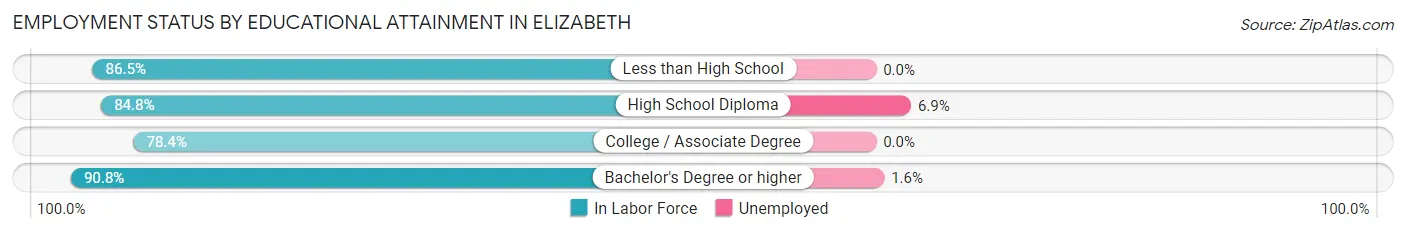
| Educational Attainment | In Labor Force | Unemployed |
| Less than High School | 32 (86.5%) | 0 (0.0%) |
| High School Diploma | 245 (84.8%) | 20 (6.9%) |
| College / Associate Degree | 258 (78.4%) | 0 (0.0%) |
| Bachelor's Degree or higher | 317 (90.8%) | 6 (1.6%) |
| Total | 852 (84.9%) | 26 (2.6%) |
Employment Occupations by Sex in Elizabeth
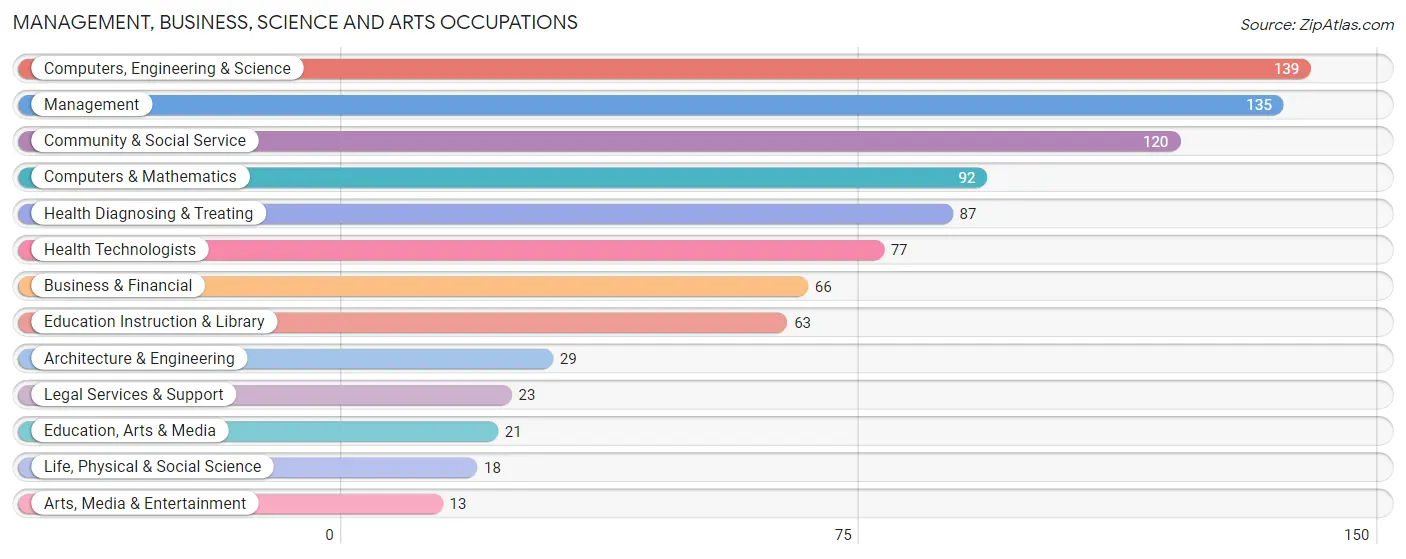
Management, Business, Science and Arts Occupations
The most common Management, Business, Science and Arts occupations in Elizabeth are Computers, Engineering & Science (139 | 13.7%), Management (135 | 13.3%), Community & Social Service (120 | 11.8%), Computers & Mathematics (92 | 9.1%), and Health Diagnosing & Treating (87 | 8.6%).
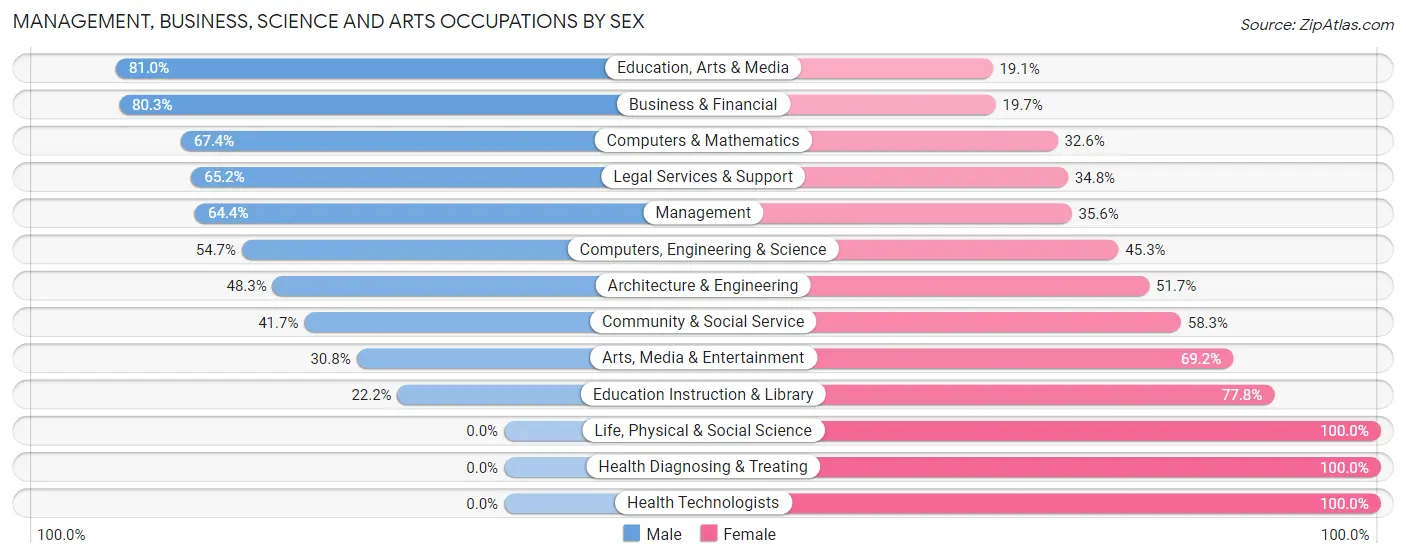
Management, Business, Science and Arts Occupations by Sex
Within the Management, Business, Science and Arts occupations in Elizabeth, the most male-oriented occupations are Education, Arts & Media (80.9%), Business & Financial (80.3%), and Computers & Mathematics (67.4%), while the most female-oriented occupations are Life, Physical & Social Science (100.0%), Health Diagnosing & Treating (100.0%), and Health Technologists (100.0%).
| Occupation | Male | Female |
| Management | 87 (64.4%) | 48 (35.6%) |
| Business & Financial | 53 (80.3%) | 13 (19.7%) |
| Computers, Engineering & Science | 76 (54.7%) | 63 (45.3%) |
| Computers & Mathematics | 62 (67.4%) | 30 (32.6%) |
| Architecture & Engineering | 14 (48.3%) | 15 (51.7%) |
| Life, Physical & Social Science | 0 (0.0%) | 18 (100.0%) |
| Community & Social Service | 50 (41.7%) | 70 (58.3%) |
| Education, Arts & Media | 17 (80.9%) | 4 (19.1%) |
| Legal Services & Support | 15 (65.2%) | 8 (34.8%) |
| Education Instruction & Library | 14 (22.2%) | 49 (77.8%) |
| Arts, Media & Entertainment | 4 (30.8%) | 9 (69.2%) |
| Health Diagnosing & Treating | 0 (0.0%) | 87 (100.0%) |
| Health Technologists | 0 (0.0%) | 77 (100.0%) |
| Total (Category) | 266 (48.6%) | 281 (51.4%) |
| Total (Overall) | 523 (51.6%) | 491 (48.4%) |
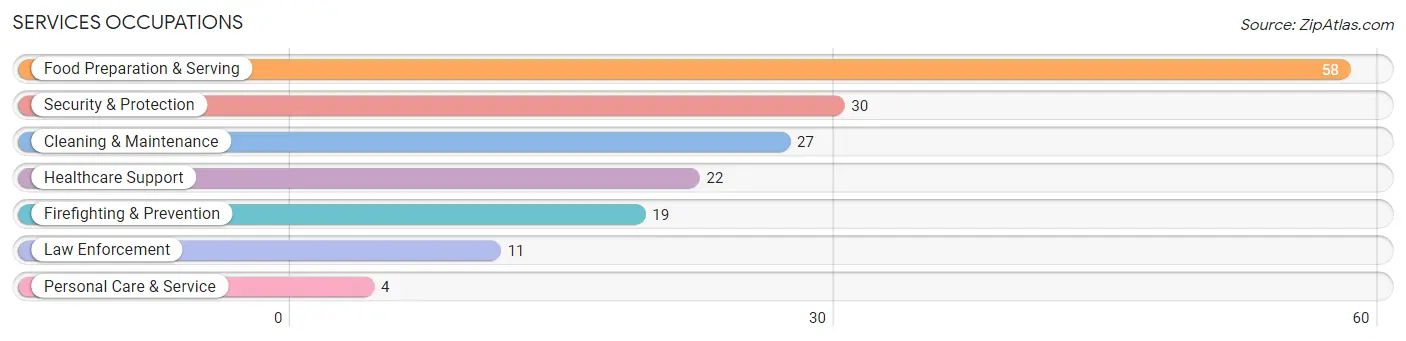
Services Occupations
The most common Services occupations in Elizabeth are Food Preparation & Serving (58 | 5.7%), Security & Protection (30 | 3.0%), Cleaning & Maintenance (27 | 2.7%), Healthcare Support (22 | 2.2%), and Firefighting & Prevention (19 | 1.9%).
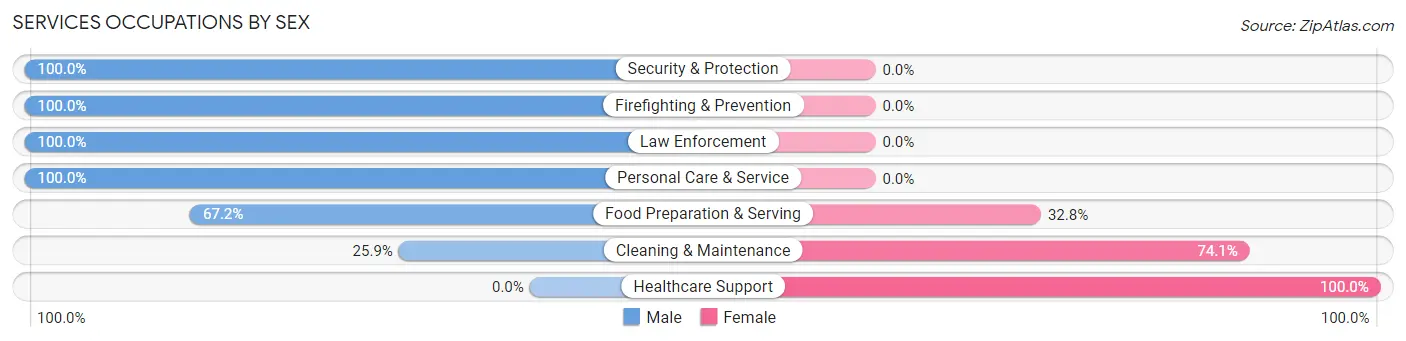
Services Occupations by Sex
Within the Services occupations in Elizabeth, the most male-oriented occupations are Security & Protection (100.0%), Firefighting & Prevention (100.0%), and Law Enforcement (100.0%), while the most female-oriented occupations are Healthcare Support (100.0%), Cleaning & Maintenance (74.1%), and Food Preparation & Serving (32.8%).
| Occupation | Male | Female |
| Healthcare Support | 0 (0.0%) | 22 (100.0%) |
| Security & Protection | 30 (100.0%) | 0 (0.0%) |
| Firefighting & Prevention | 19 (100.0%) | 0 (0.0%) |
| Law Enforcement | 11 (100.0%) | 0 (0.0%) |
| Food Preparation & Serving | 39 (67.2%) | 19 (32.8%) |
| Cleaning & Maintenance | 7 (25.9%) | 20 (74.1%) |
| Personal Care & Service | 4 (100.0%) | 0 (0.0%) |
| Total (Category) | 80 (56.7%) | 61 (43.3%) |
| Total (Overall) | 523 (51.6%) | 491 (48.4%) |
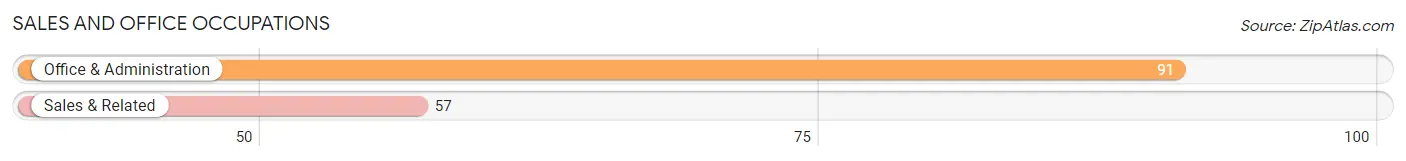
Sales and Office Occupations
The most common Sales and Office occupations in Elizabeth are Office & Administration (91 | 9.0%), and Sales & Related (57 | 5.6%).
Sales and Office Occupations by Sex
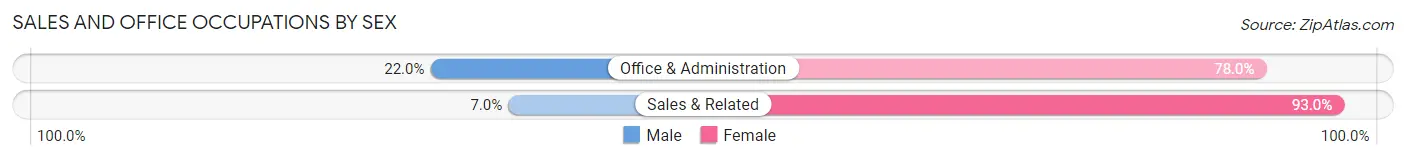
| Occupation | Male | Female |
| Sales & Related | 4 (7.0%) | 53 (93.0%) |
| Office & Administration | 20 (22.0%) | 71 (78.0%) |
| Total (Category) | 24 (16.2%) | 124 (83.8%) |
| Total (Overall) | 523 (51.6%) | 491 (48.4%) |
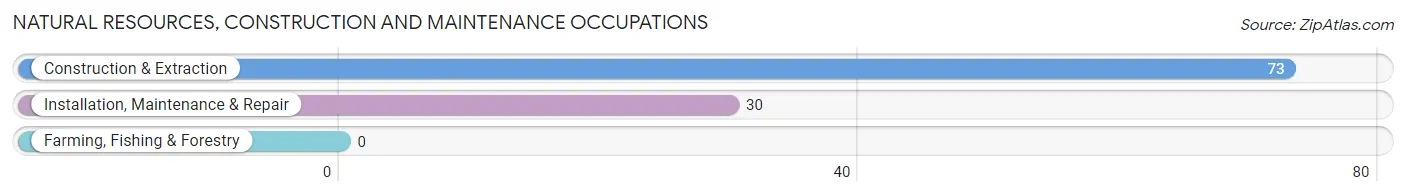
Natural Resources, Construction and Maintenance Occupations
The most common Natural Resources, Construction and Maintenance occupations in Elizabeth are Construction & Extraction (73 | 7.2%), and Installation, Maintenance & Repair (30 | 3.0%).
Natural Resources, Construction and Maintenance Occupations by Sex
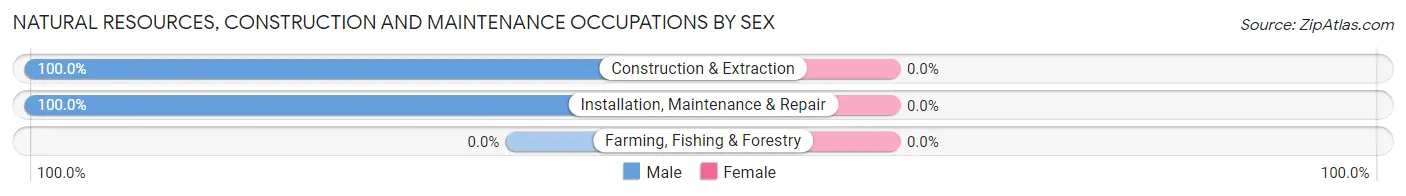
| Occupation | Male | Female |
| Farming, Fishing & Forestry | 0 (0.0%) | 0 (0.0%) |
| Construction & Extraction | 73 (100.0%) | 0 (0.0%) |
| Installation, Maintenance & Repair | 30 (100.0%) | 0 (0.0%) |
| Total (Category) | 103 (100.0%) | 0 (0.0%) |
| Total (Overall) | 523 (51.6%) | 491 (48.4%) |
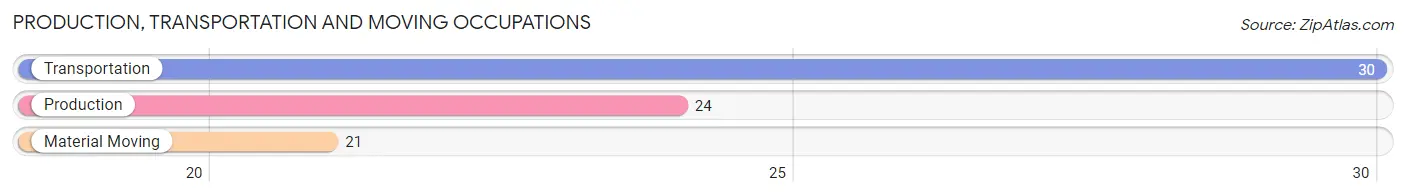
Production, Transportation and Moving Occupations
The most common Production, Transportation and Moving occupations in Elizabeth are Transportation (30 | 3.0%), Production (24 | 2.4%), and Material Moving (21 | 2.1%).
Production, Transportation and Moving Occupations by Sex
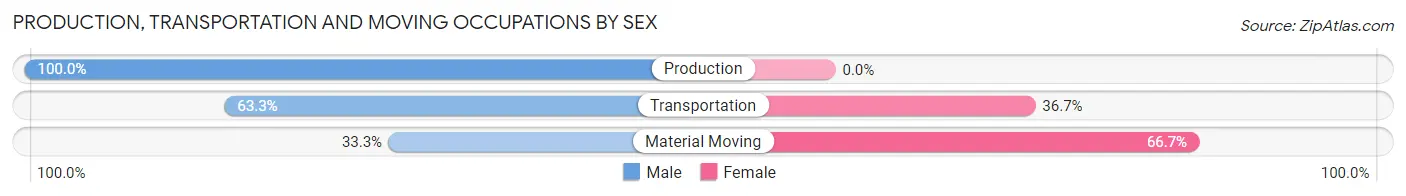
| Occupation | Male | Female |
| Production | 24 (100.0%) | 0 (0.0%) |
| Transportation | 19 (63.3%) | 11 (36.7%) |
| Material Moving | 7 (33.3%) | 14 (66.7%) |
| Total (Category) | 50 (66.7%) | 25 (33.3%) |
| Total (Overall) | 523 (51.6%) | 491 (48.4%) |
Employment Industries by Sex in Elizabeth
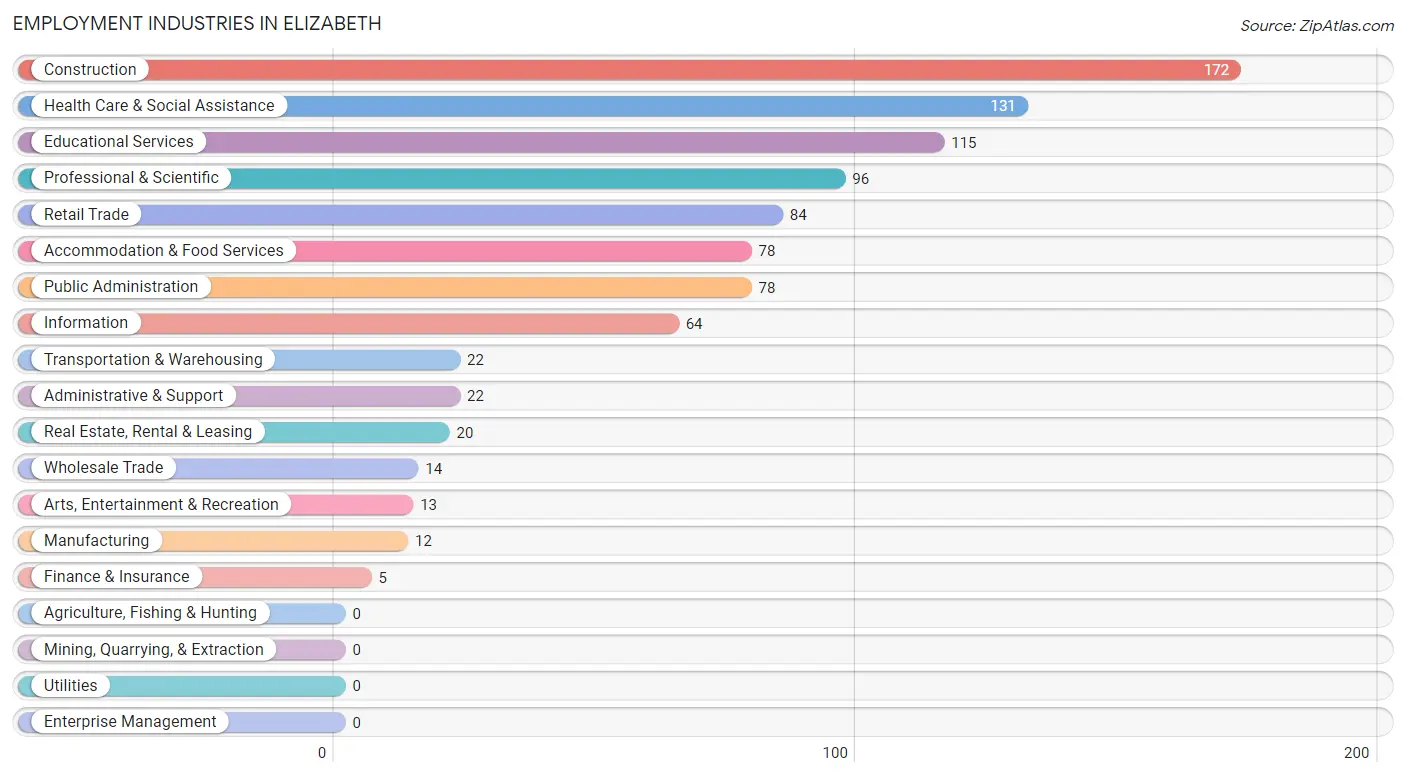
Employment Industries in Elizabeth
The major employment industries in Elizabeth include Construction (172 | 17.0%), Health Care & Social Assistance (131 | 12.9%), Educational Services (115 | 11.3%), Professional & Scientific (96 | 9.5%), and Retail Trade (84 | 8.3%).
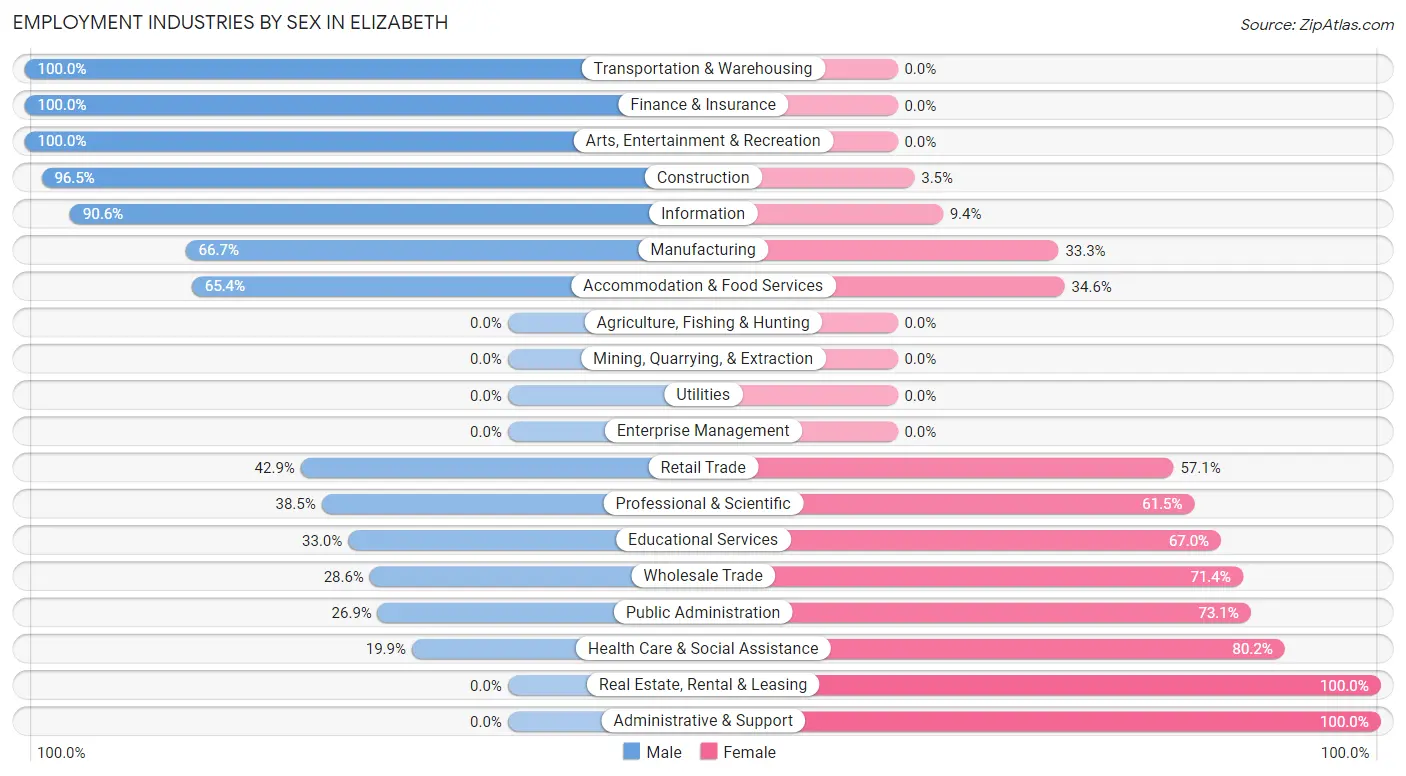
Employment Industries by Sex in Elizabeth
The Elizabeth industries that see more men than women are Transportation & Warehousing (100.0%), Finance & Insurance (100.0%), and Arts, Entertainment & Recreation (100.0%), whereas the industries that tend to have a higher number of women are Real Estate, Rental & Leasing (100.0%), Administrative & Support (100.0%), and Health Care & Social Assistance (80.1%).
| Industry | Male | Female |
| Agriculture, Fishing & Hunting | 0 (0.0%) | 0 (0.0%) |
| Mining, Quarrying, & Extraction | 0 (0.0%) | 0 (0.0%) |
| Construction | 166 (96.5%) | 6 (3.5%) |
| Manufacturing | 8 (66.7%) | 4 (33.3%) |
| Wholesale Trade | 4 (28.6%) | 10 (71.4%) |
| Retail Trade | 36 (42.9%) | 48 (57.1%) |
| Transportation & Warehousing | 22 (100.0%) | 0 (0.0%) |
| Utilities | 0 (0.0%) | 0 (0.0%) |
| Information | 58 (90.6%) | 6 (9.4%) |
| Finance & Insurance | 5 (100.0%) | 0 (0.0%) |
| Real Estate, Rental & Leasing | 0 (0.0%) | 20 (100.0%) |
| Professional & Scientific | 37 (38.5%) | 59 (61.5%) |
| Enterprise Management | 0 (0.0%) | 0 (0.0%) |
| Administrative & Support | 0 (0.0%) | 22 (100.0%) |
| Educational Services | 38 (33.0%) | 77 (67.0%) |
| Health Care & Social Assistance | 26 (19.9%) | 105 (80.1%) |
| Arts, Entertainment & Recreation | 13 (100.0%) | 0 (0.0%) |
| Accommodation & Food Services | 51 (65.4%) | 27 (34.6%) |
| Public Administration | 21 (26.9%) | 57 (73.1%) |
| Total | 523 (51.6%) | 491 (48.4%) |
Education in Elizabeth
School Enrollment in Elizabeth
The most common levels of schooling among the 407 students in Elizabeth are middle school (104 | 25.6%), elementary school (82 | 20.2%), and high school (81 | 19.9%).
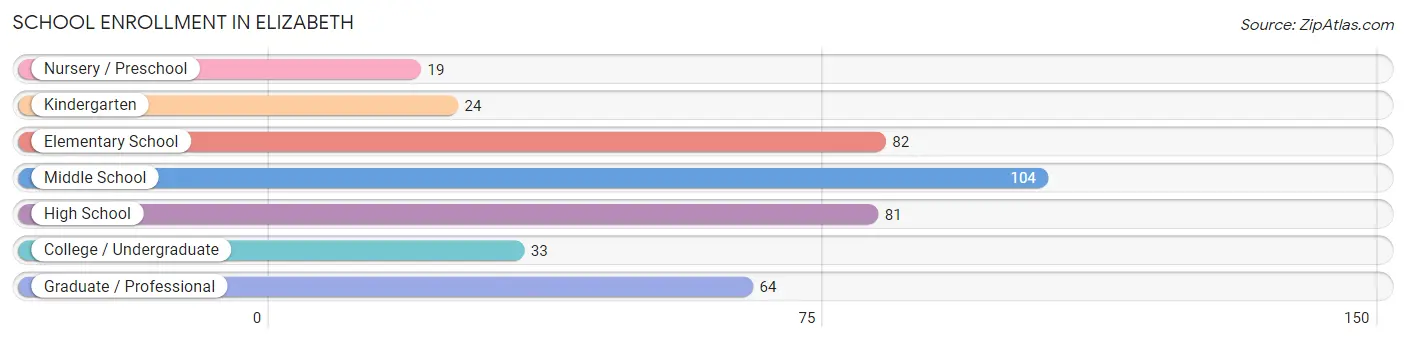
| School Level | # Students | % Students |
| Nursery / Preschool | 19 | 4.7% |
| Kindergarten | 24 | 5.9% |
| Elementary School | 82 | 20.2% |
| Middle School | 104 | 25.6% |
| High School | 81 | 19.9% |
| College / Undergraduate | 33 | 8.1% |
| Graduate / Professional | 64 | 15.7% |
| Total | 407 | 100.0% |
School Enrollment by Age by Funding Source in Elizabeth
Out of a total of 407 students who are enrolled in schools in Elizabeth, 93 (22.9%) attend a private institution, while the remaining 314 (77.1%) are enrolled in public schools. The age group of 3 to 4 year olds has the highest likelihood of being enrolled in private schools, with 7 (63.6% in the age bracket) enrolled. Conversely, the age group of 18 to 19 year olds has the lowest likelihood of being enrolled in a private school, with 12 (100.0% in the age bracket) attending a public institution.
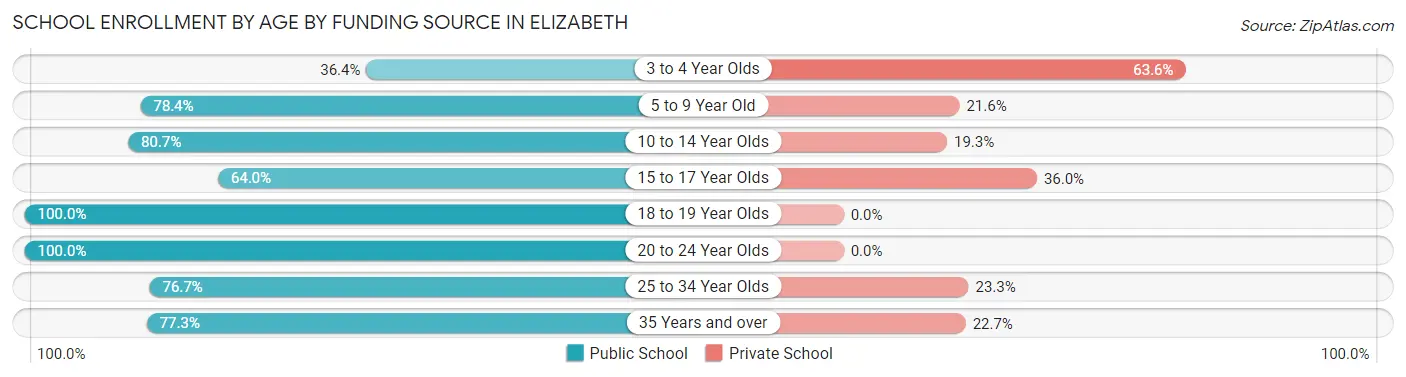
| Age Bracket | Public School | Private School |
| 3 to 4 Year Olds | 4 (36.4%) | 7 (63.6%) |
| 5 to 9 Year Old | 80 (78.4%) | 22 (21.6%) |
| 10 to 14 Year Olds | 109 (80.7%) | 26 (19.3%) |
| 15 to 17 Year Olds | 32 (64.0%) | 18 (36.0%) |
| 18 to 19 Year Olds | 12 (100.0%) | 0 (0.0%) |
| 20 to 24 Year Olds | 10 (100.0%) | 0 (0.0%) |
| 25 to 34 Year Olds | 33 (76.7%) | 10 (23.3%) |
| 35 Years and over | 34 (77.3%) | 10 (22.7%) |
| Total | 314 (77.1%) | 93 (22.9%) |
Educational Attainment by Field of Study in Elizabeth
Business (96 | 18.8%), psychology (82 | 16.1%), science & technology (73 | 14.3%), social sciences (53 | 10.4%), and education (50 | 9.8%) are the most common fields of study among 511 individuals in Elizabeth who have obtained a bachelor's degree or higher.
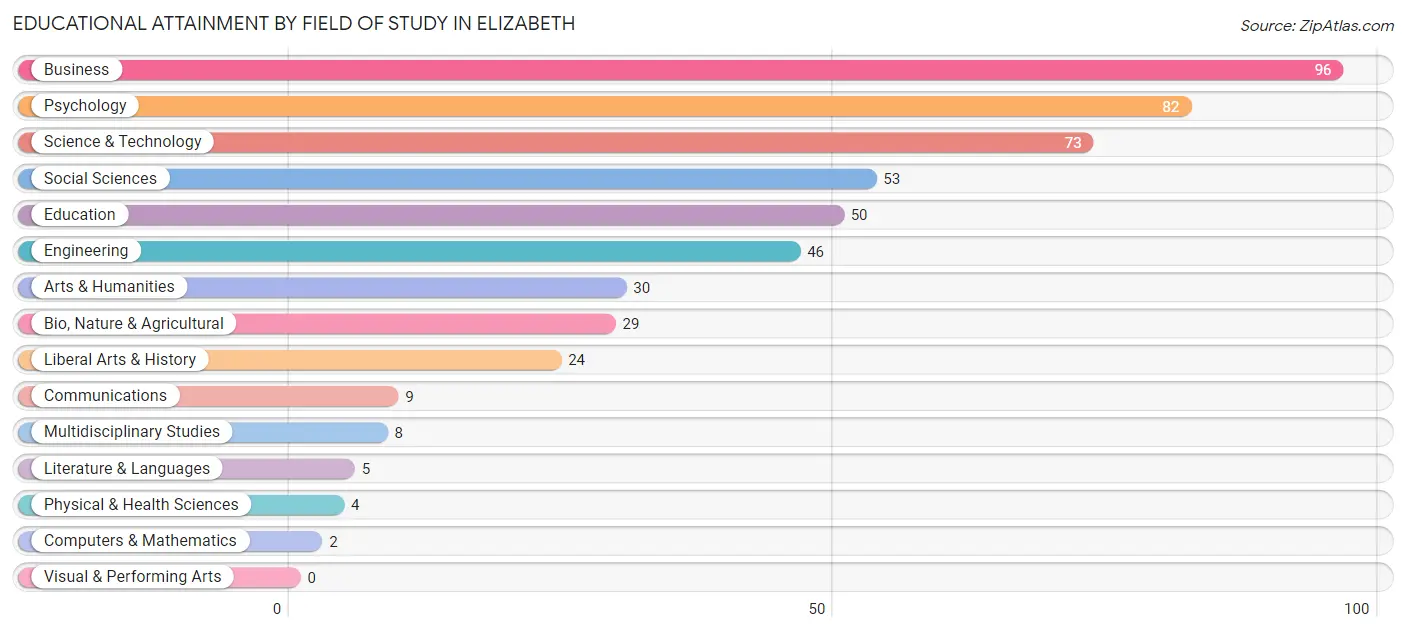
| Field of Study | # Graduates | % Graduates |
| Computers & Mathematics | 2 | 0.4% |
| Bio, Nature & Agricultural | 29 | 5.7% |
| Physical & Health Sciences | 4 | 0.8% |
| Psychology | 82 | 16.1% |
| Social Sciences | 53 | 10.4% |
| Engineering | 46 | 9.0% |
| Multidisciplinary Studies | 8 | 1.6% |
| Science & Technology | 73 | 14.3% |
| Business | 96 | 18.8% |
| Education | 50 | 9.8% |
| Literature & Languages | 5 | 1.0% |
| Liberal Arts & History | 24 | 4.7% |
| Visual & Performing Arts | 0 | 0.0% |
| Communications | 9 | 1.8% |
| Arts & Humanities | 30 | 5.9% |
| Total | 511 | 100.0% |
Transportation & Commute in Elizabeth
Vehicle Availability by Sex in Elizabeth
The most prevalent vehicle ownership categories in Elizabeth are males with 2 vehicles (264, accounting for 50.5%) and females with 2 vehicles (219, making up 54.1%).
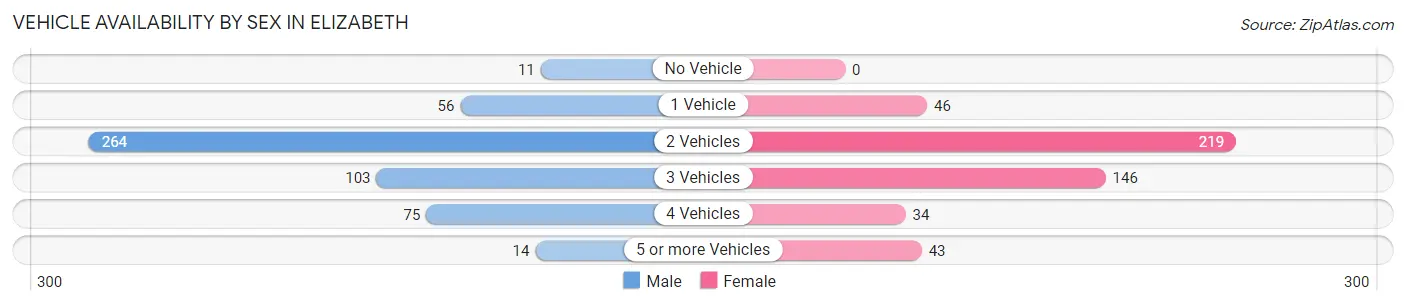
| Vehicles Available | Male | Female |
| No Vehicle | 11 (2.1%) | 0 (0.0%) |
| 1 Vehicle | 56 (10.7%) | 46 (9.4%) |
| 2 Vehicles | 264 (50.5%) | 219 (44.9%) |
| 3 Vehicles | 103 (19.7%) | 146 (29.9%) |
| 4 Vehicles | 75 (14.3%) | 34 (7.0%) |
| 5 or more Vehicles | 14 (2.7%) | 43 (8.8%) |
| Total | 523 (100.0%) | 488 (100.0%) |
Commute Time in Elizabeth
The most frequently occuring commute durations in Elizabeth are 60 to 89 minutes (220 commuters, 24.4%), 45 to 59 minutes (211 commuters, 23.4%), and 30 to 34 minutes (101 commuters, 11.2%).
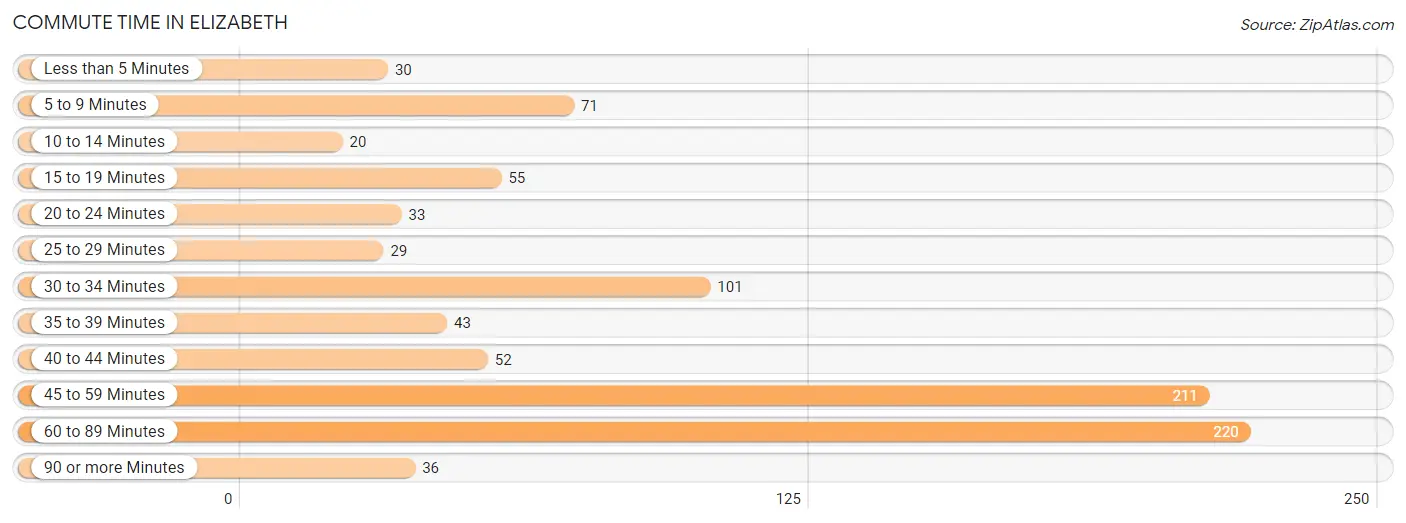
| Commute Time | # Commuters | % Commuters |
| Less than 5 Minutes | 30 | 3.3% |
| 5 to 9 Minutes | 71 | 7.9% |
| 10 to 14 Minutes | 20 | 2.2% |
| 15 to 19 Minutes | 55 | 6.1% |
| 20 to 24 Minutes | 33 | 3.7% |
| 25 to 29 Minutes | 29 | 3.2% |
| 30 to 34 Minutes | 101 | 11.2% |
| 35 to 39 Minutes | 43 | 4.8% |
| 40 to 44 Minutes | 52 | 5.8% |
| 45 to 59 Minutes | 211 | 23.4% |
| 60 to 89 Minutes | 220 | 24.4% |
| 90 or more Minutes | 36 | 4.0% |
Commute Time by Sex in Elizabeth
The most common commute times in Elizabeth are 45 to 59 minutes (168 commuters, 38.4%) for males and 60 to 89 minutes (169 commuters, 36.4%) for females.
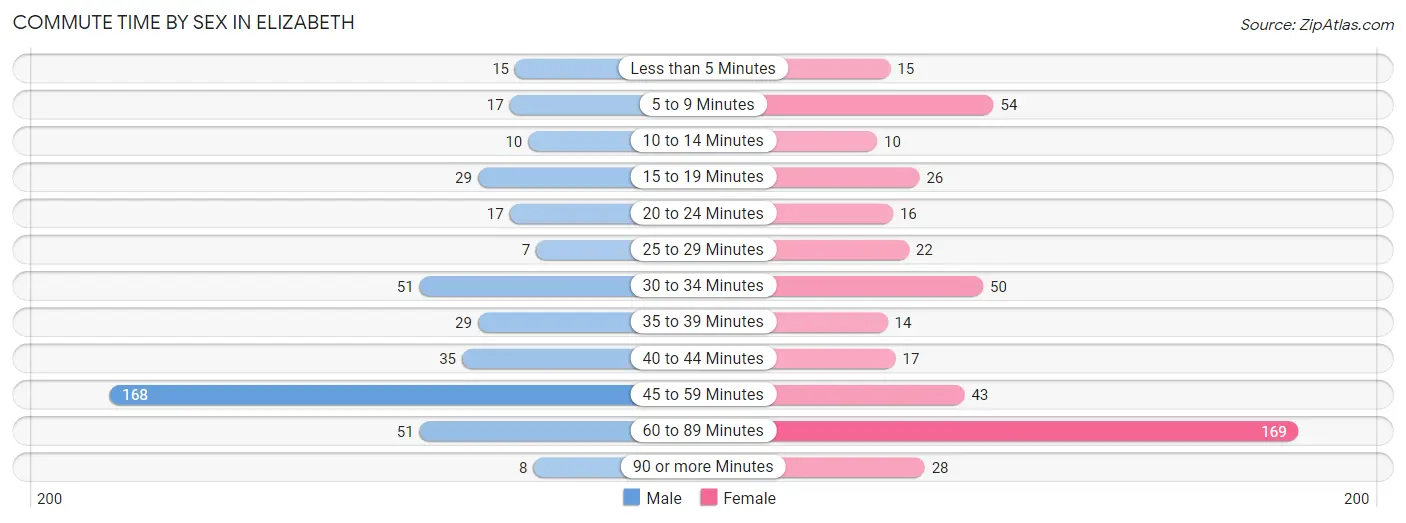
| Commute Time | Male | Female |
| Less than 5 Minutes | 15 (3.4%) | 15 (3.2%) |
| 5 to 9 Minutes | 17 (3.9%) | 54 (11.6%) |
| 10 to 14 Minutes | 10 (2.3%) | 10 (2.2%) |
| 15 to 19 Minutes | 29 (6.6%) | 26 (5.6%) |
| 20 to 24 Minutes | 17 (3.9%) | 16 (3.5%) |
| 25 to 29 Minutes | 7 (1.6%) | 22 (4.7%) |
| 30 to 34 Minutes | 51 (11.7%) | 50 (10.8%) |
| 35 to 39 Minutes | 29 (6.6%) | 14 (3.0%) |
| 40 to 44 Minutes | 35 (8.0%) | 17 (3.7%) |
| 45 to 59 Minutes | 168 (38.4%) | 43 (9.3%) |
| 60 to 89 Minutes | 51 (11.7%) | 169 (36.4%) |
| 90 or more Minutes | 8 (1.8%) | 28 (6.0%) |
Time of Departure to Work by Sex in Elizabeth
The most frequent times of departure to work in Elizabeth are 7:00 AM to 7:29 AM (72, 16.5%) for males and 7:00 AM to 7:29 AM (140, 30.2%) for females.
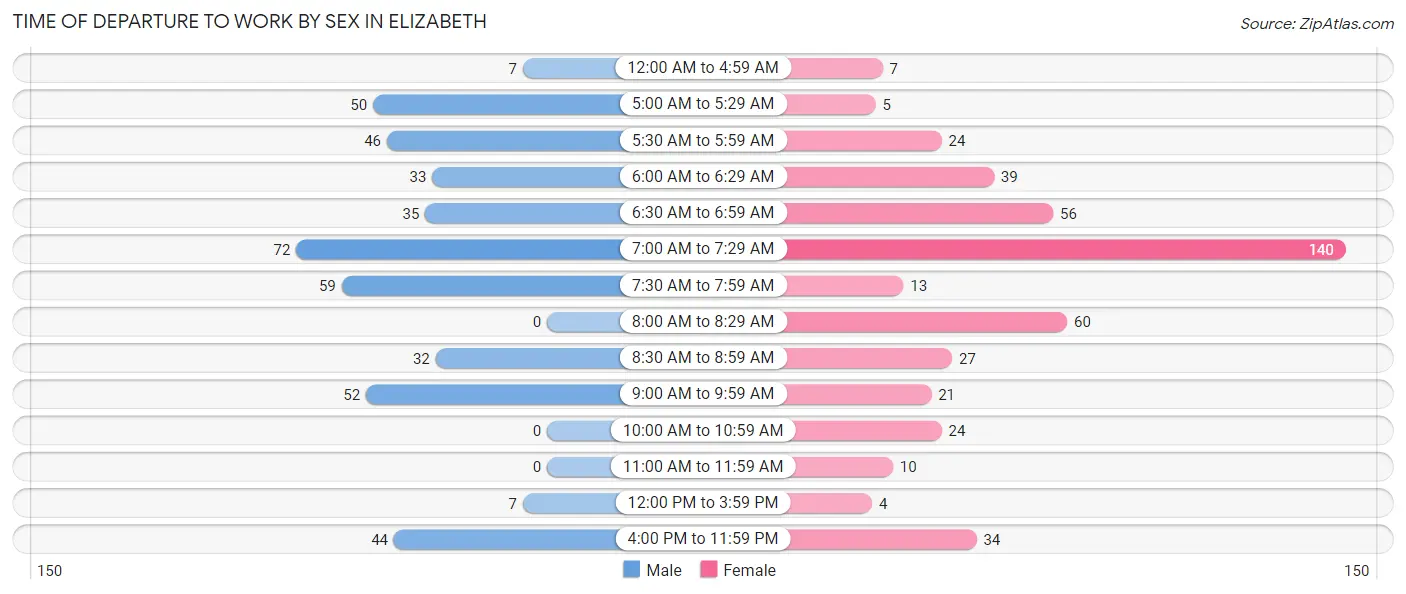
| Time of Departure | Male | Female |
| 12:00 AM to 4:59 AM | 7 (1.6%) | 7 (1.5%) |
| 5:00 AM to 5:29 AM | 50 (11.4%) | 5 (1.1%) |
| 5:30 AM to 5:59 AM | 46 (10.5%) | 24 (5.2%) |
| 6:00 AM to 6:29 AM | 33 (7.5%) | 39 (8.4%) |
| 6:30 AM to 6:59 AM | 35 (8.0%) | 56 (12.1%) |
| 7:00 AM to 7:29 AM | 72 (16.5%) | 140 (30.2%) |
| 7:30 AM to 7:59 AM | 59 (13.5%) | 13 (2.8%) |
| 8:00 AM to 8:29 AM | 0 (0.0%) | 60 (12.9%) |
| 8:30 AM to 8:59 AM | 32 (7.3%) | 27 (5.8%) |
| 9:00 AM to 9:59 AM | 52 (11.9%) | 21 (4.5%) |
| 10:00 AM to 10:59 AM | 0 (0.0%) | 24 (5.2%) |
| 11:00 AM to 11:59 AM | 0 (0.0%) | 10 (2.2%) |
| 12:00 PM to 3:59 PM | 7 (1.6%) | 4 (0.9%) |
| 4:00 PM to 11:59 PM | 44 (10.1%) | 34 (7.3%) |
| Total | 437 (100.0%) | 464 (100.0%) |
Housing Occupancy in Elizabeth
Occupancy by Ownership in Elizabeth
Of the total 692 dwellings in Elizabeth, owner-occupied units account for 591 (85.4%), while renter-occupied units make up 101 (14.6%).
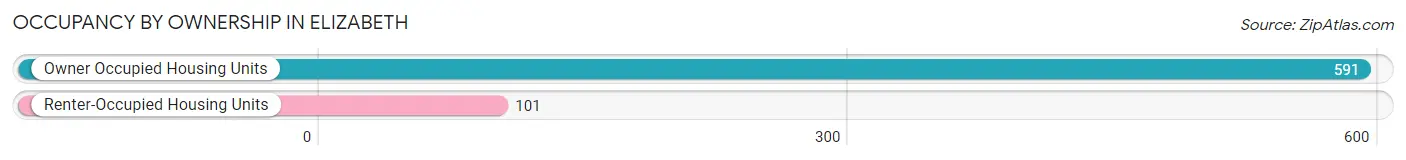
| Occupancy | # Housing Units | % Housing Units |
| Owner Occupied Housing Units | 591 | 85.4% |
| Renter-Occupied Housing Units | 101 | 14.6% |
| Total Occupied Housing Units | 692 | 100.0% |
Occupancy by Household Size in Elizabeth
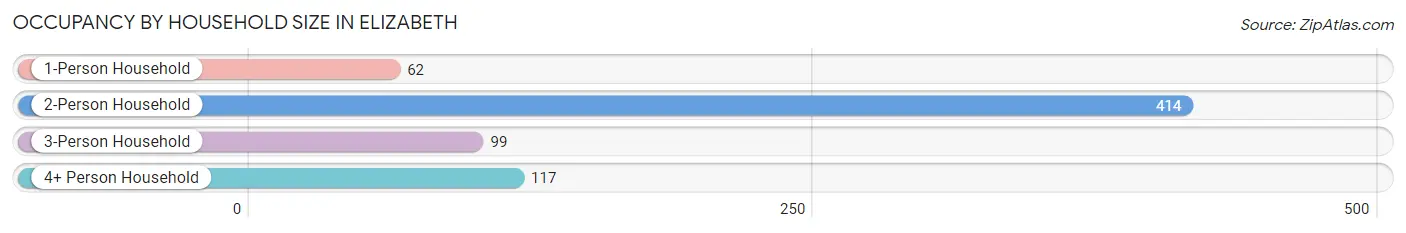
| Household Size | # Housing Units | % Housing Units |
| 1-Person Household | 62 | 9.0% |
| 2-Person Household | 414 | 59.8% |
| 3-Person Household | 99 | 14.3% |
| 4+ Person Household | 117 | 16.9% |
| Total Housing Units | 692 | 100.0% |
Occupancy by Ownership by Household Size in Elizabeth
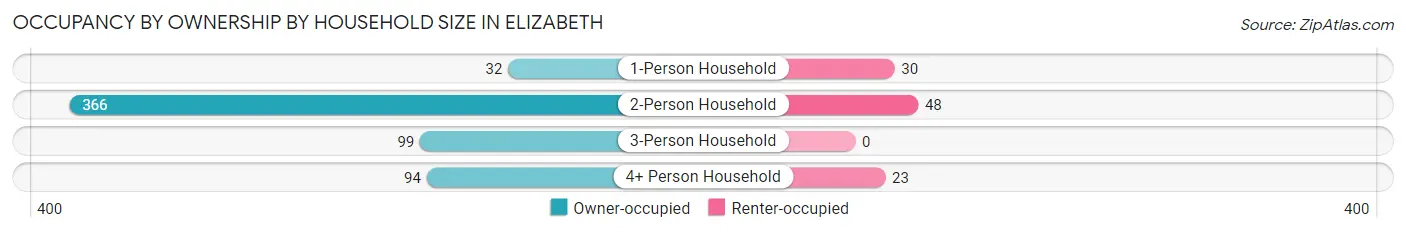
| Household Size | Owner-occupied | Renter-occupied |
| 1-Person Household | 32 (51.6%) | 30 (48.4%) |
| 2-Person Household | 366 (88.4%) | 48 (11.6%) |
| 3-Person Household | 99 (100.0%) | 0 (0.0%) |
| 4+ Person Household | 94 (80.3%) | 23 (19.7%) |
| Total Housing Units | 591 (85.4%) | 101 (14.6%) |
Occupancy by Educational Attainment in Elizabeth
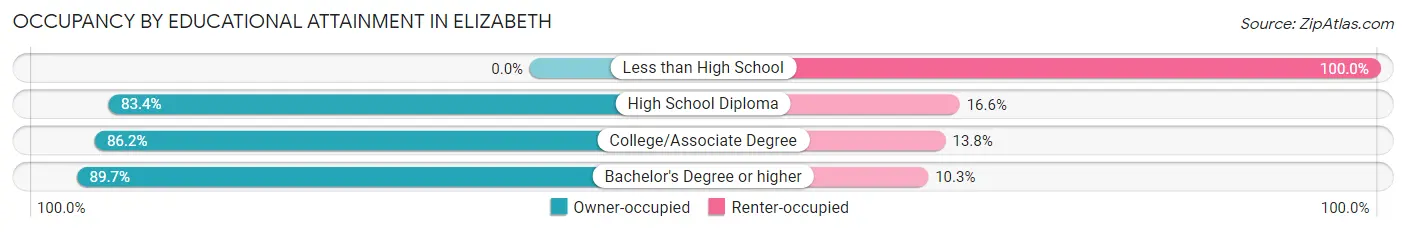
| Household Size | Owner-occupied | Renter-occupied |
| Less than High School | 0 (0.0%) | 12 (100.0%) |
| High School Diploma | 151 (83.4%) | 30 (16.6%) |
| College/Associate Degree | 188 (86.2%) | 30 (13.8%) |
| Bachelor's Degree or higher | 252 (89.7%) | 29 (10.3%) |
Occupancy by Age of Householder in Elizabeth
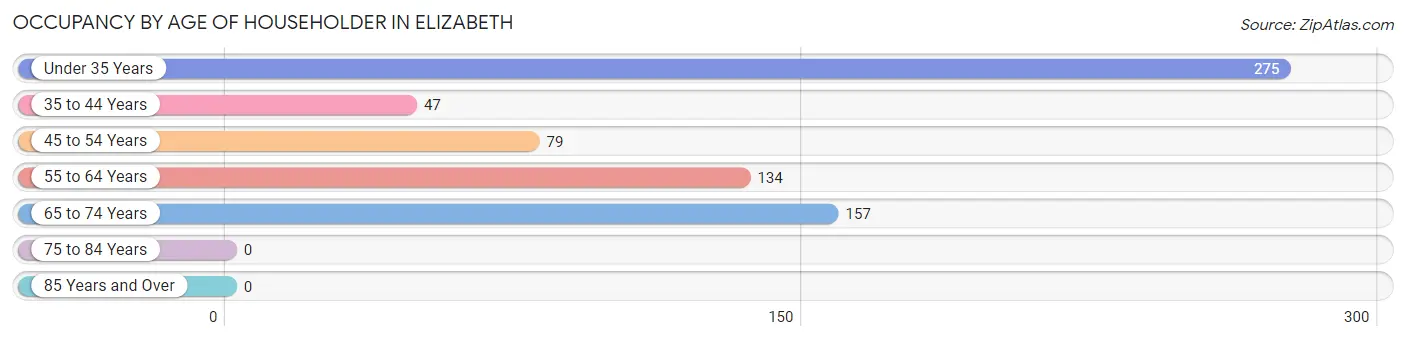
| Age Bracket | # Households | % Households |
| Under 35 Years | 275 | 39.7% |
| 35 to 44 Years | 47 | 6.8% |
| 45 to 54 Years | 79 | 11.4% |
| 55 to 64 Years | 134 | 19.4% |
| 65 to 74 Years | 157 | 22.7% |
| 75 to 84 Years | 0 | 0.0% |
| 85 Years and Over | 0 | 0.0% |
| Total | 692 | 100.0% |
Housing Finances in Elizabeth
Median Income by Occupancy in Elizabeth
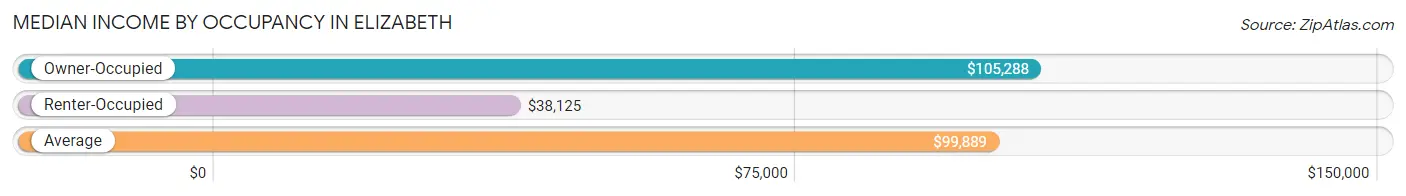
| Occupancy Type | # Households | Median Income |
| Owner-Occupied | 591 (85.4%) | $105,288 |
| Renter-Occupied | 101 (14.6%) | $38,125 |
| Average | 692 (100.0%) | $99,889 |
Occupancy by Householder Income Bracket in Elizabeth
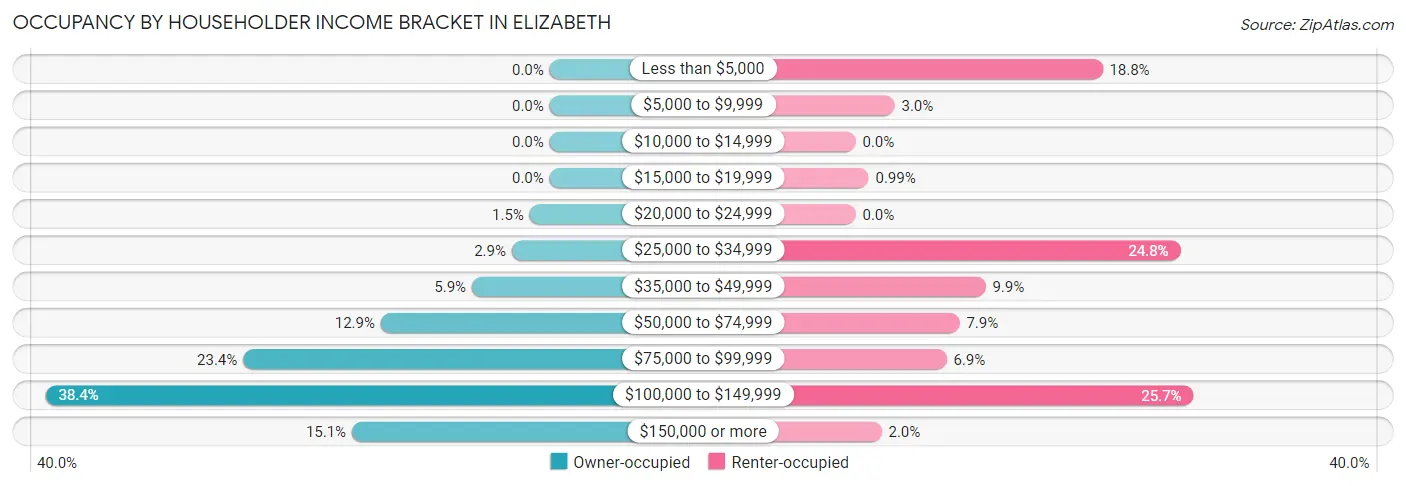
| Income Bracket | Owner-occupied | Renter-occupied |
| Less than $5,000 | 0 (0.0%) | 19 (18.8%) |
| $5,000 to $9,999 | 0 (0.0%) | 3 (3.0%) |
| $10,000 to $14,999 | 0 (0.0%) | 0 (0.0%) |
| $15,000 to $19,999 | 0 (0.0%) | 1 (1.0%) |
| $20,000 to $24,999 | 9 (1.5%) | 0 (0.0%) |
| $25,000 to $34,999 | 17 (2.9%) | 25 (24.7%) |
| $35,000 to $49,999 | 35 (5.9%) | 10 (9.9%) |
| $50,000 to $74,999 | 76 (12.9%) | 8 (7.9%) |
| $75,000 to $99,999 | 138 (23.4%) | 7 (6.9%) |
| $100,000 to $149,999 | 227 (38.4%) | 26 (25.7%) |
| $150,000 or more | 89 (15.1%) | 2 (2.0%) |
| Total | 591 (100.0%) | 101 (100.0%) |
Monthly Housing Cost Tiers in Elizabeth
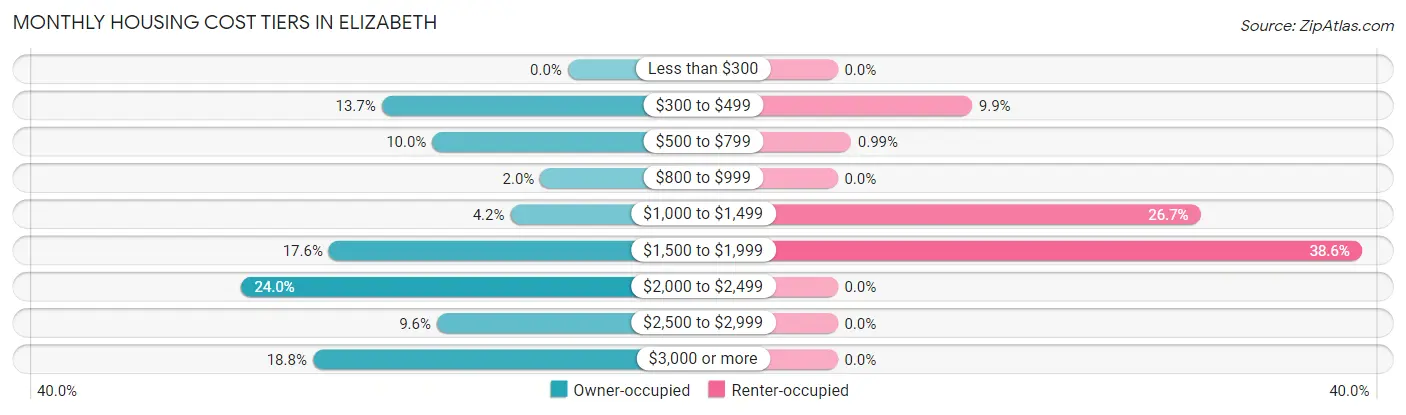
| Monthly Cost | Owner-occupied | Renter-occupied |
| Less than $300 | 0 (0.0%) | 0 (0.0%) |
| $300 to $499 | 81 (13.7%) | 10 (9.9%) |
| $500 to $799 | 59 (10.0%) | 1 (1.0%) |
| $800 to $999 | 12 (2.0%) | 0 (0.0%) |
| $1,000 to $1,499 | 25 (4.2%) | 27 (26.7%) |
| $1,500 to $1,999 | 104 (17.6%) | 39 (38.6%) |
| $2,000 to $2,499 | 142 (24.0%) | 0 (0.0%) |
| $2,500 to $2,999 | 57 (9.6%) | 0 (0.0%) |
| $3,000 or more | 111 (18.8%) | 0 (0.0%) |
| Total | 591 (100.0%) | 101 (100.0%) |
Physical Housing Characteristics in Elizabeth
Housing Structures in Elizabeth
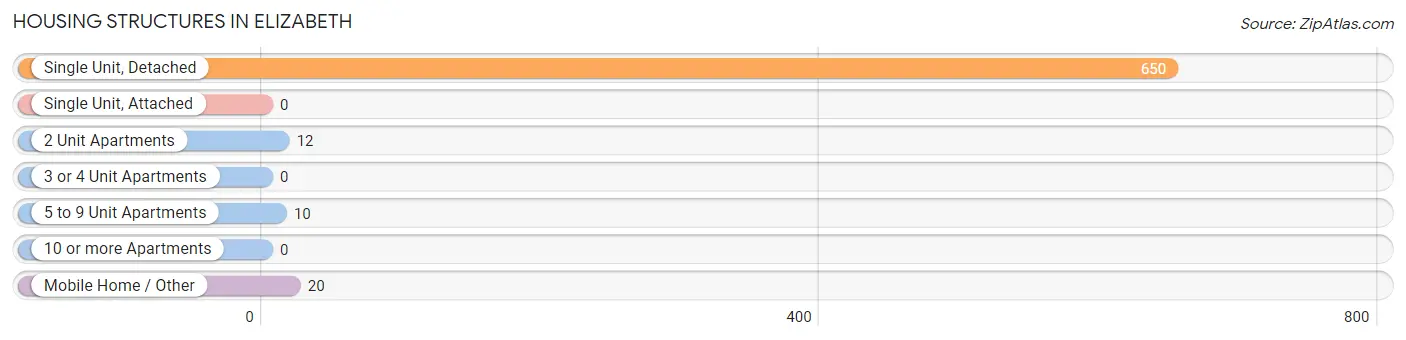
| Structure Type | # Housing Units | % Housing Units |
| Single Unit, Detached | 650 | 93.9% |
| Single Unit, Attached | 0 | 0.0% |
| 2 Unit Apartments | 12 | 1.7% |
| 3 or 4 Unit Apartments | 0 | 0.0% |
| 5 to 9 Unit Apartments | 10 | 1.5% |
| 10 or more Apartments | 0 | 0.0% |
| Mobile Home / Other | 20 | 2.9% |
| Total | 692 | 100.0% |
Housing Structures by Occupancy in Elizabeth
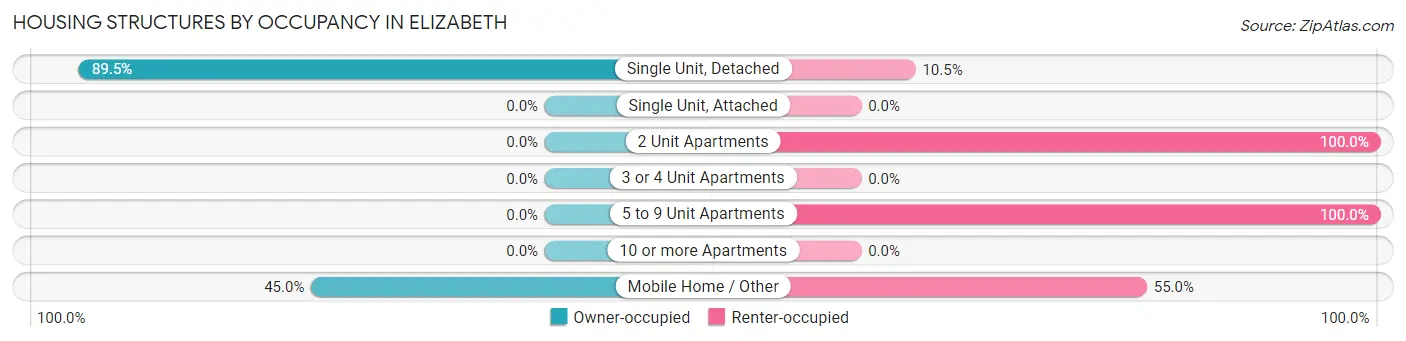
| Structure Type | Owner-occupied | Renter-occupied |
| Single Unit, Detached | 582 (89.5%) | 68 (10.5%) |
| Single Unit, Attached | 0 (0.0%) | 0 (0.0%) |
| 2 Unit Apartments | 0 (0.0%) | 12 (100.0%) |
| 3 or 4 Unit Apartments | 0 (0.0%) | 0 (0.0%) |
| 5 to 9 Unit Apartments | 0 (0.0%) | 10 (100.0%) |
| 10 or more Apartments | 0 (0.0%) | 0 (0.0%) |
| Mobile Home / Other | 9 (45.0%) | 11 (55.0%) |
| Total | 591 (85.4%) | 101 (14.6%) |
Housing Structures by Number of Rooms in Elizabeth
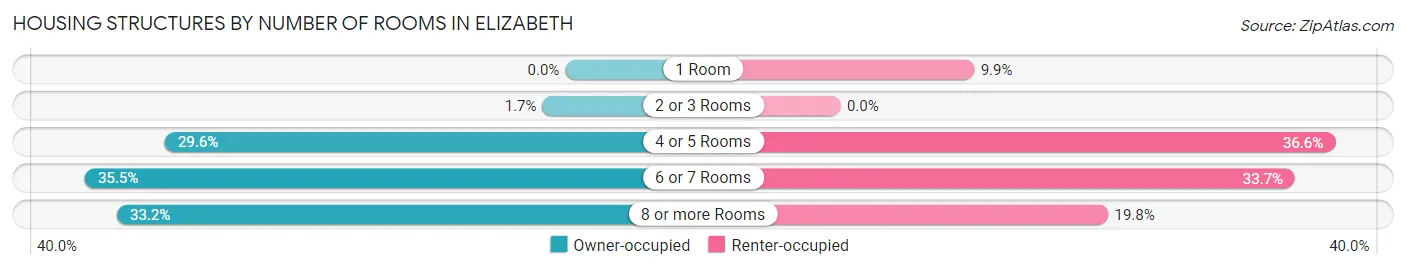
| Number of Rooms | Owner-occupied | Renter-occupied |
| 1 Room | 0 (0.0%) | 10 (9.9%) |
| 2 or 3 Rooms | 10 (1.7%) | 0 (0.0%) |
| 4 or 5 Rooms | 175 (29.6%) | 37 (36.6%) |
| 6 or 7 Rooms | 210 (35.5%) | 34 (33.7%) |
| 8 or more Rooms | 196 (33.2%) | 20 (19.8%) |
| Total | 591 (100.0%) | 101 (100.0%) |
Housing Structure by Heating Type in Elizabeth
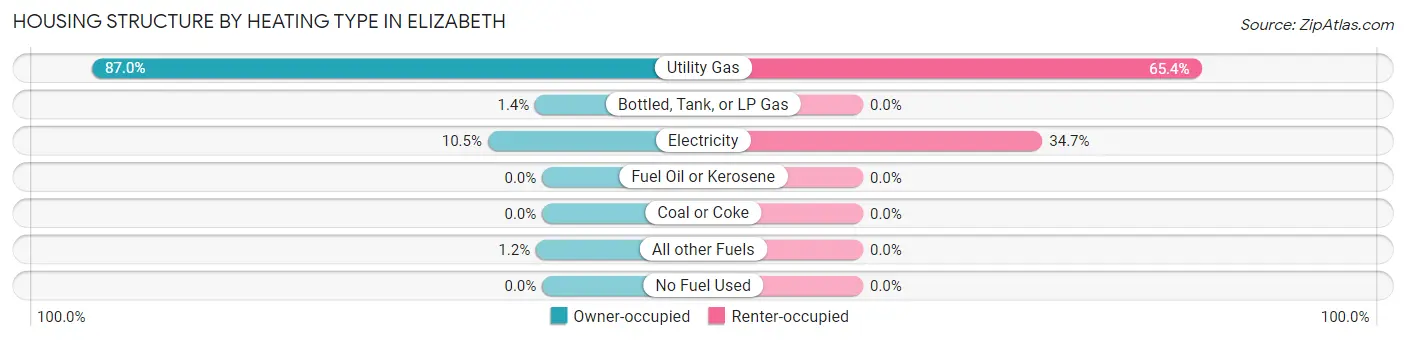
| Heating Type | Owner-occupied | Renter-occupied |
| Utility Gas | 514 (87.0%) | 66 (65.3%) |
| Bottled, Tank, or LP Gas | 8 (1.3%) | 0 (0.0%) |
| Electricity | 62 (10.5%) | 35 (34.6%) |
| Fuel Oil or Kerosene | 0 (0.0%) | 0 (0.0%) |
| Coal or Coke | 0 (0.0%) | 0 (0.0%) |
| All other Fuels | 7 (1.2%) | 0 (0.0%) |
| No Fuel Used | 0 (0.0%) | 0 (0.0%) |
| Total | 591 (100.0%) | 101 (100.0%) |
Household Vehicle Usage in Elizabeth
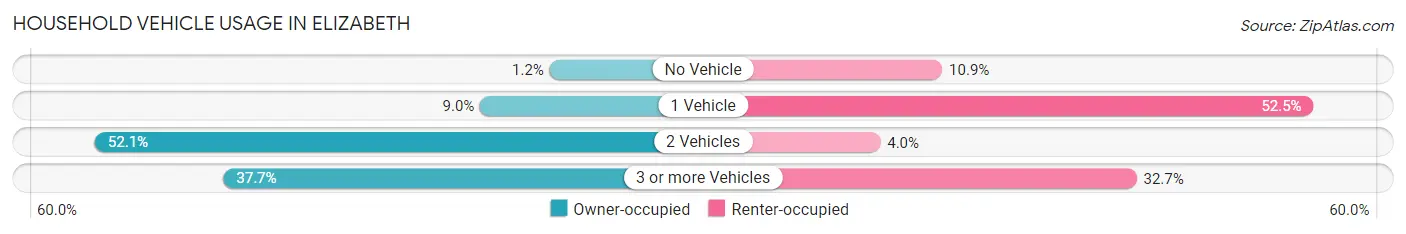
| Vehicles per Household | Owner-occupied | Renter-occupied |
| No Vehicle | 7 (1.2%) | 11 (10.9%) |
| 1 Vehicle | 53 (9.0%) | 53 (52.5%) |
| 2 Vehicles | 308 (52.1%) | 4 (4.0%) |
| 3 or more Vehicles | 223 (37.7%) | 33 (32.7%) |
| Total | 591 (100.0%) | 101 (100.0%) |
Real Estate & Mortgages in Elizabeth
Real Estate and Mortgage Overview in Elizabeth
| Characteristic | Without Mortgage | With Mortgage |
| Housing Units | 152 | 439 |
| Median Property Value | $355,700 | $426,200 |
| Median Household Income | $80,000 | $69 |
| Monthly Housing Costs | $493 | $111 |
| Real Estate Taxes | $2,558 | $12 |
Property Value by Mortgage Status in Elizabeth
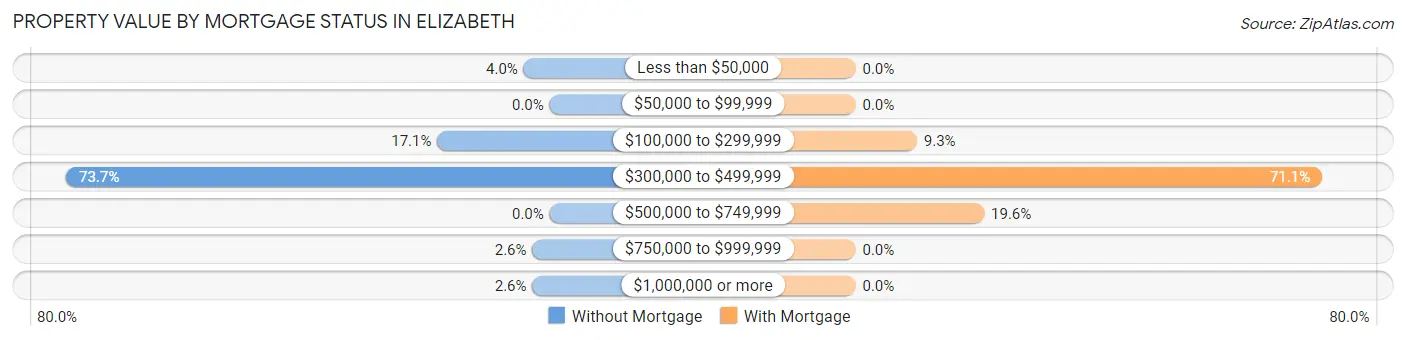
| Property Value | Without Mortgage | With Mortgage |
| Less than $50,000 | 6 (4.0%) | 0 (0.0%) |
| $50,000 to $99,999 | 0 (0.0%) | 0 (0.0%) |
| $100,000 to $299,999 | 26 (17.1%) | 41 (9.3%) |
| $300,000 to $499,999 | 112 (73.7%) | 312 (71.1%) |
| $500,000 to $749,999 | 0 (0.0%) | 86 (19.6%) |
| $750,000 to $999,999 | 4 (2.6%) | 0 (0.0%) |
| $1,000,000 or more | 4 (2.6%) | 0 (0.0%) |
| Total | 152 (100.0%) | 439 (100.0%) |
Household Income by Mortgage Status in Elizabeth
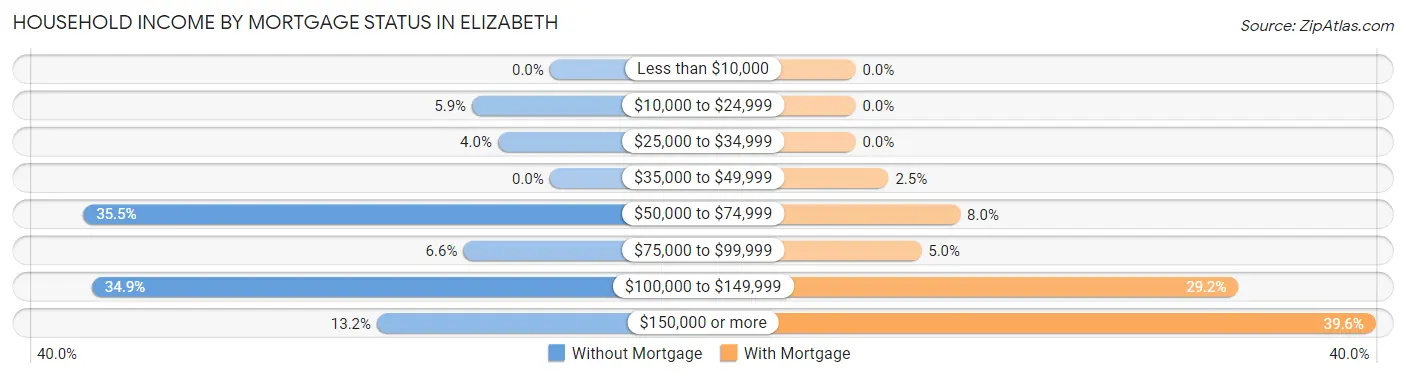
| Household Income | Without Mortgage | With Mortgage |
| Less than $10,000 | 0 (0.0%) | 0 (0.0%) |
| $10,000 to $24,999 | 9 (5.9%) | 0 (0.0%) |
| $25,000 to $34,999 | 6 (4.0%) | 0 (0.0%) |
| $35,000 to $49,999 | 0 (0.0%) | 11 (2.5%) |
| $50,000 to $74,999 | 54 (35.5%) | 35 (8.0%) |
| $75,000 to $99,999 | 10 (6.6%) | 22 (5.0%) |
| $100,000 to $149,999 | 53 (34.9%) | 128 (29.2%) |
| $150,000 or more | 20 (13.2%) | 174 (39.6%) |
| Total | 152 (100.0%) | 439 (100.0%) |
Property Value to Household Income Ratio in Elizabeth
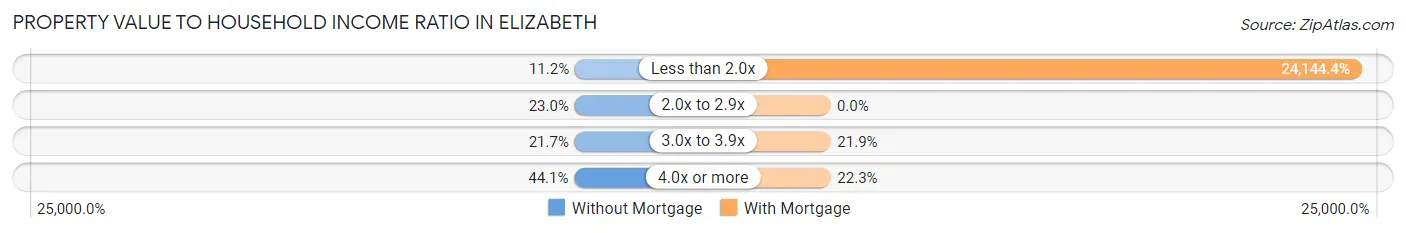
| Value-to-Income Ratio | Without Mortgage | With Mortgage |
| Less than 2.0x | 17 (11.2%) | 105,994 (24,144.4%) |
| 2.0x to 2.9x | 35 (23.0%) | 0 (0.0%) |
| 3.0x to 3.9x | 33 (21.7%) | 96 (21.9%) |
| 4.0x or more | 67 (44.1%) | 98 (22.3%) |
| Total | 152 (100.0%) | 439 (100.0%) |
Real Estate Taxes by Mortgage Status in Elizabeth
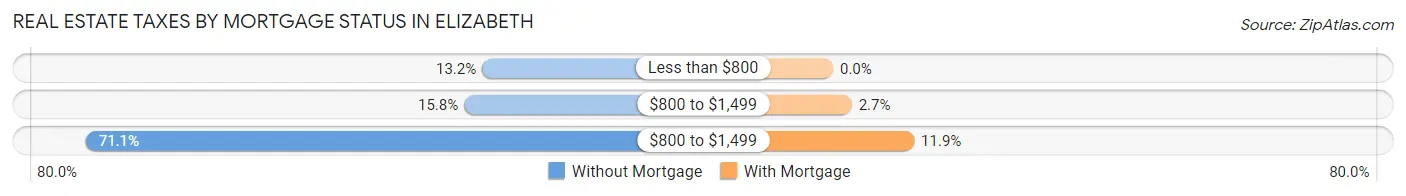
| Property Taxes | Without Mortgage | With Mortgage |
| Less than $800 | 20 (13.2%) | 0 (0.0%) |
| $800 to $1,499 | 24 (15.8%) | 12 (2.7%) |
| $800 to $1,499 | 108 (71.1%) | 52 (11.8%) |
| Total | 152 (100.0%) | 439 (100.0%) |
Health & Disability in Elizabeth
Health Insurance Coverage by Age in Elizabeth
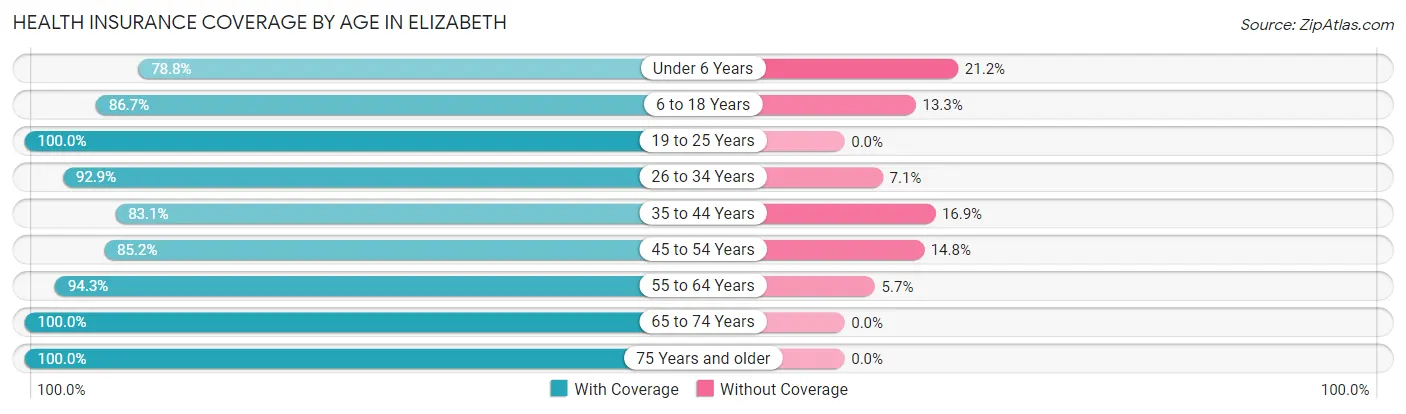
| Age Bracket | With Coverage | Without Coverage |
| Under 6 Years | 93 (78.8%) | 25 (21.2%) |
| 6 to 18 Years | 248 (86.7%) | 38 (13.3%) |
| 19 to 25 Years | 136 (100.0%) | 0 (0.0%) |
| 26 to 34 Years | 429 (92.9%) | 33 (7.1%) |
| 35 to 44 Years | 118 (83.1%) | 24 (16.9%) |
| 45 to 54 Years | 115 (85.2%) | 20 (14.8%) |
| 55 to 64 Years | 250 (94.3%) | 15 (5.7%) |
| 65 to 74 Years | 245 (100.0%) | 0 (0.0%) |
| 75 Years and older | 41 (100.0%) | 0 (0.0%) |
| Total | 1,675 (91.5%) | 155 (8.5%) |
Health Insurance Coverage by Citizenship Status in Elizabeth
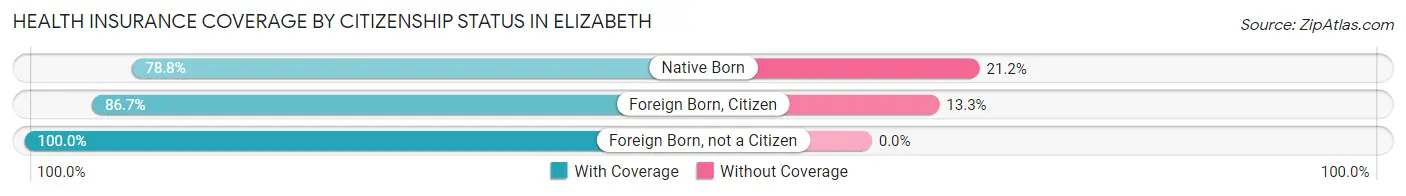
| Citizenship Status | With Coverage | Without Coverage |
| Native Born | 93 (78.8%) | 25 (21.2%) |
| Foreign Born, Citizen | 248 (86.7%) | 38 (13.3%) |
| Foreign Born, not a Citizen | 136 (100.0%) | 0 (0.0%) |
Health Insurance Coverage by Household Income in Elizabeth
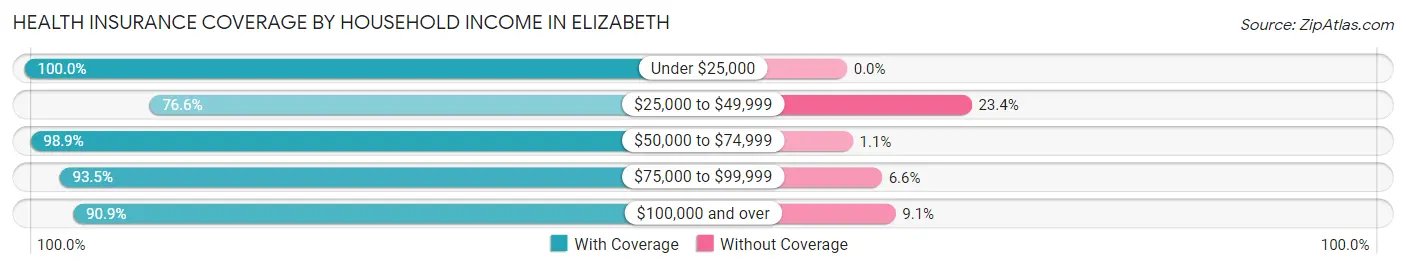
| Household Income | With Coverage | Without Coverage |
| Under $25,000 | 81 (100.0%) | 0 (0.0%) |
| $25,000 to $49,999 | 105 (76.6%) | 32 (23.4%) |
| $50,000 to $74,999 | 183 (98.9%) | 2 (1.1%) |
| $75,000 to $99,999 | 314 (93.4%) | 22 (6.6%) |
| $100,000 and over | 989 (90.9%) | 99 (9.1%) |
Public vs Private Health Insurance Coverage by Age in Elizabeth
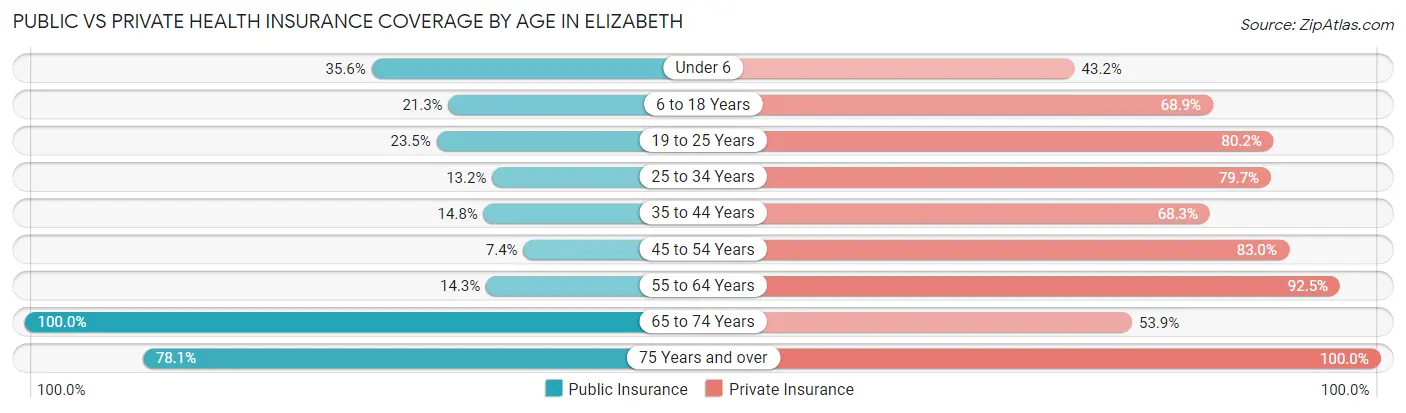
| Age Bracket | Public Insurance | Private Insurance |
| Under 6 | 42 (35.6%) | 51 (43.2%) |
| 6 to 18 Years | 61 (21.3%) | 197 (68.9%) |
| 19 to 25 Years | 32 (23.5%) | 109 (80.1%) |
| 25 to 34 Years | 61 (13.2%) | 368 (79.6%) |
| 35 to 44 Years | 21 (14.8%) | 97 (68.3%) |
| 45 to 54 Years | 10 (7.4%) | 112 (83.0%) |
| 55 to 64 Years | 38 (14.3%) | 245 (92.4%) |
| 65 to 74 Years | 245 (100.0%) | 132 (53.9%) |
| 75 Years and over | 32 (78.0%) | 41 (100.0%) |
| Total | 542 (29.6%) | 1,352 (73.9%) |
Disability Status by Sex by Age in Elizabeth
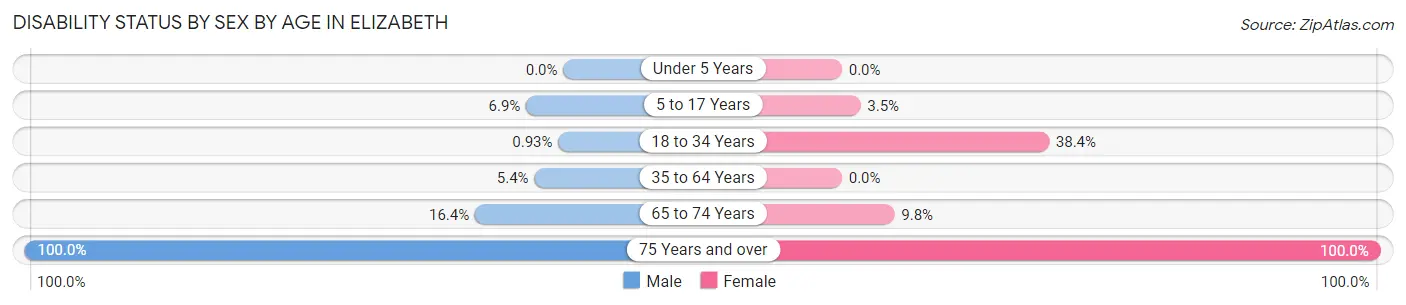
| Age Bracket | Male | Female |
| Under 5 Years | 0 (0.0%) | 0 (0.0%) |
| 5 to 17 Years | 10 (6.9%) | 5 (3.5%) |
| 18 to 34 Years | 3 (0.9%) | 108 (38.4%) |
| 35 to 64 Years | 13 (5.4%) | 0 (0.0%) |
| 65 to 74 Years | 20 (16.4%) | 12 (9.8%) |
| 75 Years and over | 16 (100.0%) | 25 (100.0%) |
Disability Class by Sex by Age in Elizabeth
Disability Class: Hearing Difficulty
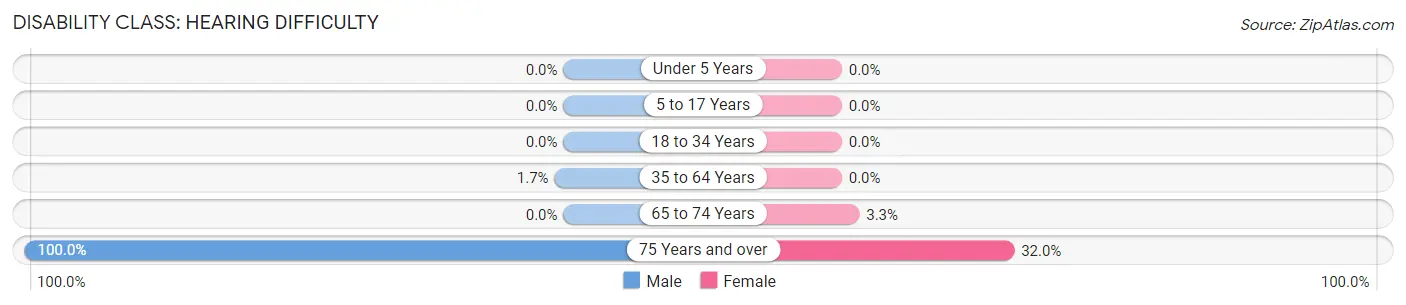
| Age Bracket | Male | Female |
| Under 5 Years | 0 (0.0%) | 0 (0.0%) |
| 5 to 17 Years | 0 (0.0%) | 0 (0.0%) |
| 18 to 34 Years | 0 (0.0%) | 0 (0.0%) |
| 35 to 64 Years | 4 (1.7%) | 0 (0.0%) |
| 65 to 74 Years | 0 (0.0%) | 4 (3.3%) |
| 75 Years and over | 16 (100.0%) | 8 (32.0%) |
Disability Class: Vision Difficulty
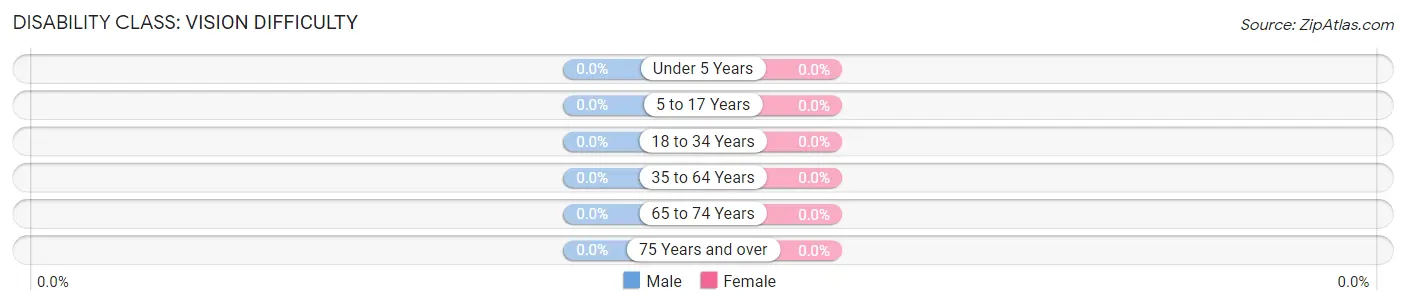
| Age Bracket | Male | Female |
| Under 5 Years | 0 (0.0%) | 0 (0.0%) |
| 5 to 17 Years | 0 (0.0%) | 0 (0.0%) |
| 18 to 34 Years | 0 (0.0%) | 0 (0.0%) |
| 35 to 64 Years | 0 (0.0%) | 0 (0.0%) |
| 65 to 74 Years | 0 (0.0%) | 0 (0.0%) |
| 75 Years and over | 0 (0.0%) | 0 (0.0%) |
Disability Class: Cognitive Difficulty
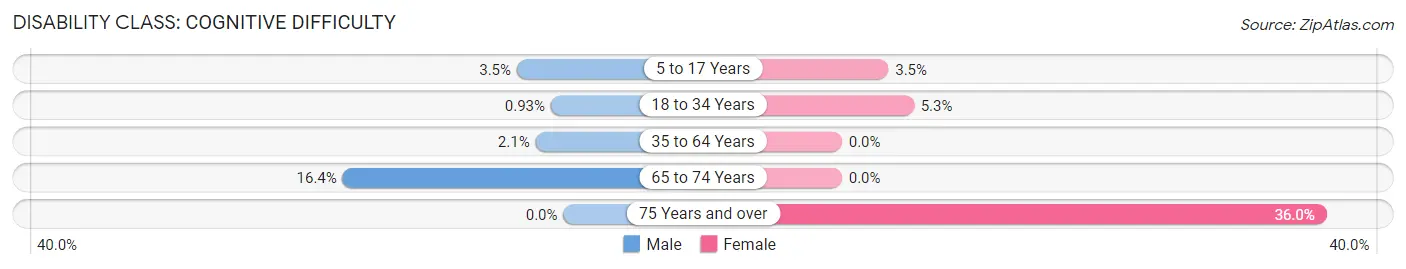
| Age Bracket | Male | Female |
| 5 to 17 Years | 5 (3.5%) | 5 (3.5%) |
| 18 to 34 Years | 3 (0.9%) | 15 (5.3%) |
| 35 to 64 Years | 5 (2.1%) | 0 (0.0%) |
| 65 to 74 Years | 20 (16.4%) | 0 (0.0%) |
| 75 Years and over | 0 (0.0%) | 9 (36.0%) |
Disability Class: Ambulatory Difficulty
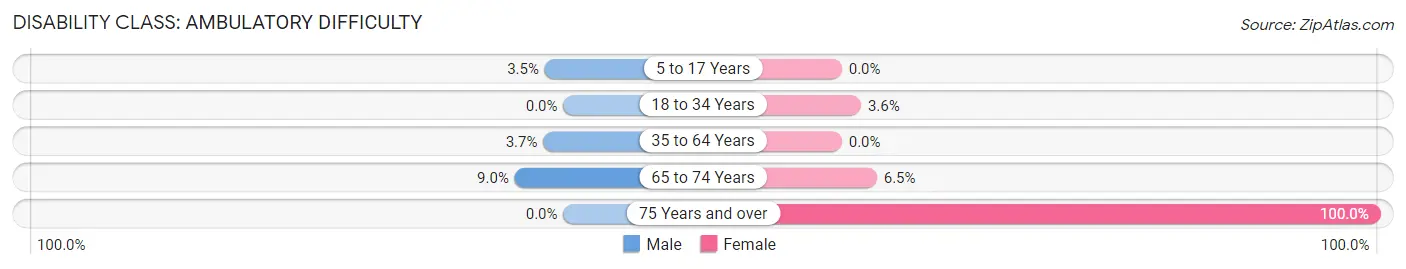
| Age Bracket | Male | Female |
| 5 to 17 Years | 5 (3.5%) | 0 (0.0%) |
| 18 to 34 Years | 0 (0.0%) | 10 (3.6%) |
| 35 to 64 Years | 9 (3.7%) | 0 (0.0%) |
| 65 to 74 Years | 11 (9.0%) | 8 (6.5%) |
| 75 Years and over | 0 (0.0%) | 25 (100.0%) |
Disability Class: Self-Care Difficulty
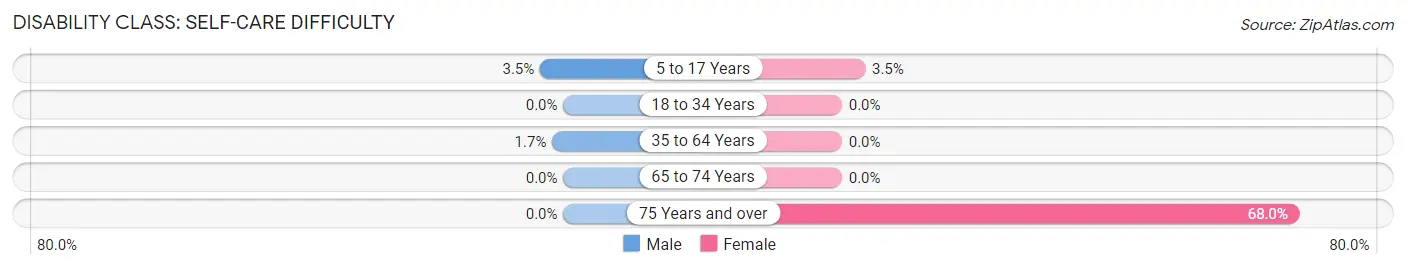
| Age Bracket | Male | Female |
| 5 to 17 Years | 5 (3.5%) | 5 (3.5%) |
| 18 to 34 Years | 0 (0.0%) | 0 (0.0%) |
| 35 to 64 Years | 4 (1.7%) | 0 (0.0%) |
| 65 to 74 Years | 0 (0.0%) | 0 (0.0%) |
| 75 Years and over | 0 (0.0%) | 17 (68.0%) |
Technology Access in Elizabeth
Computing Device Access in Elizabeth
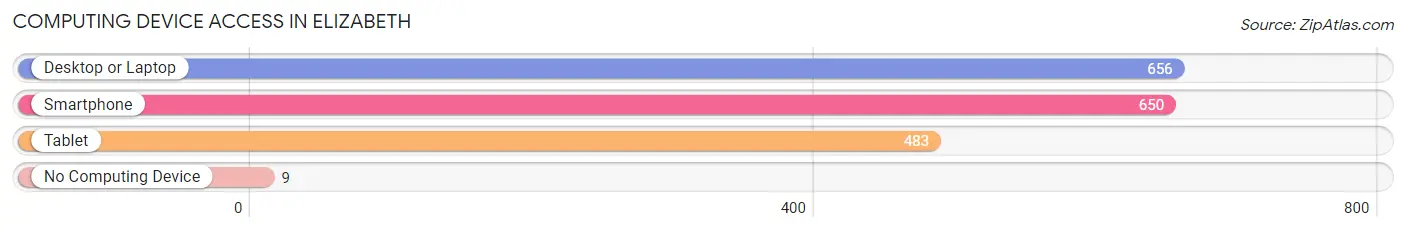
| Device Type | # Households | % Households |
| Desktop or Laptop | 656 | 94.8% |
| Smartphone | 650 | 93.9% |
| Tablet | 483 | 69.8% |
| No Computing Device | 9 | 1.3% |
| Total | 692 | 100.0% |
Internet Access in Elizabeth
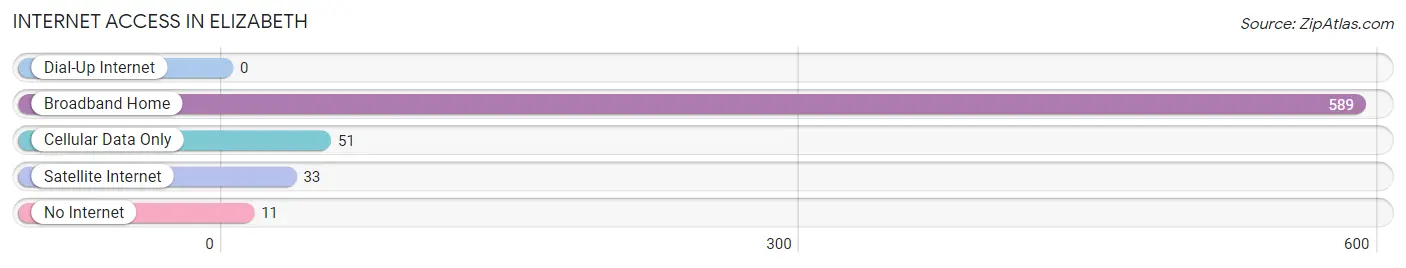
| Internet Type | # Households | % Households |
| Dial-Up Internet | 0 | 0.0% |
| Broadband Home | 589 | 85.1% |
| Cellular Data Only | 51 | 7.4% |
| Satellite Internet | 33 | 4.8% |
| No Internet | 11 | 1.6% |
| Total | 692 | 100.0% |
Elizabeth Summary
Elizabeth, Colorado is a small town located in Elbert County, Colorado. It is situated in the foothills of the Rocky Mountains, approximately 25 miles southeast of Denver. The town was founded in 1859 and is named after Elizabeth Byers, the wife of one of the original settlers. Elizabeth has a population of approximately 2,000 people and is known for its rural charm and small-town atmosphere.
Geography
Elizabeth is located in the foothills of the Rocky Mountains, at an elevation of 5,945 feet. The town is situated in the South Platte River Valley, which is surrounded by rolling hills and open plains. The town is located in Elbert County, which is the second largest county in Colorado. The county is home to a variety of wildlife, including deer, elk, antelope, and bighorn sheep.
The climate in Elizabeth is semi-arid, with hot summers and cold winters. The average temperature in the summer is around 80 degrees Fahrenheit, while the average temperature in the winter is around 20 degrees Fahrenheit. The town receives an average of 16 inches of precipitation per year, with most of it falling in the spring and summer months.
Economy
Elizabeth’s economy is largely based on agriculture and ranching. The town is home to several large farms and ranches, which produce a variety of crops and livestock. The town is also home to several small businesses, including restaurants, retail stores, and service providers.
The town is also home to several manufacturing companies, including a plastics factory and a metal fabrication plant. The town is also home to a number of oil and gas companies, which are involved in the exploration and production of oil and gas in the area.
Demographics
As of the 2010 census, the population of Elizabeth was 2,039. The racial makeup of the town was 94.3% White, 0.7% African American, 0.3% Native American, 0.3% Asian, 0.1% Pacific Islander, 2.2% from other races, and 2.3% from two or more races. Hispanic or Latino of any race were 5.3% of the population.
The median household income in Elizabeth was $50,938, and the median family income was $58,906. The per capita income for the town was $22,945. About 8.3% of families and 10.2% of the population were below the poverty line, including 13.2% of those under age 18 and 8.2% of those age 65 or over.
Elizabeth is served by the Elizabeth School District, which includes two elementary schools, one middle school, and one high school. The town is also home to a branch of the Elbert County Library.
Elizabeth is a small town with a rich history and a unique culture. The town is home to a variety of businesses and industries, and is a great place to live and work. The town is also home to a variety of recreational activities, including hiking, fishing, and camping. Elizabeth is a great place to visit and explore, and is sure to provide a memorable experience.
Common Questions
What is the Total Population of Elizabeth?
Total Population of Elizabeth is 1,830.
What is the Total Male Population of Elizabeth?
Total Male Population of Elizabeth is 883.
What is the Total Female Population of Elizabeth?
Total Female Population of Elizabeth is 947.
What is the Ratio of Males per 100 Females in Elizabeth?
There are 93.24 Males per 100 Females in Elizabeth.
What is the Ratio of Females per 100 Males in Elizabeth?
There are 107.25 Females per 100 Males in Elizabeth.
What is the Median Population Age in Elizabeth?
Median Population Age in Elizabeth is 32.2 Years.
What is the Average Family Size in Elizabeth
Average Family Size in Elizabeth is 2.9 People.
What is the Average Household Size in Elizabeth
Average Household Size in Elizabeth is 2.6 People.
What is Per Capita Income in Elizabeth?
Per Capita income in Elizabeth is $39,534.
What is the Median Family Income in Elizabeth?
Median Family Income in Elizabeth is $106,827.
What is the Median Household income in Elizabeth?
Median Household Income in Elizabeth is $99,889.
What is Income or Wage Gap in Elizabeth?
Income or Wage Gap in Elizabeth is 14.2%.
Women in Elizabeth earn 85.8 cents for every dollar earned by a man.
What is Family Income Deficit in Elizabeth?
Family Income Deficit in Elizabeth is $16,560.
Families that are below poverty line in Elizabeth earn $16,560 less on average than the poverty threshold level.
What is Inequality or Gini Index in Elizabeth?
Inequality or Gini Index in Elizabeth is 0.27.
How Large is the Labor Force in Elizabeth?
There are 1,046 People in the Labor Forcein in Elizabeth.
What is the Percentage of People in the Labor Force in Elizabeth?
70.5% of People are in the Labor Force in Elizabeth.
What is the Unemployment Rate in Elizabeth?
Unemployment Rate in Elizabeth is 3.0%.