Silver Cliff, CO
Silver Cliff Map
Silver Cliff Overview
735
TOTAL POPULATION
413
MALE POPULATION
322
FEMALE POPULATION
128.26
MALES / 100 FEMALES
77.97
FEMALES / 100 MALES
38.9
MEDIAN AGE
4.2
AVG FAMILY SIZE
2.7
AVG HOUSEHOLD SIZE
$16,907
PER CAPITA INCOME
$50,536
AVG FAMILY INCOME
$35,583
AVG HOUSEHOLD INCOME
34.1%
WAGE / INCOME GAP [ % ]
65.9¢/ $1
WAGE / INCOME GAP [ $ ]
0.40
INEQUALITY / GINI INDEX
231
LABOR FORCE [ PEOPLE ]
45.2%
PERCENT IN LABOR FORCE
3.5%
UNEMPLOYMENT RATE
Silver Cliff Area Codes
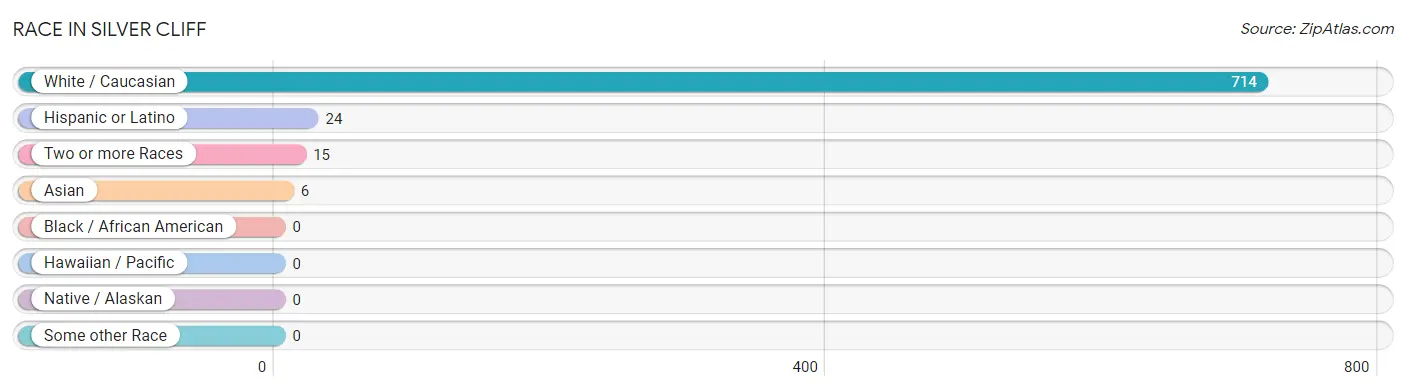
Race in Silver Cliff
The most populous races in Silver Cliff are White / Caucasian (714 | 97.1%), Hispanic or Latino (24 | 3.3%), and Two or more Races (15 | 2.0%).
| Race | # Population | % Population |
| Asian | 6 | 0.8% |
| Black / African American | 0 | 0.0% |
| Hawaiian / Pacific | 0 | 0.0% |
| Hispanic or Latino | 24 | 3.3% |
| Native / Alaskan | 0 | 0.0% |
| White / Caucasian | 714 | 97.1% |
| Two or more Races | 15 | 2.0% |
| Some other Race | 0 | 0.0% |
| Total | 735 | 100.0% |
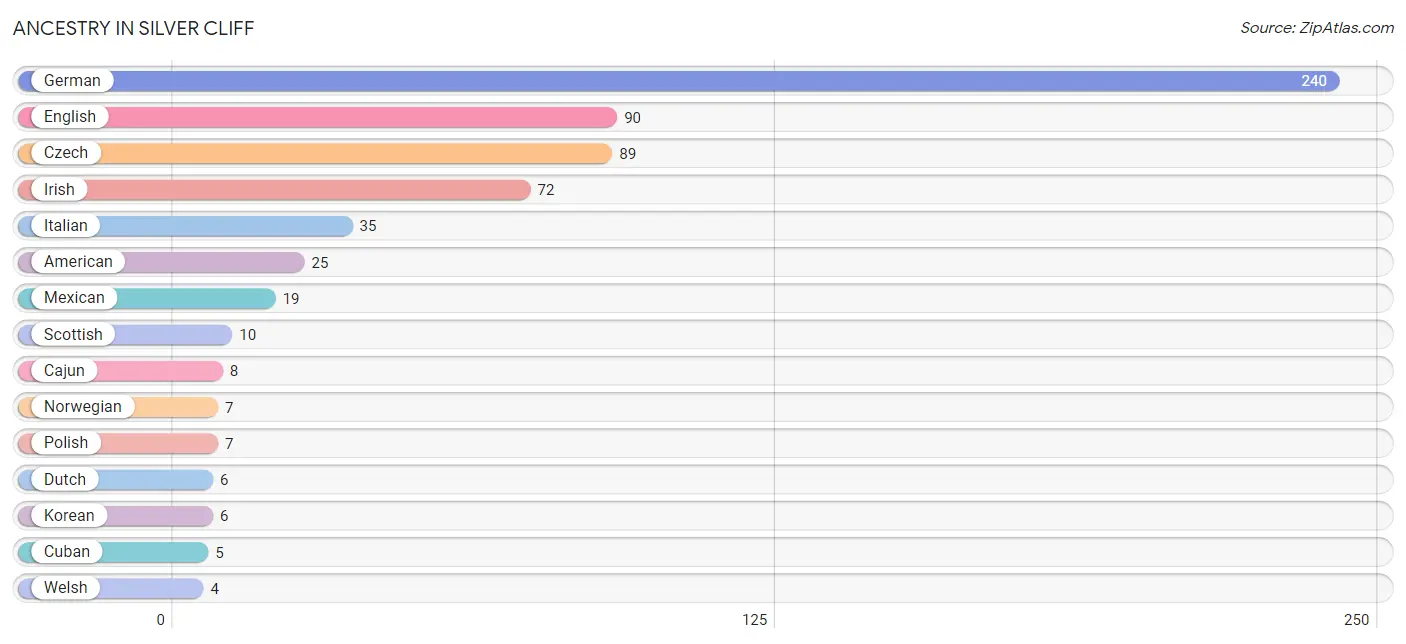
Ancestry in Silver Cliff
The most populous ancestries reported in Silver Cliff are German (240 | 32.7%), English (90 | 12.2%), Czech (89 | 12.1%), Irish (72 | 9.8%), and Italian (35 | 4.8%), together accounting for 71.6% of all Silver Cliff residents.
| Ancestry | # Population | % Population |
| American | 25 | 3.4% |
| Australian | 2 | 0.3% |
| British | 1 | 0.1% |
| Cajun | 8 | 1.1% |
| Choctaw | 3 | 0.4% |
| Cuban | 5 | 0.7% |
| Czech | 89 | 12.1% |
| Danish | 2 | 0.3% |
| Dutch | 6 | 0.8% |
| English | 90 | 12.2% |
| European | 1 | 0.1% |
| French | 2 | 0.3% |
| German | 240 | 32.7% |
| Irish | 72 | 9.8% |
| Italian | 35 | 4.8% |
| Korean | 6 | 0.8% |
| Mexican | 19 | 2.6% |
| Norwegian | 7 | 0.9% |
| Polish | 7 | 0.9% |
| Scottish | 10 | 1.4% |
| Swedish | 2 | 0.3% |
| Welsh | 4 | 0.5% | View All 22 Rows |
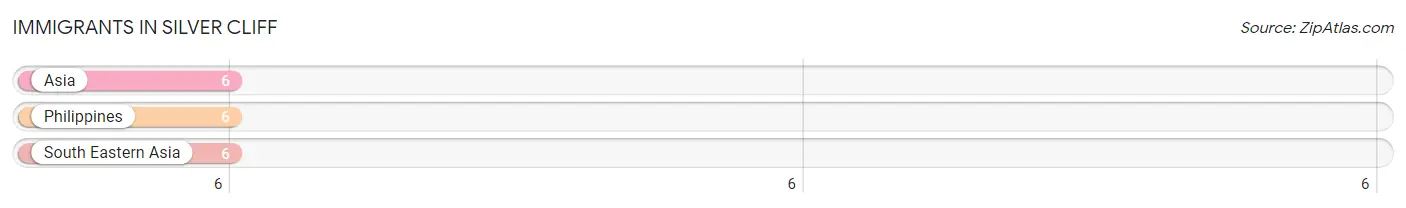
Immigrants in Silver Cliff
The most numerous immigrant groups reported in Silver Cliff came from Asia (6 | 0.8%), Philippines (6 | 0.8%), and South Eastern Asia (6 | 0.8%), together accounting for 2.5% of all Silver Cliff residents.
| Immigration Origin | # Population | % Population |
| Asia | 6 | 0.8% |
| Philippines | 6 | 0.8% |
| South Eastern Asia | 6 | 0.8% | View All 3 Rows |
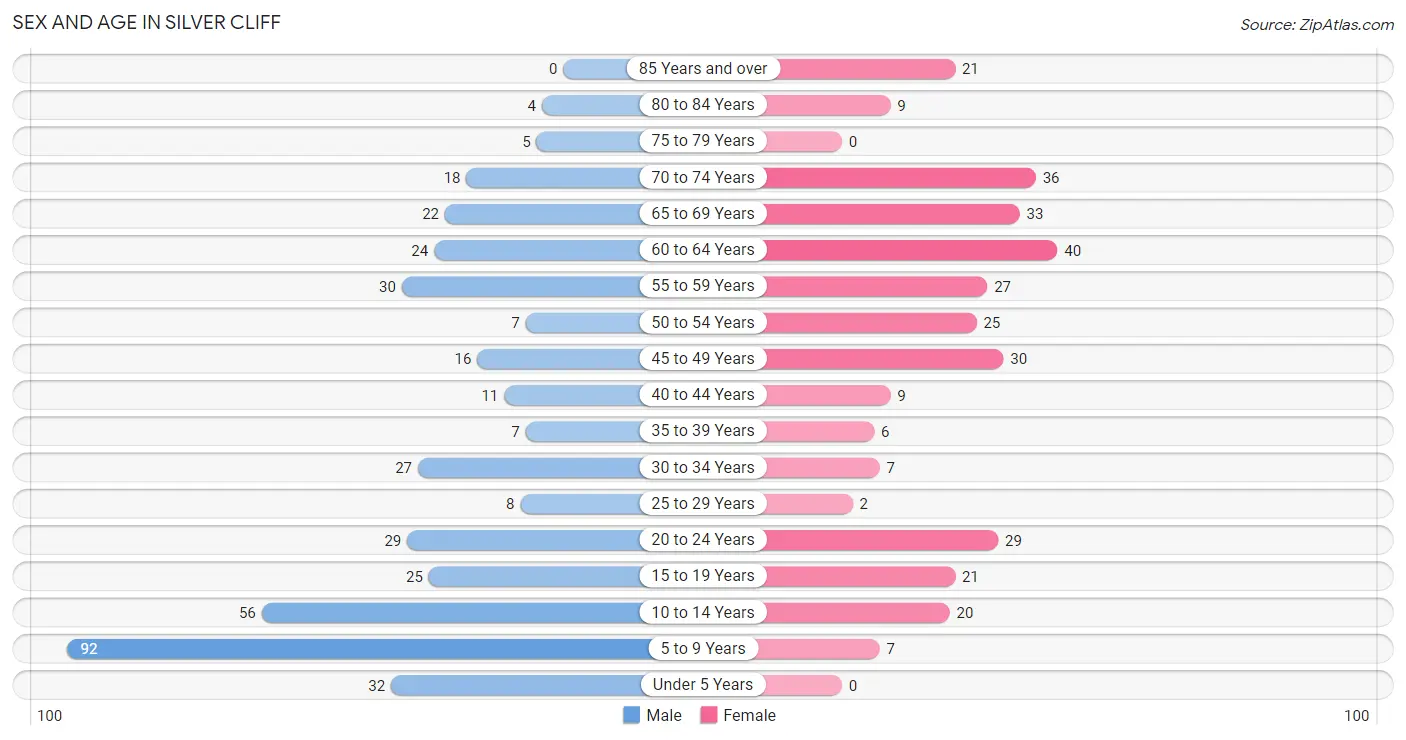
Sex and Age in Silver Cliff
Sex and Age in Silver Cliff
The most populous age groups in Silver Cliff are 5 to 9 Years (92 | 22.3%) for men and 60 to 64 Years (40 | 12.4%) for women.
| Age Bracket | Male | Female |
| Under 5 Years | 32 (7.7%) | 0 (0.0%) |
| 5 to 9 Years | 92 (22.3%) | 7 (2.2%) |
| 10 to 14 Years | 56 (13.6%) | 20 (6.2%) |
| 15 to 19 Years | 25 (6.0%) | 21 (6.5%) |
| 20 to 24 Years | 29 (7.0%) | 29 (9.0%) |
| 25 to 29 Years | 8 (1.9%) | 2 (0.6%) |
| 30 to 34 Years | 27 (6.5%) | 7 (2.2%) |
| 35 to 39 Years | 7 (1.7%) | 6 (1.9%) |
| 40 to 44 Years | 11 (2.7%) | 9 (2.8%) |
| 45 to 49 Years | 16 (3.9%) | 30 (9.3%) |
| 50 to 54 Years | 7 (1.7%) | 25 (7.8%) |
| 55 to 59 Years | 30 (7.3%) | 27 (8.4%) |
| 60 to 64 Years | 24 (5.8%) | 40 (12.4%) |
| 65 to 69 Years | 22 (5.3%) | 33 (10.2%) |
| 70 to 74 Years | 18 (4.4%) | 36 (11.2%) |
| 75 to 79 Years | 5 (1.2%) | 0 (0.0%) |
| 80 to 84 Years | 4 (1.0%) | 9 (2.8%) |
| 85 Years and over | 0 (0.0%) | 21 (6.5%) |
| Total | 413 (100.0%) | 322 (100.0%) |
Families and Households in Silver Cliff
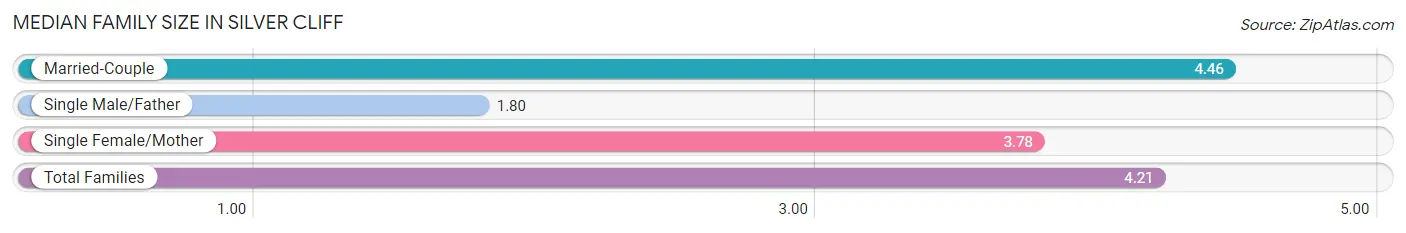
Median Family Size in Silver Cliff
The median family size in Silver Cliff is 4.21 persons per family, with married-couple families (112 | 85.5%) accounting for the largest median family size of 4.46 persons per family. On the other hand, single male/father families (10 | 7.6%) represent the smallest median family size with 1.80 persons per family.
| Family Type | # Families | Family Size |
| Married-Couple | 112 (85.5%) | 4.46 |
| Single Male/Father | 10 (7.6%) | 1.80 |
| Single Female/Mother | 9 (6.9%) | 3.78 |
| Total Families | 131 (100.0%) | 4.21 |
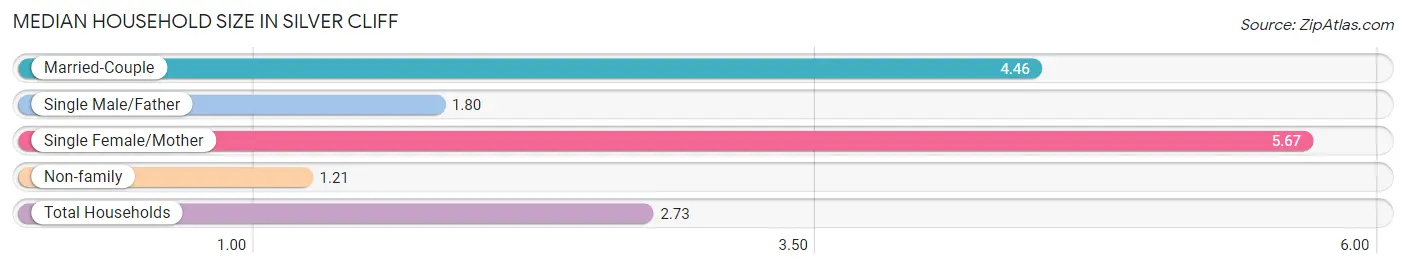
Median Household Size in Silver Cliff
The median household size in Silver Cliff is 2.73 persons per household, with single female/mother households (9 | 3.4%) accounting for the largest median household size of 5.67 persons per household. non-family households (138 | 51.3%) represent the smallest median household size with 1.21 persons per household.
| Household Type | # Households | Household Size |
| Married-Couple | 112 (41.6%) | 4.46 |
| Single Male/Father | 10 (3.7%) | 1.80 |
| Single Female/Mother | 9 (3.4%) | 5.67 |
| Non-family | 138 (51.3%) | 1.21 |
| Total Households | 269 (100.0%) | 2.73 |
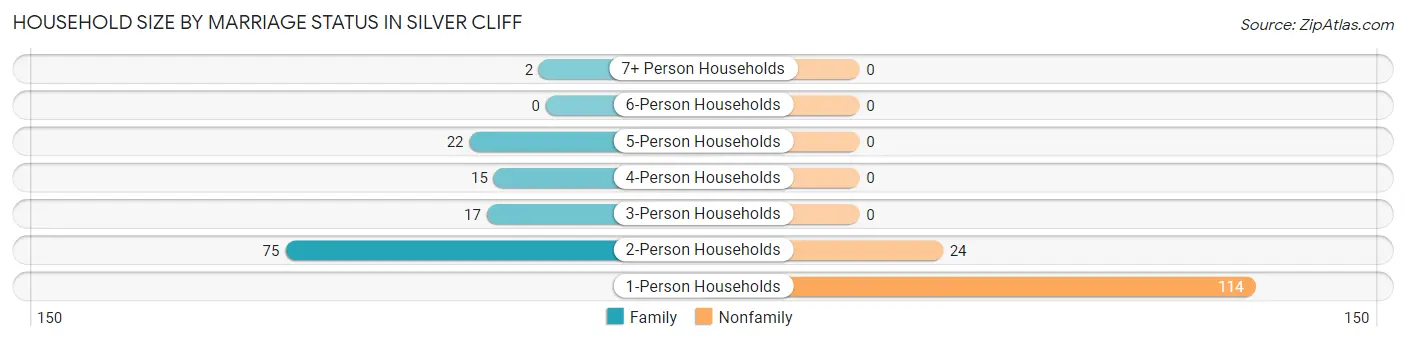
Household Size by Marriage Status in Silver Cliff
Out of a total of 269 households in Silver Cliff, 131 (48.7%) are family households, while 138 (51.3%) are nonfamily households. The most numerous type of family households are 2-person households, comprising 75, and the most common type of nonfamily households are 1-person households, comprising 114.
| Household Size | Family Households | Nonfamily Households |
| 1-Person Households | - | 114 (42.4%) |
| 2-Person Households | 75 (27.9%) | 24 (8.9%) |
| 3-Person Households | 17 (6.3%) | 0 (0.0%) |
| 4-Person Households | 15 (5.6%) | 0 (0.0%) |
| 5-Person Households | 22 (8.2%) | 0 (0.0%) |
| 6-Person Households | 0 (0.0%) | 0 (0.0%) |
| 7+ Person Households | 2 (0.7%) | 0 (0.0%) |
| Total | 131 (48.7%) | 138 (51.3%) |
Female Fertility in Silver Cliff
Fertility by Age in Silver Cliff
| Age Bracket | Women with Births | Births / 1,000 Women |
| 15 to 19 years | 0 (0.0%) | 0.0 |
| 20 to 34 years | 0 (0.0%) | 0.0 |
| 35 to 50 years | 0 (0.0%) | 0.0 |
| Total | 0 (0.0%) | 0.0 |
Fertility by Age by Marriage Status in Silver Cliff
| Age Bracket | Married | Unmarried |
| 15 to 19 years | 0 (0.0%) | 0 (0.0%) |
| 20 to 34 years | 0 (0.0%) | 0 (0.0%) |
| 35 to 50 years | 0 (0.0%) | 0 (0.0%) |
| Total | 0 (0.0%) | 0 (0.0%) |
Fertility by Education in Silver Cliff
| Educational Attainment | Women with Births | Births / 1,000 Women |
| Less than High School | 0 (0.0%) | 0.0 |
| High School Diploma | 0 (0.0%) | 0.0 |
| College or Associate's Degree | 0 (0.0%) | 0.0 |
| Bachelor's Degree | 0 (0.0%) | 0.0 |
| Graduate Degree | 0 (0.0%) | 0.0 |
| Total | 0 (0.0%) | 0.0 |
Fertility by Education by Marriage Status in Silver Cliff
| Educational Attainment | Married | Unmarried |
| Less than High School | 0 (0.0%) | 0 (0.0%) |
| High School Diploma | 0 (0.0%) | 0 (0.0%) |
| College or Associate's Degree | 0 (0.0%) | 0 (0.0%) |
| Bachelor's Degree | 0 (0.0%) | 0 (0.0%) |
| Graduate Degree | 0 (0.0%) | 0 (0.0%) |
| Total | 0 (0.0%) | 0 (0.0%) |
Income in Silver Cliff
Income Overview in Silver Cliff
Per Capita Income in Silver Cliff is $16,907, while median incomes of families and households are $50,536 and $35,583 respectively.
| Characteristic | Number | Measure |
| Per Capita Income | 735 | $16,907 |
| Median Family Income | 131 | $50,536 |
| Mean Family Income | 131 | $59,291 |
| Median Household Income | 269 | $35,583 |
| Mean Household Income | 269 | $45,182 |
| Income Deficit | 131 | $0 |
| Wage / Income Gap (%) | 735 | 34.14% |
| Wage / Income Gap ($) | 735 | 65.86¢ per $1 |
| Gini / Inequality Index | 735 | 0.40 |
Earnings by Sex in Silver Cliff
Average Earnings in Silver Cliff are $27,143, $35,714 for men and $23,523 for women, a difference of 34.1%.
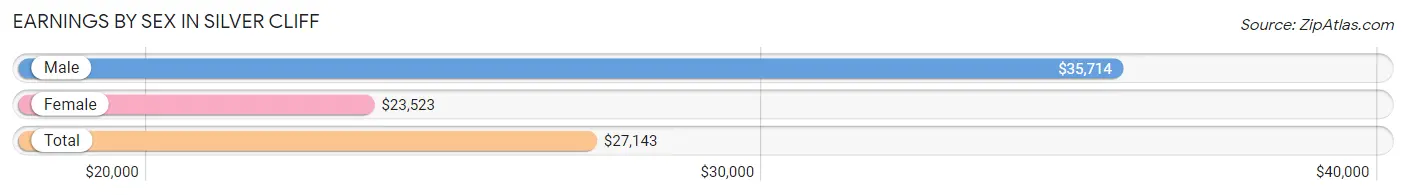
| Sex | Number | Average Earnings |
| Male | 138 (56.1%) | $35,714 |
| Female | 108 (43.9%) | $23,523 |
| Total | 246 (100.0%) | $27,143 |
Earnings by Sex by Income Bracket in Silver Cliff
The most common earnings brackets in Silver Cliff are $50,000 to $54,999 for men (15 | 10.9%) and $22,500 to $24,999 for women (22 | 20.4%).
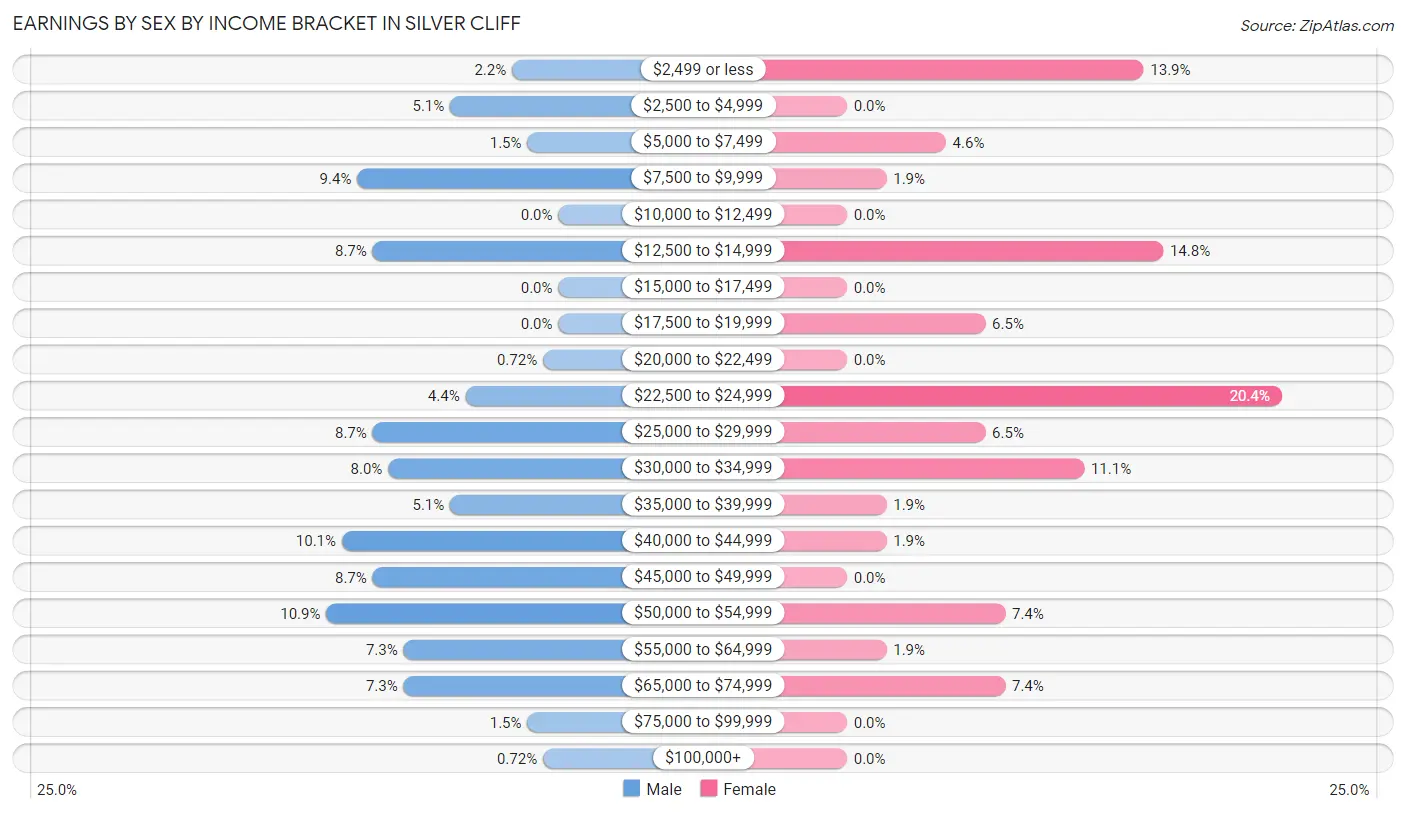
| Income | Male | Female |
| $2,499 or less | 3 (2.2%) | 15 (13.9%) |
| $2,500 to $4,999 | 7 (5.1%) | 0 (0.0%) |
| $5,000 to $7,499 | 2 (1.5%) | 5 (4.6%) |
| $7,500 to $9,999 | 13 (9.4%) | 2 (1.8%) |
| $10,000 to $12,499 | 0 (0.0%) | 0 (0.0%) |
| $12,500 to $14,999 | 12 (8.7%) | 16 (14.8%) |
| $15,000 to $17,499 | 0 (0.0%) | 0 (0.0%) |
| $17,500 to $19,999 | 0 (0.0%) | 7 (6.5%) |
| $20,000 to $22,499 | 1 (0.7%) | 0 (0.0%) |
| $22,500 to $24,999 | 6 (4.3%) | 22 (20.4%) |
| $25,000 to $29,999 | 12 (8.7%) | 7 (6.5%) |
| $30,000 to $34,999 | 11 (8.0%) | 12 (11.1%) |
| $35,000 to $39,999 | 7 (5.1%) | 2 (1.8%) |
| $40,000 to $44,999 | 14 (10.1%) | 2 (1.8%) |
| $45,000 to $49,999 | 12 (8.7%) | 0 (0.0%) |
| $50,000 to $54,999 | 15 (10.9%) | 8 (7.4%) |
| $55,000 to $64,999 | 10 (7.2%) | 2 (1.8%) |
| $65,000 to $74,999 | 10 (7.2%) | 8 (7.4%) |
| $75,000 to $99,999 | 2 (1.5%) | 0 (0.0%) |
| $100,000+ | 1 (0.7%) | 0 (0.0%) |
| Total | 138 (100.0%) | 108 (100.0%) |
Earnings by Sex by Educational Attainment in Silver Cliff
Average earnings in Silver Cliff are $35,536 for men and $26,250 for women, a difference of 26.1%. Men with an educational attainment of high school diploma enjoy the highest average annual earnings of $37,321, while those with college or associate's degree education earn the least with $26,875. Women with an educational attainment of bachelor's degree earn the most with the average annual earnings of $31,563, while those with college or associate's degree education have the smallest earnings of $24,342.
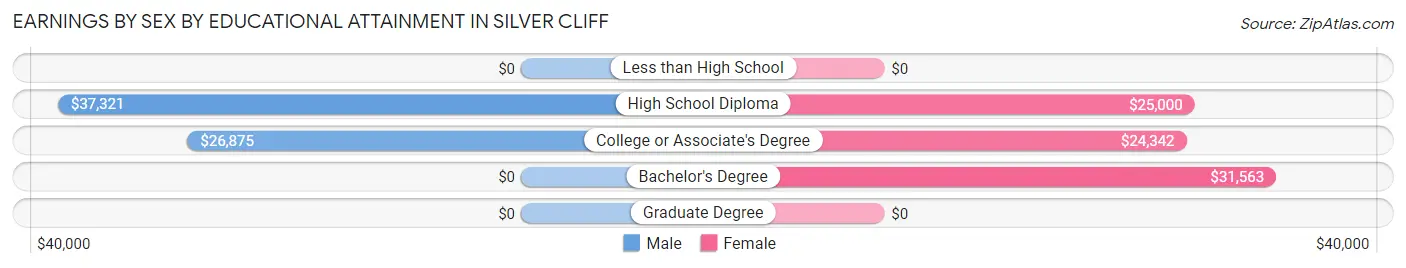
| Educational Attainment | Male Income | Female Income |
| Less than High School | - | - |
| High School Diploma | $37,321 | $25,000 |
| College or Associate's Degree | $26,875 | $24,342 |
| Bachelor's Degree | - | - |
| Graduate Degree | - | - |
| Total | $35,536 | $26,250 |
Family Income in Silver Cliff
Family Income Brackets in Silver Cliff
According to the Silver Cliff family income data, there are 38 families falling into the $50,000 to $74,999 income range, which is the most common income bracket and makes up 29.0% of all families.
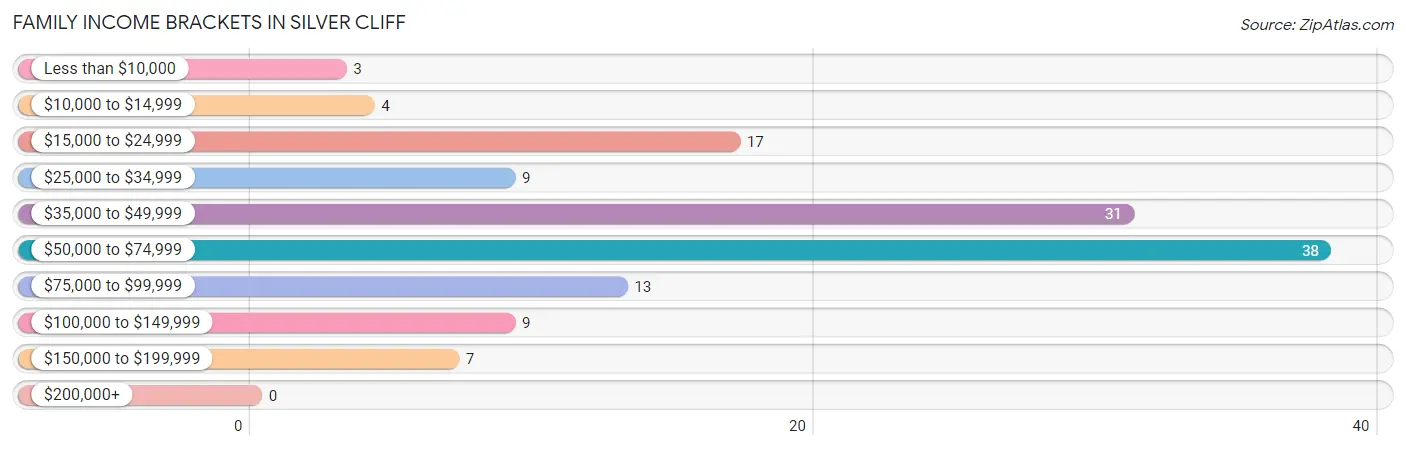
| Income Bracket | # Families | % Families |
| Less than $10,000 | 3 | 2.3% |
| $10,000 to $14,999 | 4 | 3.1% |
| $15,000 to $24,999 | 17 | 13.0% |
| $25,000 to $34,999 | 9 | 6.9% |
| $35,000 to $49,999 | 31 | 23.7% |
| $50,000 to $74,999 | 38 | 29.0% |
| $75,000 to $99,999 | 13 | 9.9% |
| $100,000 to $149,999 | 9 | 6.9% |
| $150,000 to $199,999 | 7 | 5.3% |
| $200,000+ | 0 | 0.0% |
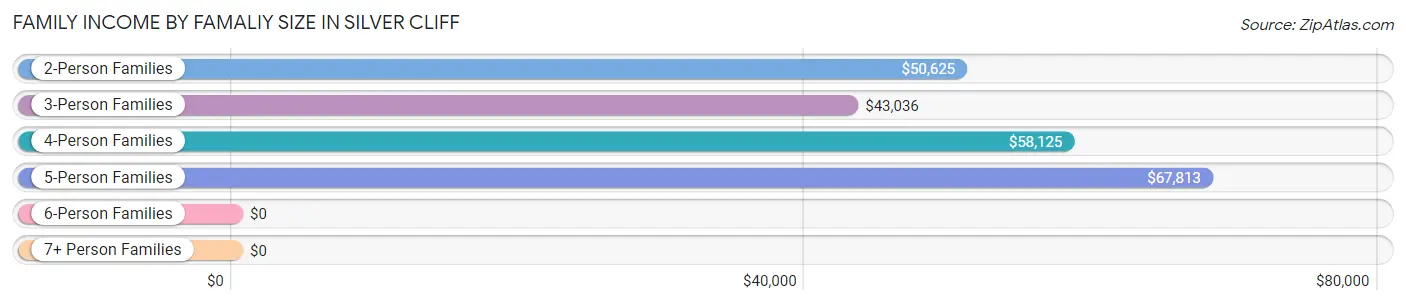
Family Income by Famaliy Size in Silver Cliff
5-person families (24 | 18.3%) account for the highest median family income in Silver Cliff with $67,813 per family, while 2-person families (75 | 57.3%) have the highest median income of $25,312 per family member.
| Income Bracket | # Families | Median Income |
| 2-Person Families | 75 (57.3%) | $50,625 |
| 3-Person Families | 17 (13.0%) | $43,036 |
| 4-Person Families | 15 (11.5%) | $58,125 |
| 5-Person Families | 24 (18.3%) | $67,813 |
| 6-Person Families | 0 (0.0%) | $0 |
| 7+ Person Families | 0 (0.0%) | $0 |
| Total | 131 (100.0%) | $50,536 |
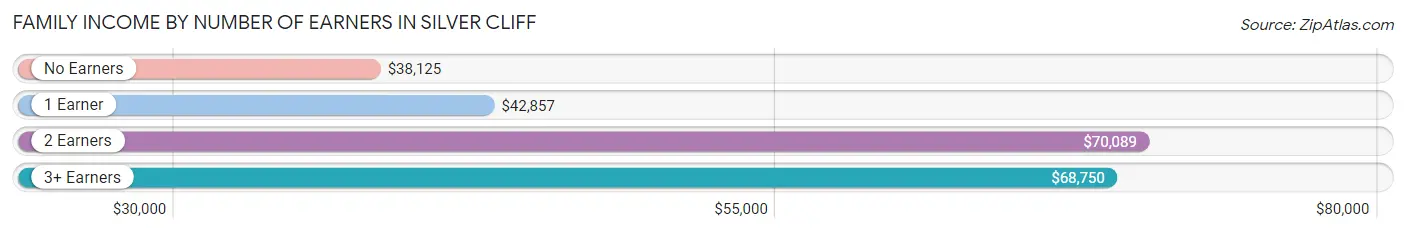
Family Income by Number of Earners in Silver Cliff
The median family income in Silver Cliff is $50,536, with families comprising 2 earners (43) having the highest median family income of $70,089, while families with no earners (34) have the lowest median family income of $38,125, accounting for 32.8% and 26.0% of families, respectively.
| Number of Earners | # Families | Median Income |
| No Earners | 34 (26.0%) | $38,125 |
| 1 Earner | 36 (27.5%) | $42,857 |
| 2 Earners | 43 (32.8%) | $70,089 |
| 3+ Earners | 18 (13.7%) | $68,750 |
| Total | 131 (100.0%) | $50,536 |
Household Income in Silver Cliff
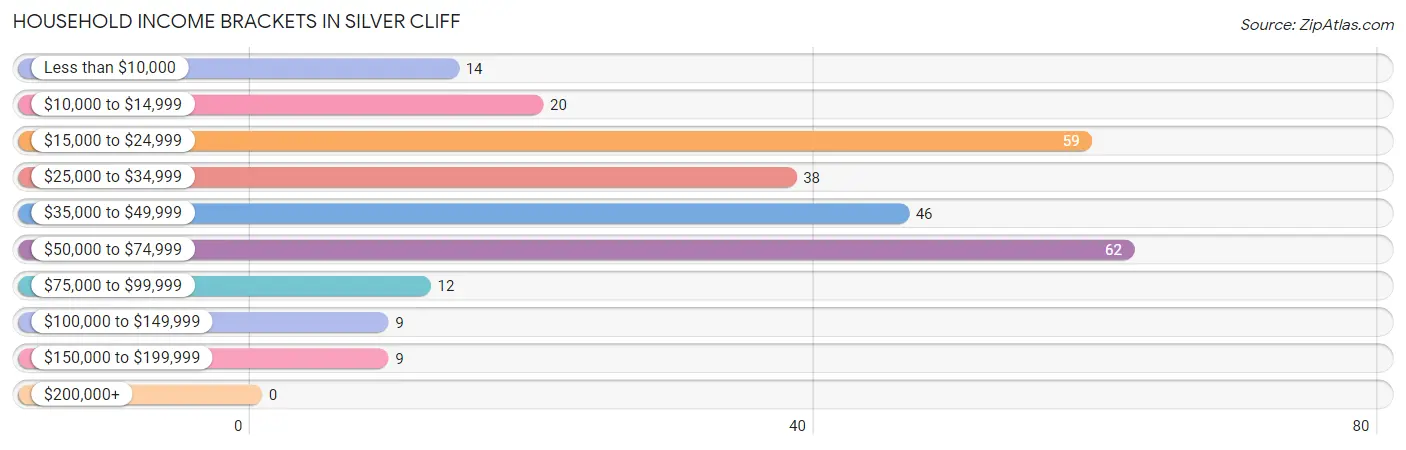
Household Income Brackets in Silver Cliff
With 62 households falling in the category, the $50,000 to $74,999 income range is the most frequent in Silver Cliff, accounting for 23.1% of all households.
| Income Bracket | # Households | % Households |
| Less than $10,000 | 14 | 5.2% |
| $10,000 to $14,999 | 20 | 7.4% |
| $15,000 to $24,999 | 59 | 21.9% |
| $25,000 to $34,999 | 38 | 14.1% |
| $35,000 to $49,999 | 46 | 17.1% |
| $50,000 to $74,999 | 62 | 23.0% |
| $75,000 to $99,999 | 12 | 4.5% |
| $100,000 to $149,999 | 9 | 3.3% |
| $150,000 to $199,999 | 9 | 3.3% |
| $200,000+ | 0 | 0.0% |
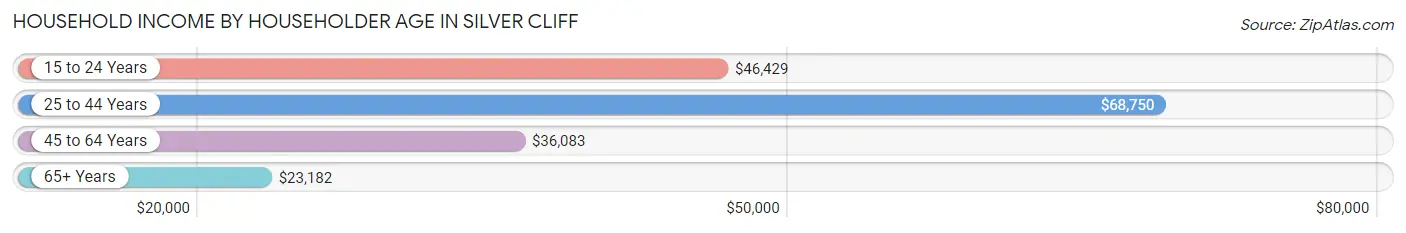
Household Income by Householder Age in Silver Cliff
The median household income in Silver Cliff is $35,583, with the highest median household income of $68,750 found in the 25 to 44 years age bracket for the primary householder. A total of 40 households (14.9%) fall into this category. Meanwhile, the 65+ years age bracket for the primary householder has the lowest median household income of $23,182, with 102 households (37.9%) in this group.
| Income Bracket | # Households | Median Income |
| 15 to 24 Years | 22 (8.2%) | $46,429 |
| 25 to 44 Years | 40 (14.9%) | $68,750 |
| 45 to 64 Years | 105 (39.0%) | $36,083 |
| 65+ Years | 102 (37.9%) | $23,182 |
| Total | 269 (100.0%) | $35,583 |
Poverty in Silver Cliff
Income Below Poverty by Sex and Age in Silver Cliff
With 12.3% poverty level for males and 20.8% for females among the residents of Silver Cliff, 16 and 17 year old males and 16 and 17 year old females are the most vulnerable to poverty, with 8 males (100.0%) and 7 females (43.8%) in their respective age groups living below the poverty level.
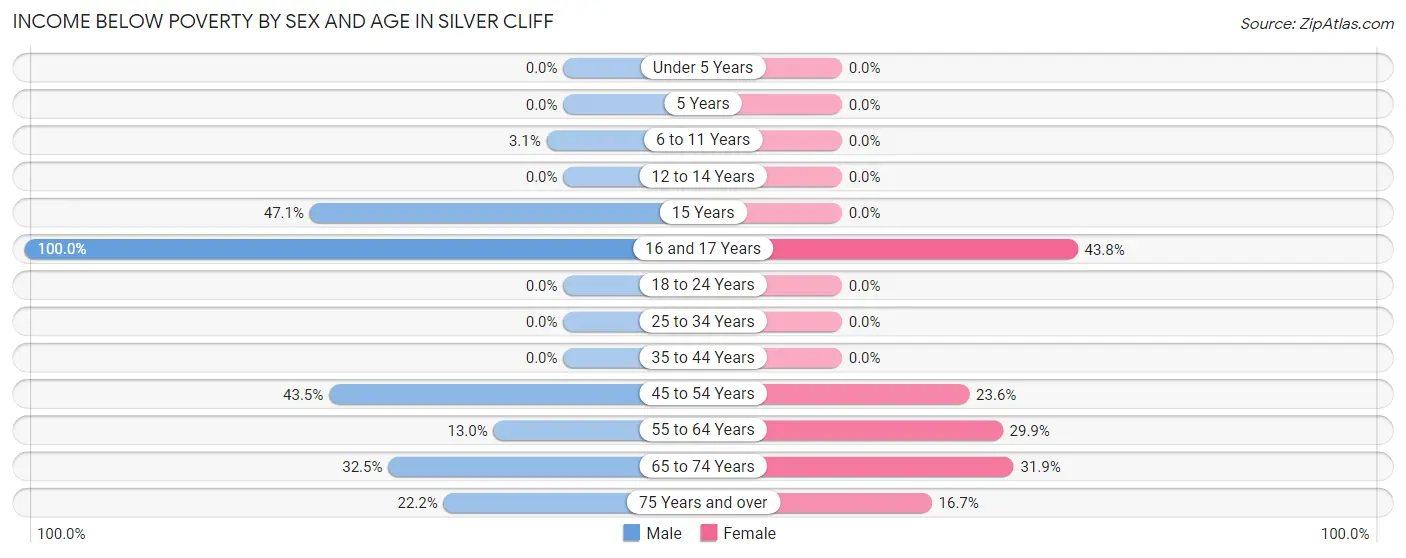
| Age Bracket | Male | Female |
| Under 5 Years | 0 (0.0%) | 0 (0.0%) |
| 5 Years | 0 (0.0%) | 0 (0.0%) |
| 6 to 11 Years | 3 (3.1%) | 0 (0.0%) |
| 12 to 14 Years | 0 (0.0%) | 0 (0.0%) |
| 15 Years | 8 (47.1%) | 0 (0.0%) |
| 16 and 17 Years | 8 (100.0%) | 7 (43.8%) |
| 18 to 24 Years | 0 (0.0%) | 0 (0.0%) |
| 25 to 34 Years | 0 (0.0%) | 0 (0.0%) |
| 35 to 44 Years | 0 (0.0%) | 0 (0.0%) |
| 45 to 54 Years | 10 (43.5%) | 13 (23.6%) |
| 55 to 64 Years | 7 (13.0%) | 20 (29.8%) |
| 65 to 74 Years | 13 (32.5%) | 22 (31.9%) |
| 75 Years and over | 2 (22.2%) | 5 (16.7%) |
| Total | 51 (12.3%) | 67 (20.8%) |
Income Above Poverty by Sex and Age in Silver Cliff
According to the poverty statistics in Silver Cliff, males aged under 5 years and females aged 6 to 11 years are the age groups that are most secure financially, with 100.0% of males and 100.0% of females in these age groups living above the poverty line.
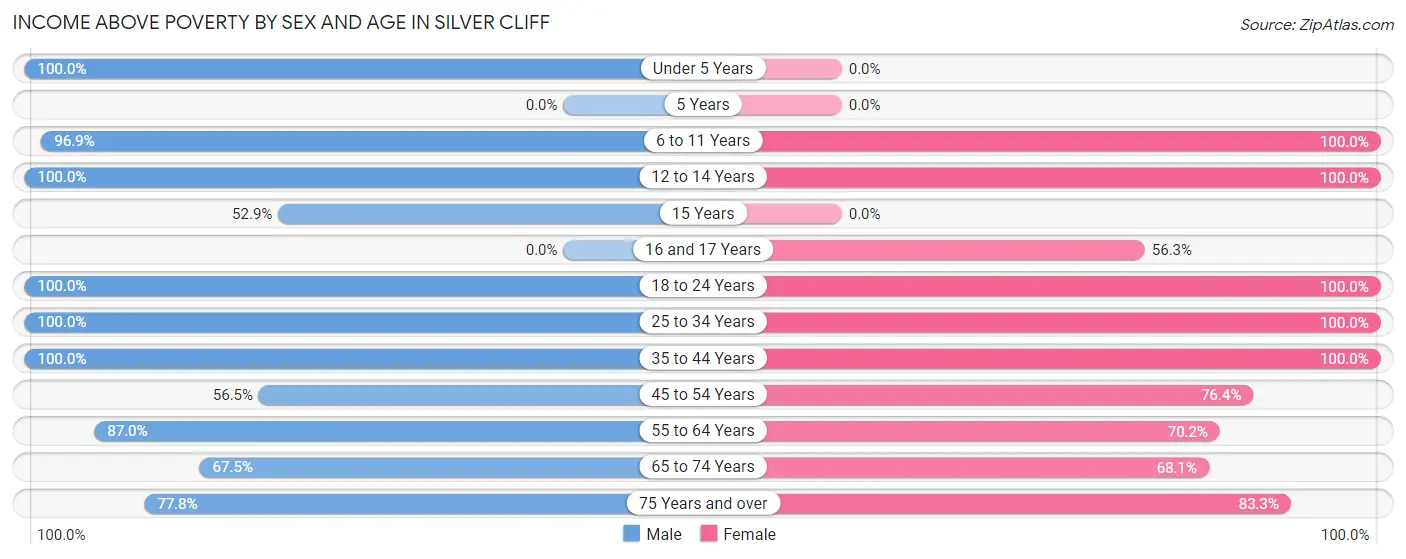
| Age Bracket | Male | Female |
| Under 5 Years | 32 (100.0%) | 0 (0.0%) |
| 5 Years | 0 (0.0%) | 0 (0.0%) |
| 6 to 11 Years | 93 (96.9%) | 20 (100.0%) |
| 12 to 14 Years | 52 (100.0%) | 7 (100.0%) |
| 15 Years | 9 (52.9%) | 0 (0.0%) |
| 16 and 17 Years | 0 (0.0%) | 9 (56.2%) |
| 18 to 24 Years | 29 (100.0%) | 34 (100.0%) |
| 25 to 34 Years | 35 (100.0%) | 9 (100.0%) |
| 35 to 44 Years | 18 (100.0%) | 15 (100.0%) |
| 45 to 54 Years | 13 (56.5%) | 42 (76.4%) |
| 55 to 64 Years | 47 (87.0%) | 47 (70.2%) |
| 65 to 74 Years | 27 (67.5%) | 47 (68.1%) |
| 75 Years and over | 7 (77.8%) | 25 (83.3%) |
| Total | 362 (87.6%) | 255 (79.2%) |
Income Below Poverty Among Married-Couple Families in Silver Cliff
The poverty statistics for married-couple families in Silver Cliff show that 13.4% or 15 of the total 112 families live below the poverty line. Families with 3 or 4 children have the highest poverty rate of 42.9%, comprising of 6 families. On the other hand, families with 1 or 2 children have the lowest poverty rate of 0.0%, which includes 0 families.
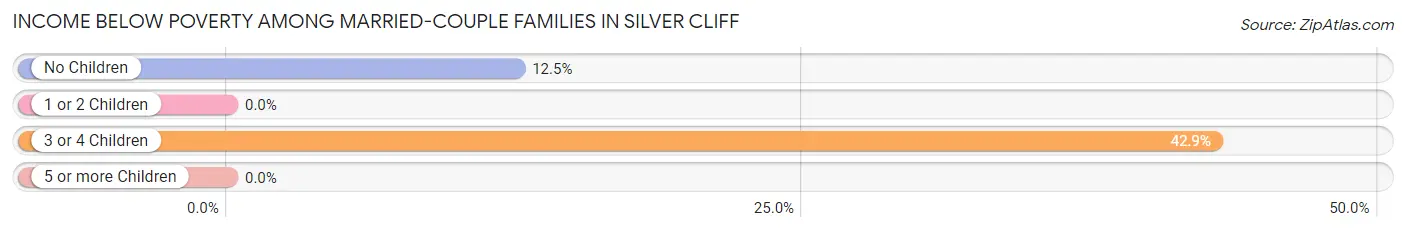
| Children | Above Poverty | Below Poverty |
| No Children | 63 (87.5%) | 9 (12.5%) |
| 1 or 2 Children | 26 (100.0%) | 0 (0.0%) |
| 3 or 4 Children | 8 (57.1%) | 6 (42.9%) |
| 5 or more Children | 0 (0.0%) | 0 (0.0%) |
| Total | 97 (86.6%) | 15 (13.4%) |
Income Below Poverty Among Single-Parent Households in Silver Cliff
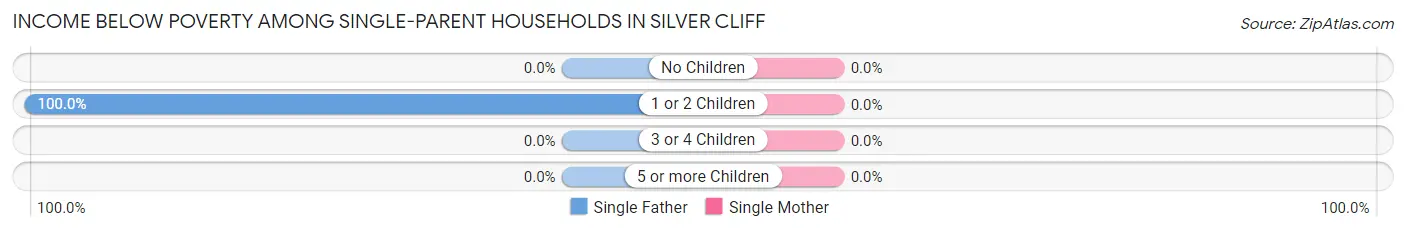
| Children | Single Father | Single Mother |
| No Children | 0 (0.0%) | 0 (0.0%) |
| 1 or 2 Children | 3 (100.0%) | 0 (0.0%) |
| 3 or 4 Children | 0 (0.0%) | 0 (0.0%) |
| 5 or more Children | 0 (0.0%) | 0 (0.0%) |
| Total | 3 (30.0%) | 0 (0.0%) |
Income Below Poverty Among Married-Couple vs Single-Parent Households in Silver Cliff
The poverty data for Silver Cliff shows that 15 of the married-couple family households (13.4%) and 3 of the single-parent households (15.8%) are living below the poverty level. Within the married-couple family households, those with 3 or 4 children have the highest poverty rate, with 6 households (42.9%) falling below the poverty line. Among the single-parent households, those with 1 or 2 children have the highest poverty rate, with 3 household (42.9%) living below poverty.
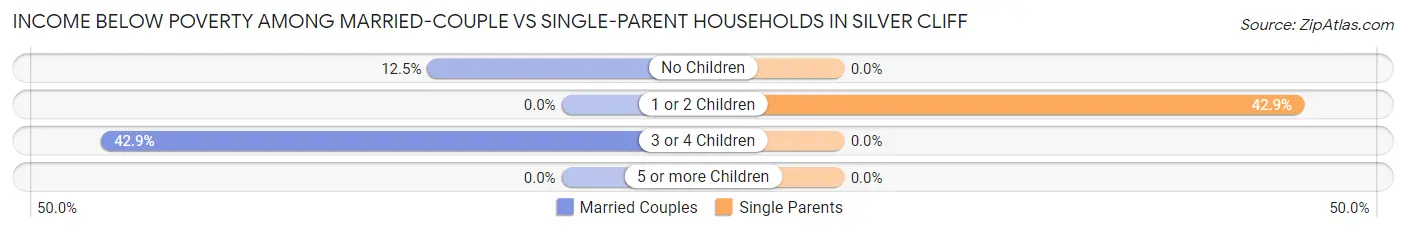
| Children | Married-Couple Families | Single-Parent Households |
| No Children | 9 (12.5%) | 0 (0.0%) |
| 1 or 2 Children | 0 (0.0%) | 3 (42.9%) |
| 3 or 4 Children | 6 (42.9%) | 0 (0.0%) |
| 5 or more Children | 0 (0.0%) | 0 (0.0%) |
| Total | 15 (13.4%) | 3 (15.8%) |
Employment Characteristics in Silver Cliff
Employment by Class of Employer in Silver Cliff
Among the 221 employed individuals in Silver Cliff, private company employees (127 | 57.5%), self-employed (not incorporated) (25 | 11.3%), and not-for-profit organizations (24 | 10.9%) make up the most common classes of employment.
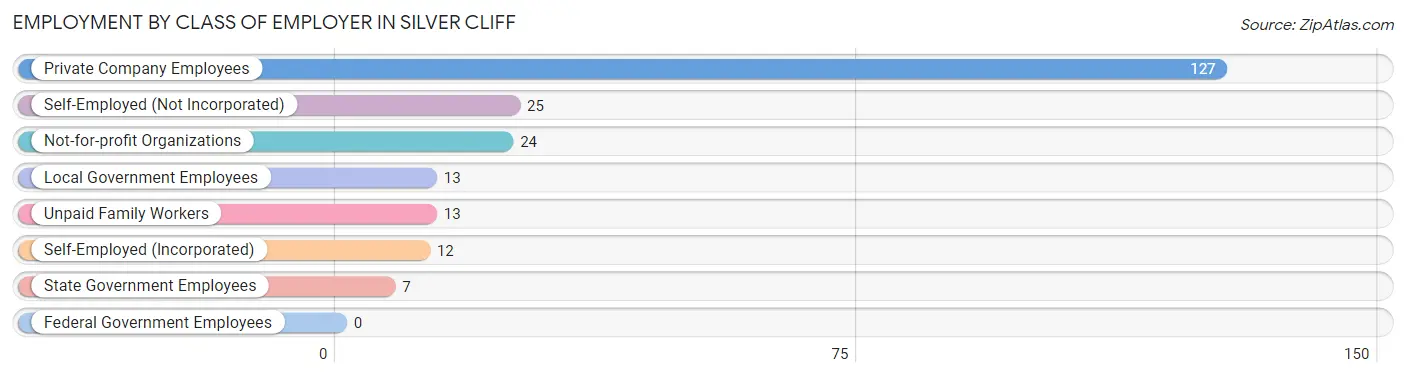
| Employer Class | # Employees | % Employees |
| Private Company Employees | 127 | 57.5% |
| Self-Employed (Incorporated) | 12 | 5.4% |
| Self-Employed (Not Incorporated) | 25 | 11.3% |
| Not-for-profit Organizations | 24 | 10.9% |
| Local Government Employees | 13 | 5.9% |
| State Government Employees | 7 | 3.2% |
| Federal Government Employees | 0 | 0.0% |
| Unpaid Family Workers | 13 | 5.9% |
| Total | 221 | 100.0% |
Employment Status by Age in Silver Cliff
According to the labor force statistics for Silver Cliff, out of the total population over 16 years of age (511), 45.2% or 231 individuals are in the labor force, with 3.5% or 8 of them unemployed. The age group with the highest labor force participation rate is 25 to 29 years, with 100.0% or 10 individuals in the labor force. Within the labor force, the 30 to 34 years age range has the highest percentage of unemployed individuals, with 17.6% or 6 of them being unemployed.
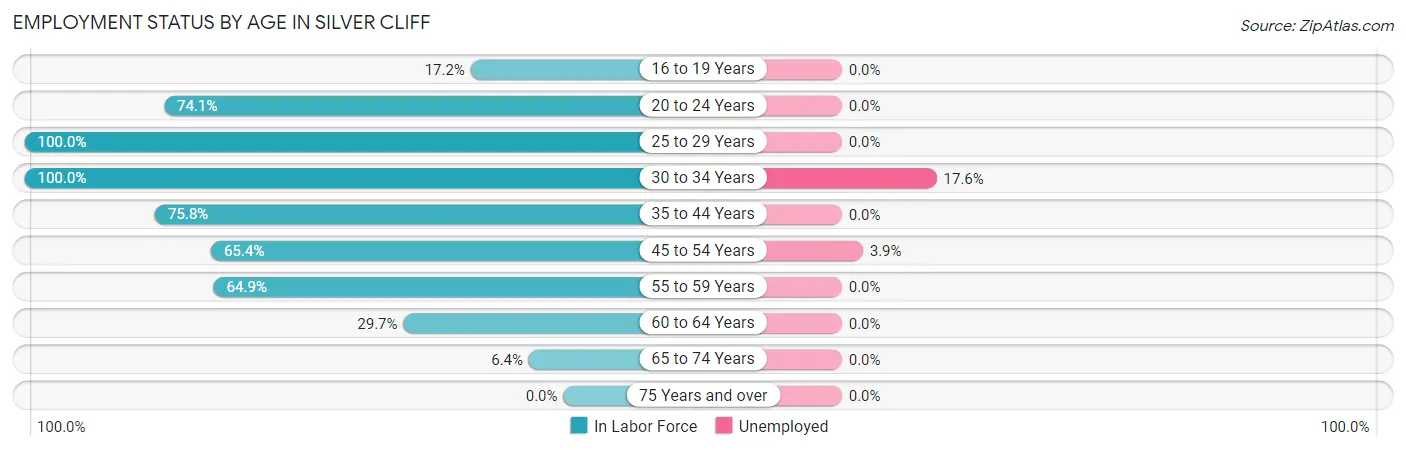
| Age Bracket | In Labor Force | Unemployed |
| 16 to 19 Years | 5 (17.2%) | 0 (0.0%) |
| 20 to 24 Years | 43 (74.1%) | 0 (0.0%) |
| 25 to 29 Years | 10 (100.0%) | 0 (0.0%) |
| 30 to 34 Years | 34 (100.0%) | 6 (17.6%) |
| 35 to 44 Years | 25 (75.8%) | 0 (0.0%) |
| 45 to 54 Years | 51 (65.4%) | 2 (3.9%) |
| 55 to 59 Years | 37 (64.9%) | 0 (0.0%) |
| 60 to 64 Years | 19 (29.7%) | 0 (0.0%) |
| 65 to 74 Years | 7 (6.4%) | 0 (0.0%) |
| 75 Years and over | 0 (0.0%) | 0 (0.0%) |
| Total | 231 (45.2%) | 8 (3.5%) |
Employment Status by Educational Attainment in Silver Cliff
According to labor force statistics for Silver Cliff, 63.8% of individuals (176) out of the total population between 25 and 64 years of age (276) are in the labor force, with 4.5% or 8 of them being unemployed. The group with the highest labor force participation rate are those with the educational attainment of less than high school, with 71.4% or 5 individuals in the labor force. Within the labor force, individuals with high school diploma education have the highest percentage of unemployment, with 9.1% or 6 of them being unemployed.
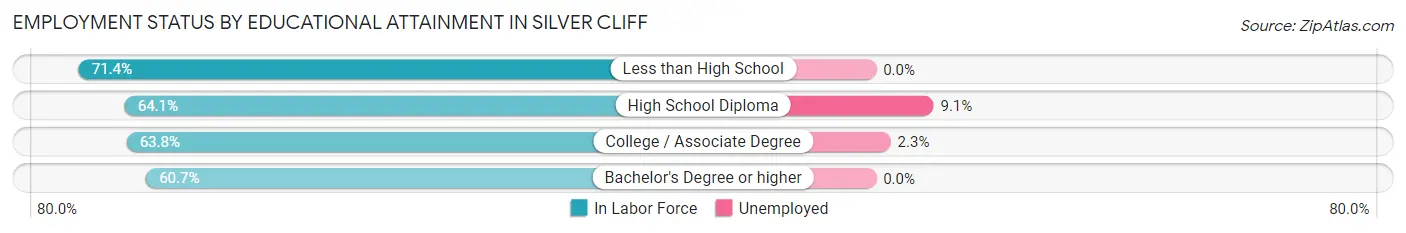
| Educational Attainment | In Labor Force | Unemployed |
| Less than High School | 5 (71.4%) | 0 (0.0%) |
| High School Diploma | 66 (64.1%) | 9 (9.1%) |
| College / Associate Degree | 88 (63.8%) | 3 (2.3%) |
| Bachelor's Degree or higher | 17 (60.7%) | 0 (0.0%) |
| Total | 176 (63.8%) | 12 (4.5%) |
Employment Occupations by Sex in Silver Cliff
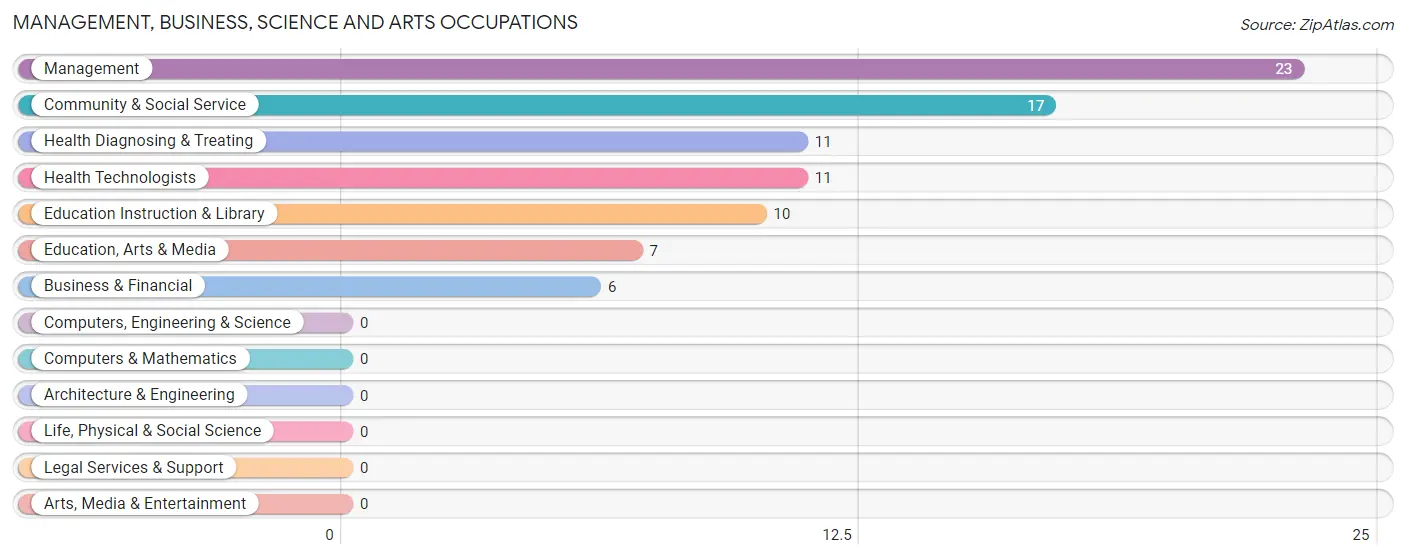
Management, Business, Science and Arts Occupations
The most common Management, Business, Science and Arts occupations in Silver Cliff are Management (23 | 10.3%), Community & Social Service (17 | 7.6%), Health Diagnosing & Treating (11 | 4.9%), Health Technologists (11 | 4.9%), and Education Instruction & Library (10 | 4.5%).
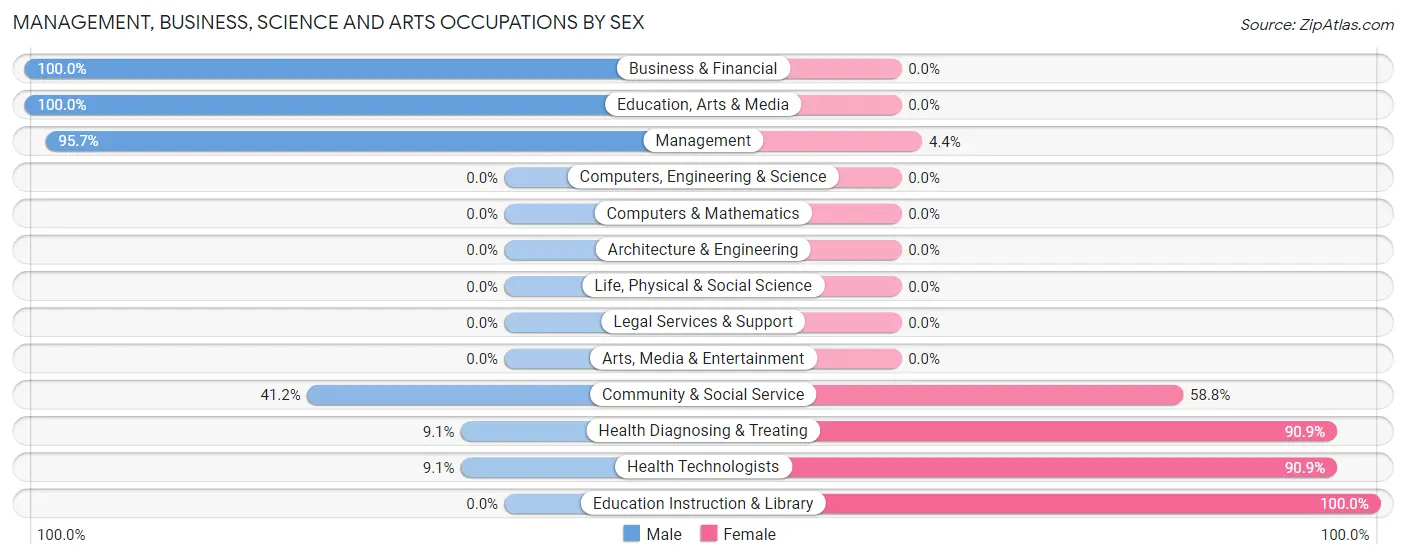
Management, Business, Science and Arts Occupations by Sex
Within the Management, Business, Science and Arts occupations in Silver Cliff, the most male-oriented occupations are Business & Financial (100.0%), Education, Arts & Media (100.0%), and Management (95.7%), while the most female-oriented occupations are Education Instruction & Library (100.0%), Health Diagnosing & Treating (90.9%), and Health Technologists (90.9%).
| Occupation | Male | Female |
| Management | 22 (95.7%) | 1 (4.3%) |
| Business & Financial | 6 (100.0%) | 0 (0.0%) |
| Computers, Engineering & Science | 0 (0.0%) | 0 (0.0%) |
| Computers & Mathematics | 0 (0.0%) | 0 (0.0%) |
| Architecture & Engineering | 0 (0.0%) | 0 (0.0%) |
| Life, Physical & Social Science | 0 (0.0%) | 0 (0.0%) |
| Community & Social Service | 7 (41.2%) | 10 (58.8%) |
| Education, Arts & Media | 7 (100.0%) | 0 (0.0%) |
| Legal Services & Support | 0 (0.0%) | 0 (0.0%) |
| Education Instruction & Library | 0 (0.0%) | 10 (100.0%) |
| Arts, Media & Entertainment | 0 (0.0%) | 0 (0.0%) |
| Health Diagnosing & Treating | 1 (9.1%) | 10 (90.9%) |
| Health Technologists | 1 (9.1%) | 10 (90.9%) |
| Total (Category) | 36 (63.2%) | 21 (36.8%) |
| Total (Overall) | 136 (61.0%) | 87 (39.0%) |
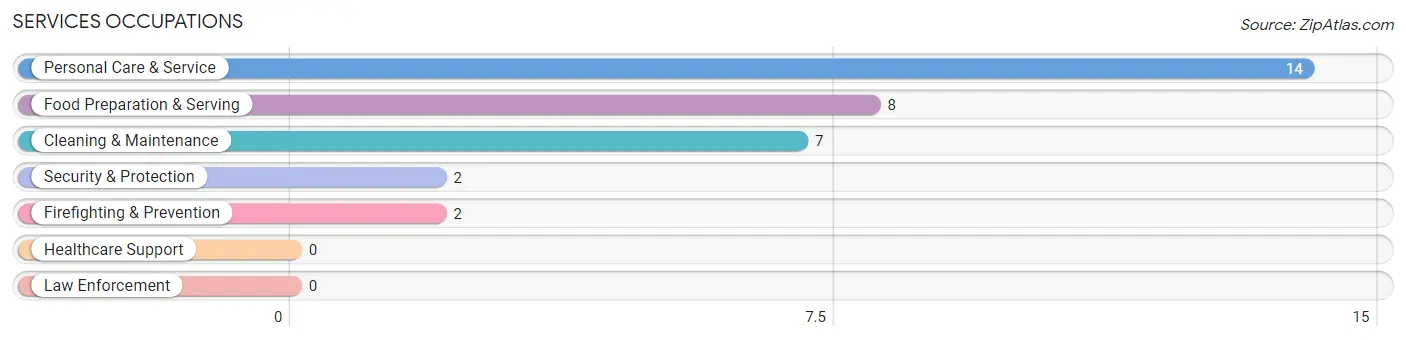
Services Occupations
The most common Services occupations in Silver Cliff are Personal Care & Service (14 | 6.3%), Food Preparation & Serving (8 | 3.6%), Cleaning & Maintenance (7 | 3.1%), Security & Protection (2 | 0.9%), and Firefighting & Prevention (2 | 0.9%).
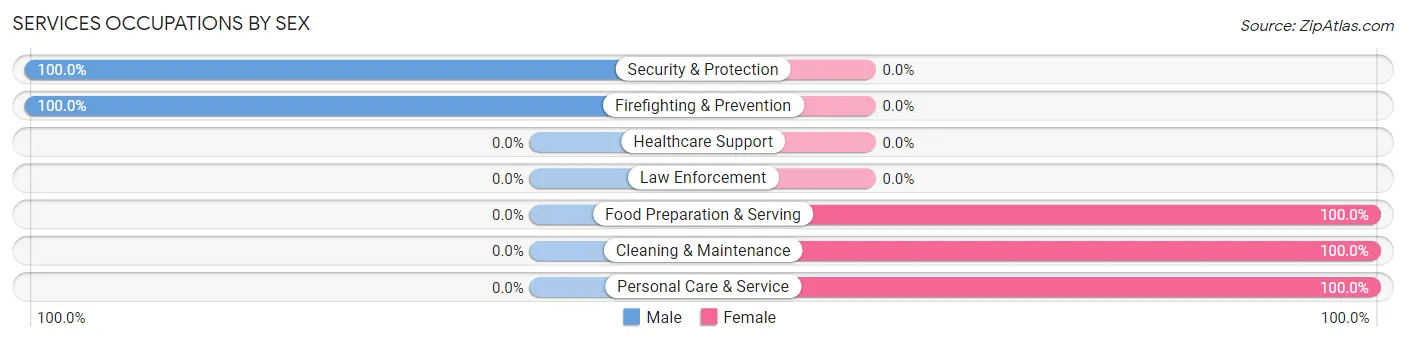
Services Occupations by Sex
Within the Services occupations in Silver Cliff, the most male-oriented occupations are Security & Protection (100.0%), and Firefighting & Prevention (100.0%), while the most female-oriented occupations are Food Preparation & Serving (100.0%), Cleaning & Maintenance (100.0%), and Personal Care & Service (100.0%).
| Occupation | Male | Female |
| Healthcare Support | 0 (0.0%) | 0 (0.0%) |
| Security & Protection | 2 (100.0%) | 0 (0.0%) |
| Firefighting & Prevention | 2 (100.0%) | 0 (0.0%) |
| Law Enforcement | 0 (0.0%) | 0 (0.0%) |
| Food Preparation & Serving | 0 (0.0%) | 8 (100.0%) |
| Cleaning & Maintenance | 0 (0.0%) | 7 (100.0%) |
| Personal Care & Service | 0 (0.0%) | 14 (100.0%) |
| Total (Category) | 2 (6.5%) | 29 (93.5%) |
| Total (Overall) | 136 (61.0%) | 87 (39.0%) |
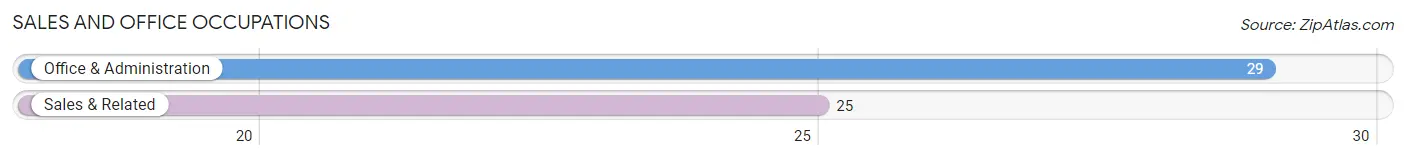
Sales and Office Occupations
The most common Sales and Office occupations in Silver Cliff are Office & Administration (29 | 13.0%), and Sales & Related (25 | 11.2%).
Sales and Office Occupations by Sex
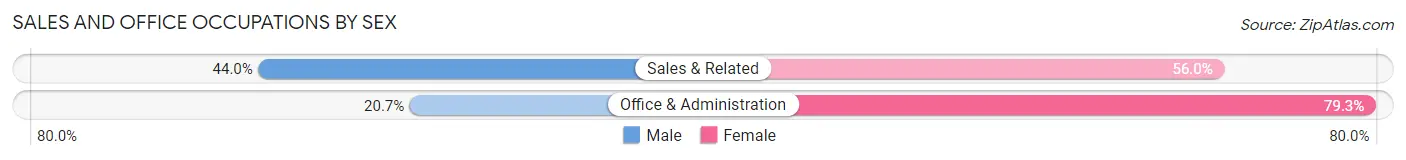
| Occupation | Male | Female |
| Sales & Related | 11 (44.0%) | 14 (56.0%) |
| Office & Administration | 6 (20.7%) | 23 (79.3%) |
| Total (Category) | 17 (31.5%) | 37 (68.5%) |
| Total (Overall) | 136 (61.0%) | 87 (39.0%) |
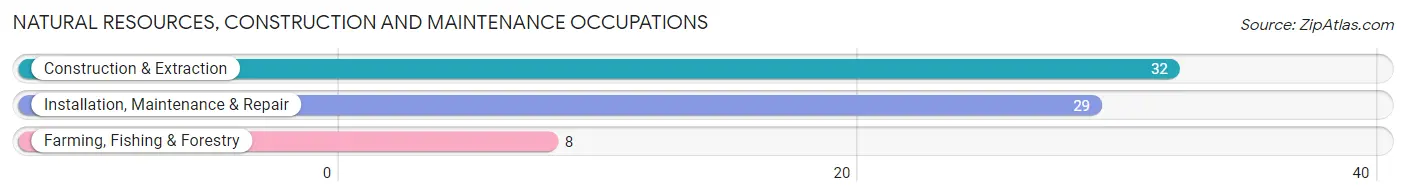
Natural Resources, Construction and Maintenance Occupations
The most common Natural Resources, Construction and Maintenance occupations in Silver Cliff are Construction & Extraction (32 | 14.3%), Installation, Maintenance & Repair (29 | 13.0%), and Farming, Fishing & Forestry (8 | 3.6%).
Natural Resources, Construction and Maintenance Occupations by Sex
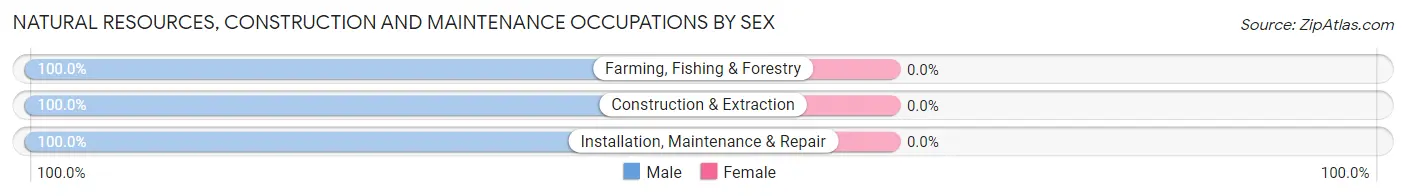
| Occupation | Male | Female |
| Farming, Fishing & Forestry | 8 (100.0%) | 0 (0.0%) |
| Construction & Extraction | 32 (100.0%) | 0 (0.0%) |
| Installation, Maintenance & Repair | 29 (100.0%) | 0 (0.0%) |
| Total (Category) | 69 (100.0%) | 0 (0.0%) |
| Total (Overall) | 136 (61.0%) | 87 (39.0%) |
Production, Transportation and Moving Occupations
The most common Production, Transportation and Moving occupations in Silver Cliff are Production (6 | 2.7%), and Transportation (6 | 2.7%).
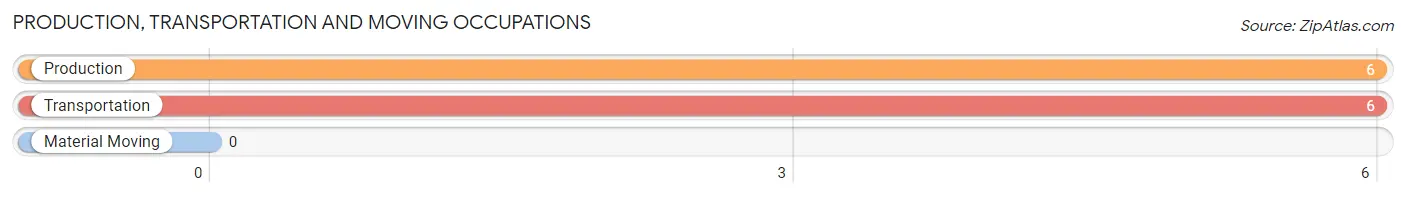
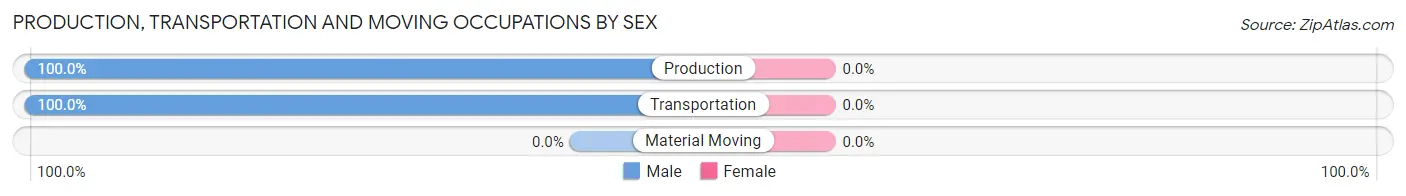
Production, Transportation and Moving Occupations by Sex
| Occupation | Male | Female |
| Production | 6 (100.0%) | 0 (0.0%) |
| Transportation | 6 (100.0%) | 0 (0.0%) |
| Material Moving | 0 (0.0%) | 0 (0.0%) |
| Total (Category) | 12 (100.0%) | 0 (0.0%) |
| Total (Overall) | 136 (61.0%) | 87 (39.0%) |
Employment Industries by Sex in Silver Cliff
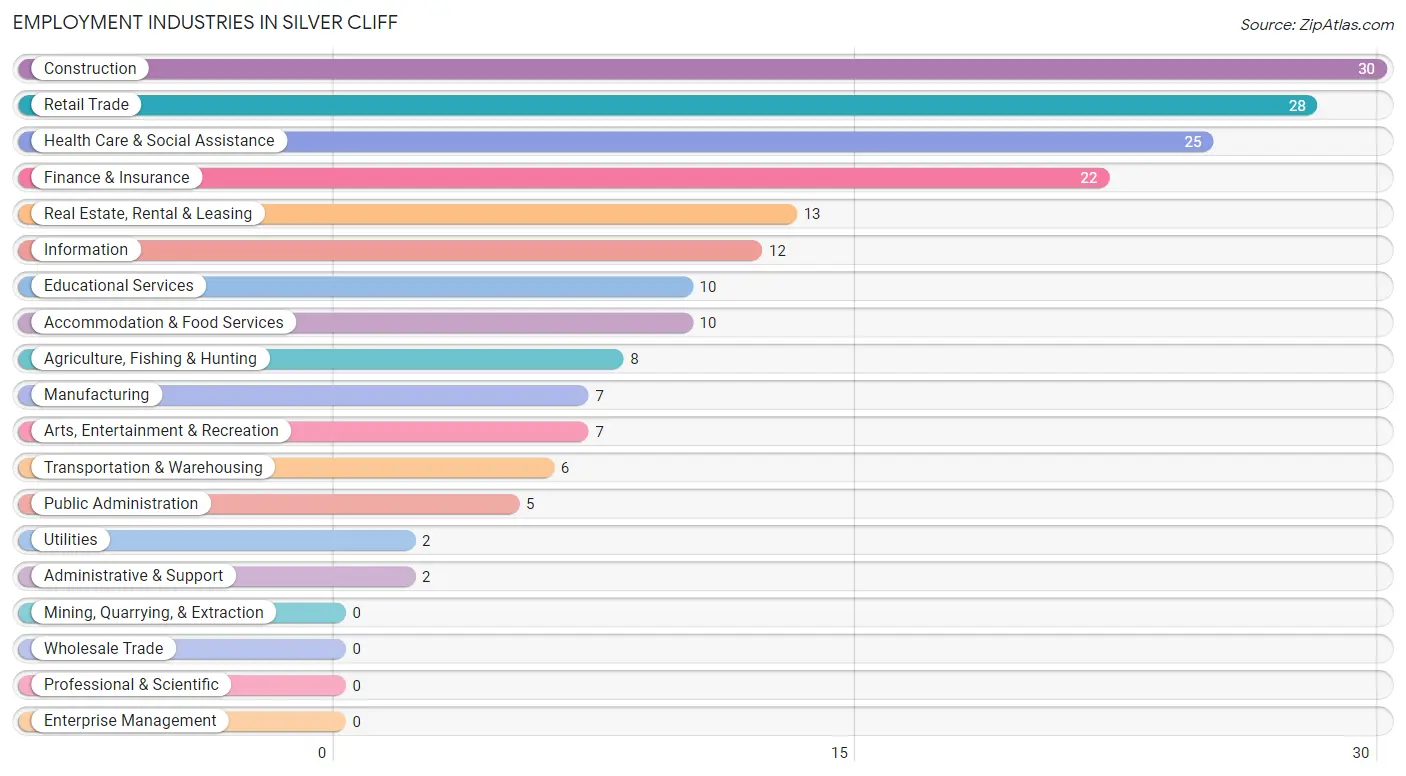
Employment Industries in Silver Cliff
The major employment industries in Silver Cliff include Construction (30 | 13.5%), Retail Trade (28 | 12.6%), Health Care & Social Assistance (25 | 11.2%), Finance & Insurance (22 | 9.9%), and Real Estate, Rental & Leasing (13 | 5.8%).
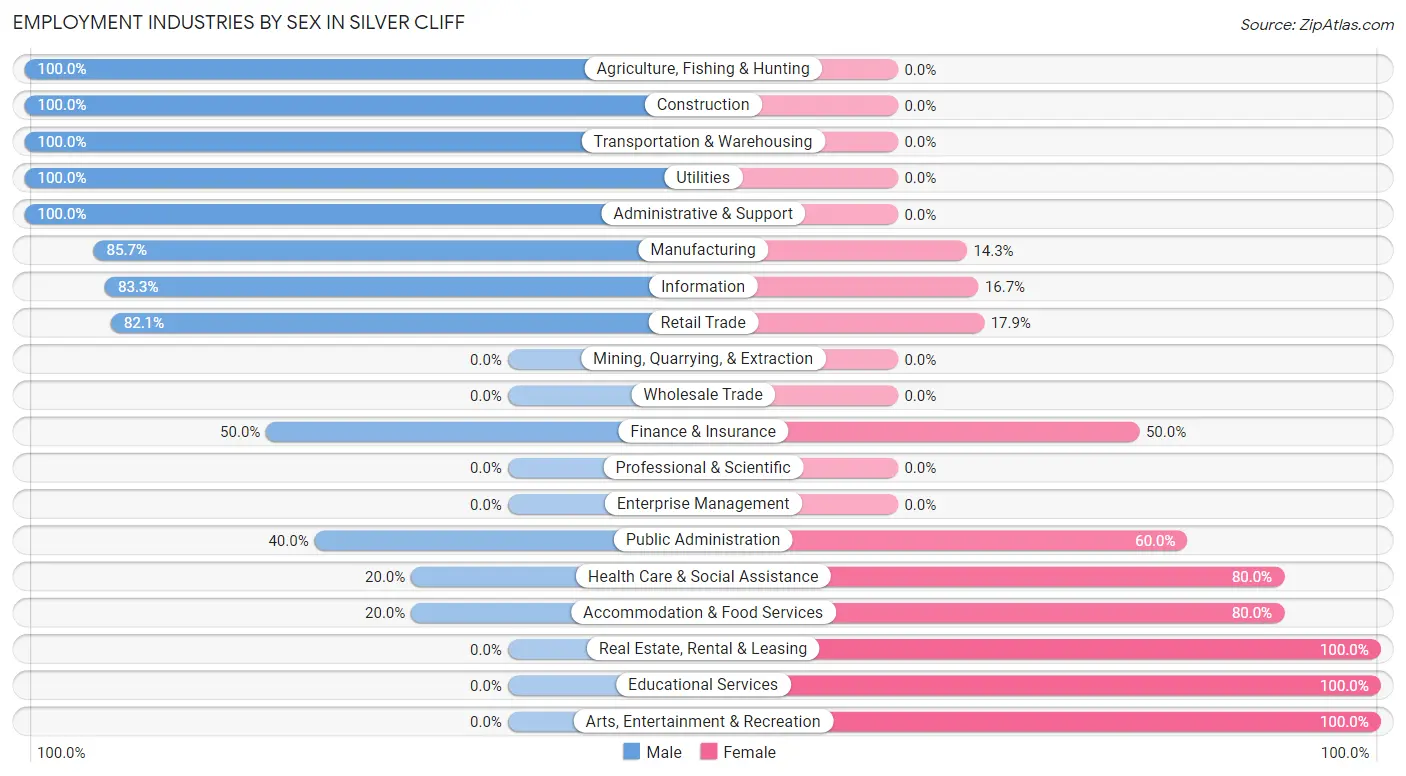
Employment Industries by Sex in Silver Cliff
The Silver Cliff industries that see more men than women are Agriculture, Fishing & Hunting (100.0%), Construction (100.0%), and Transportation & Warehousing (100.0%), whereas the industries that tend to have a higher number of women are Real Estate, Rental & Leasing (100.0%), Educational Services (100.0%), and Arts, Entertainment & Recreation (100.0%).
| Industry | Male | Female |
| Agriculture, Fishing & Hunting | 8 (100.0%) | 0 (0.0%) |
| Mining, Quarrying, & Extraction | 0 (0.0%) | 0 (0.0%) |
| Construction | 30 (100.0%) | 0 (0.0%) |
| Manufacturing | 6 (85.7%) | 1 (14.3%) |
| Wholesale Trade | 0 (0.0%) | 0 (0.0%) |
| Retail Trade | 23 (82.1%) | 5 (17.9%) |
| Transportation & Warehousing | 6 (100.0%) | 0 (0.0%) |
| Utilities | 2 (100.0%) | 0 (0.0%) |
| Information | 10 (83.3%) | 2 (16.7%) |
| Finance & Insurance | 11 (50.0%) | 11 (50.0%) |
| Real Estate, Rental & Leasing | 0 (0.0%) | 13 (100.0%) |
| Professional & Scientific | 0 (0.0%) | 0 (0.0%) |
| Enterprise Management | 0 (0.0%) | 0 (0.0%) |
| Administrative & Support | 2 (100.0%) | 0 (0.0%) |
| Educational Services | 0 (0.0%) | 10 (100.0%) |
| Health Care & Social Assistance | 5 (20.0%) | 20 (80.0%) |
| Arts, Entertainment & Recreation | 0 (0.0%) | 7 (100.0%) |
| Accommodation & Food Services | 2 (20.0%) | 8 (80.0%) |
| Public Administration | 2 (40.0%) | 3 (60.0%) |
| Total | 136 (61.0%) | 87 (39.0%) |
Education in Silver Cliff
School Enrollment in Silver Cliff
The most common levels of schooling among the 246 students in Silver Cliff are elementary school (94 | 38.2%), middle school (84 | 34.2%), and high school (38 | 15.4%).
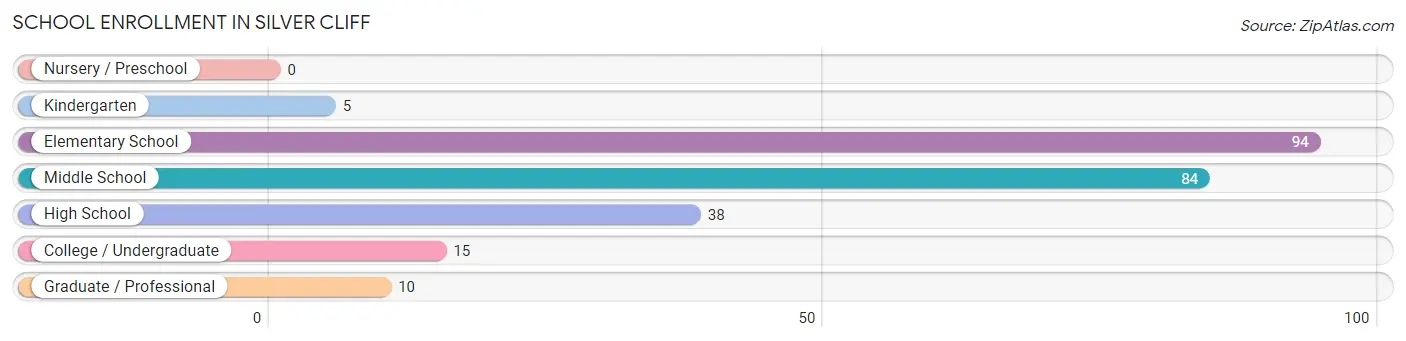
| School Level | # Students | % Students |
| Nursery / Preschool | 0 | 0.0% |
| Kindergarten | 5 | 2.0% |
| Elementary School | 94 | 38.2% |
| Middle School | 84 | 34.2% |
| High School | 38 | 15.4% |
| College / Undergraduate | 15 | 6.1% |
| Graduate / Professional | 10 | 4.1% |
| Total | 246 | 100.0% |
School Enrollment by Age by Funding Source in Silver Cliff
Out of a total of 246 students who are enrolled in schools in Silver Cliff, 26 (10.6%) attend a private institution, while the remaining 220 (89.4%) are enrolled in public schools. The age group of 15 to 17 year olds has the highest likelihood of being enrolled in private schools, with 18 (43.9% in the age bracket) enrolled. Conversely, the age group of 5 to 9 year old has the lowest likelihood of being enrolled in a private school, with 99 (100.0% in the age bracket) attending a public institution.
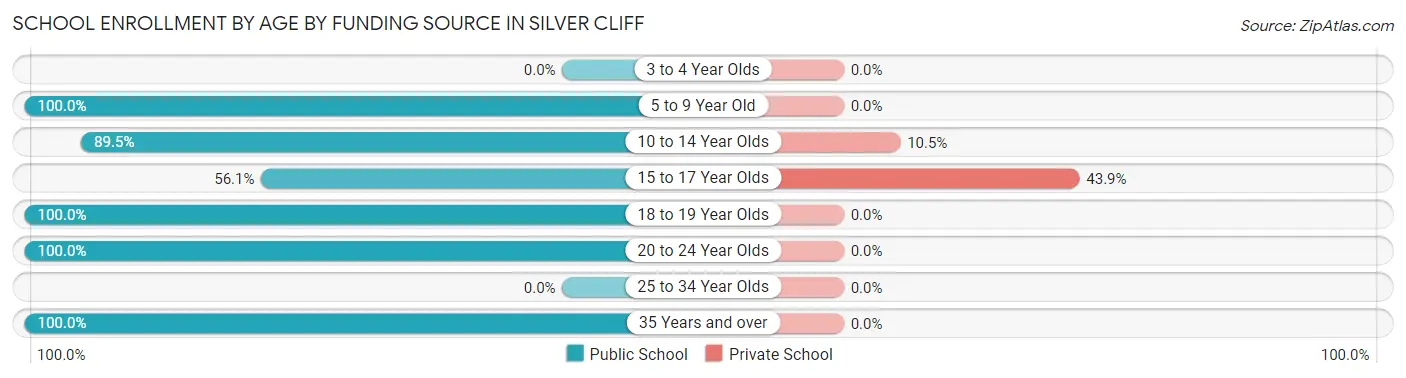
| Age Bracket | Public School | Private School |
| 3 to 4 Year Olds | 0 (0.0%) | 0 (0.0%) |
| 5 to 9 Year Old | 99 (100.0%) | 0 (0.0%) |
| 10 to 14 Year Olds | 68 (89.5%) | 8 (10.5%) |
| 15 to 17 Year Olds | 23 (56.1%) | 18 (43.9%) |
| 18 to 19 Year Olds | 5 (100.0%) | 0 (0.0%) |
| 20 to 24 Year Olds | 15 (100.0%) | 0 (0.0%) |
| 25 to 34 Year Olds | 0 (0.0%) | 0 (0.0%) |
| 35 Years and over | 10 (100.0%) | 0 (0.0%) |
| Total | 220 (89.4%) | 26 (10.6%) |
Educational Attainment by Field of Study in Silver Cliff
Science & technology (10 | 15.4%), business (10 | 15.4%), liberal arts & history (9 | 13.9%), bio, nature & agricultural (8 | 12.3%), and physical & health sciences (8 | 12.3%) are the most common fields of study among 65 individuals in Silver Cliff who have obtained a bachelor's degree or higher.
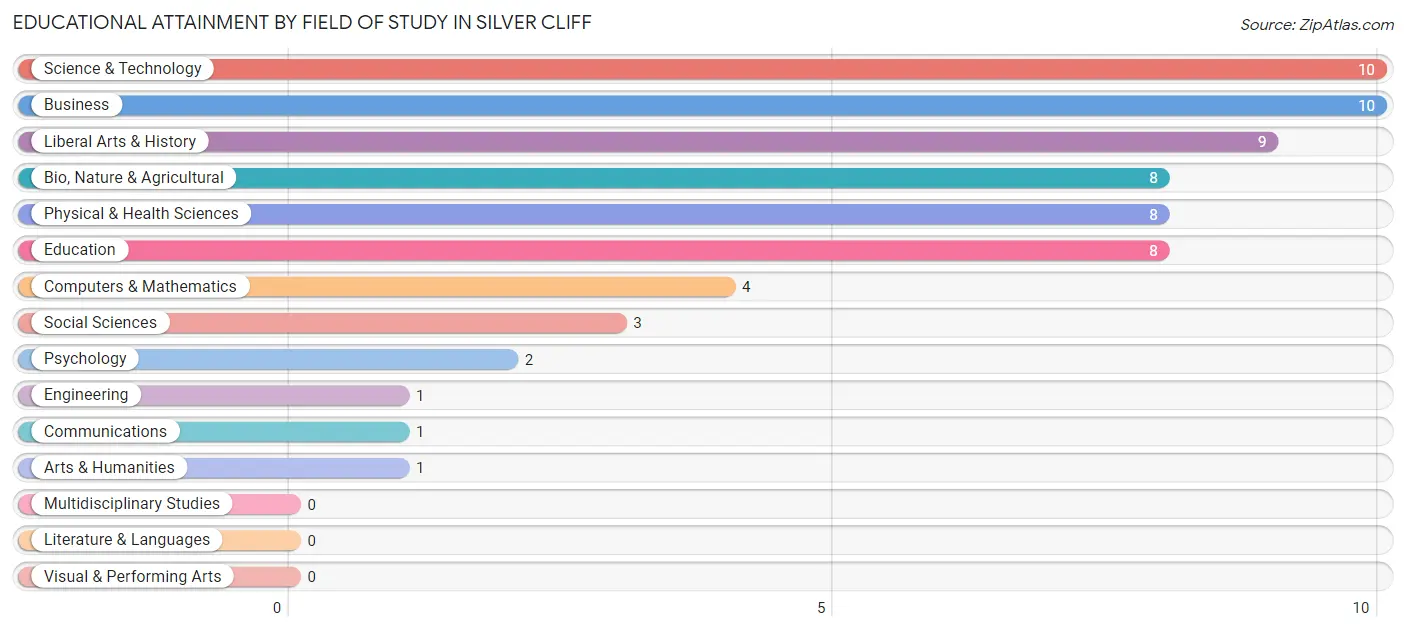
| Field of Study | # Graduates | % Graduates |
| Computers & Mathematics | 4 | 6.1% |
| Bio, Nature & Agricultural | 8 | 12.3% |
| Physical & Health Sciences | 8 | 12.3% |
| Psychology | 2 | 3.1% |
| Social Sciences | 3 | 4.6% |
| Engineering | 1 | 1.5% |
| Multidisciplinary Studies | 0 | 0.0% |
| Science & Technology | 10 | 15.4% |
| Business | 10 | 15.4% |
| Education | 8 | 12.3% |
| Literature & Languages | 0 | 0.0% |
| Liberal Arts & History | 9 | 13.9% |
| Visual & Performing Arts | 0 | 0.0% |
| Communications | 1 | 1.5% |
| Arts & Humanities | 1 | 1.5% |
| Total | 65 | 100.0% |
Transportation & Commute in Silver Cliff
Vehicle Availability by Sex in Silver Cliff
The most prevalent vehicle ownership categories in Silver Cliff are males with 2 vehicles (54, accounting for 40.3%) and females with 2 vehicles (29, making up 62.1%).
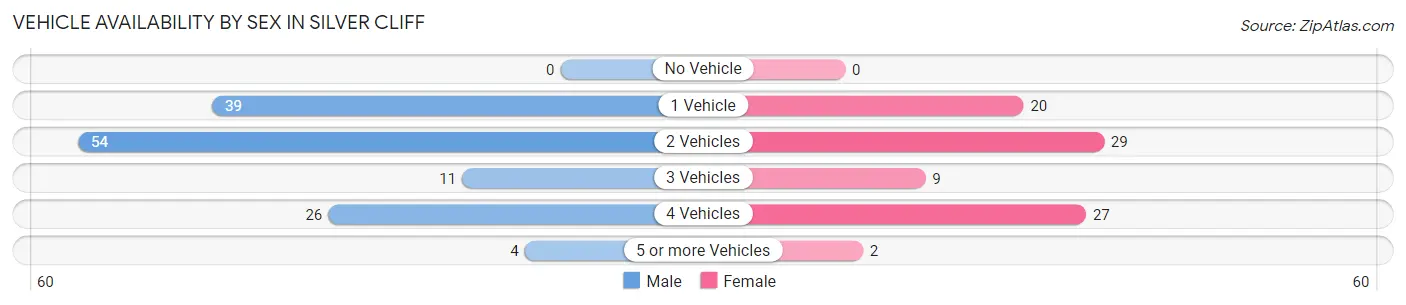
| Vehicles Available | Male | Female |
| No Vehicle | 0 (0.0%) | 0 (0.0%) |
| 1 Vehicle | 39 (29.1%) | 20 (23.0%) |
| 2 Vehicles | 54 (40.3%) | 29 (33.3%) |
| 3 Vehicles | 11 (8.2%) | 9 (10.3%) |
| 4 Vehicles | 26 (19.4%) | 27 (31.0%) |
| 5 or more Vehicles | 4 (3.0%) | 2 (2.3%) |
| Total | 134 (100.0%) | 87 (100.0%) |
Commute Time in Silver Cliff
The most frequently occuring commute durations in Silver Cliff are 5 to 9 minutes (73 commuters, 35.3%), less than 5 minutes (45 commuters, 21.7%), and 10 to 14 minutes (33 commuters, 15.9%).
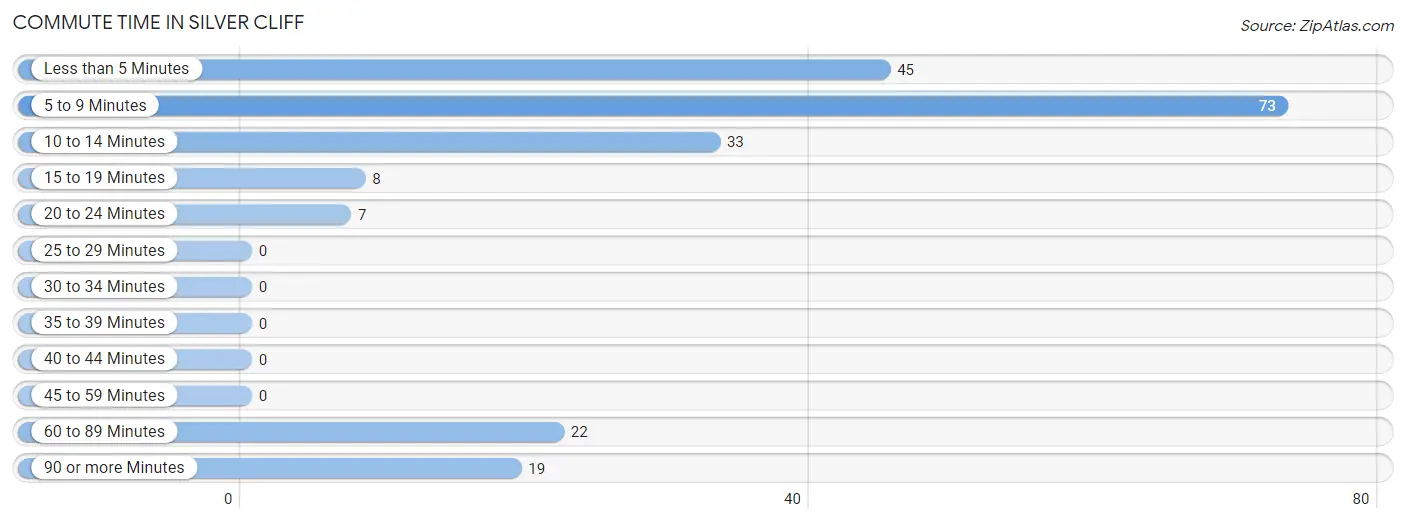
| Commute Time | # Commuters | % Commuters |
| Less than 5 Minutes | 45 | 21.7% |
| 5 to 9 Minutes | 73 | 35.3% |
| 10 to 14 Minutes | 33 | 15.9% |
| 15 to 19 Minutes | 8 | 3.9% |
| 20 to 24 Minutes | 7 | 3.4% |
| 25 to 29 Minutes | 0 | 0.0% |
| 30 to 34 Minutes | 0 | 0.0% |
| 35 to 39 Minutes | 0 | 0.0% |
| 40 to 44 Minutes | 0 | 0.0% |
| 45 to 59 Minutes | 0 | 0.0% |
| 60 to 89 Minutes | 22 | 10.6% |
| 90 or more Minutes | 19 | 9.2% |
Commute Time by Sex in Silver Cliff
The most common commute times in Silver Cliff are 5 to 9 minutes (57 commuters, 46.7%) for males and less than 5 minutes (33 commuters, 38.8%) for females.
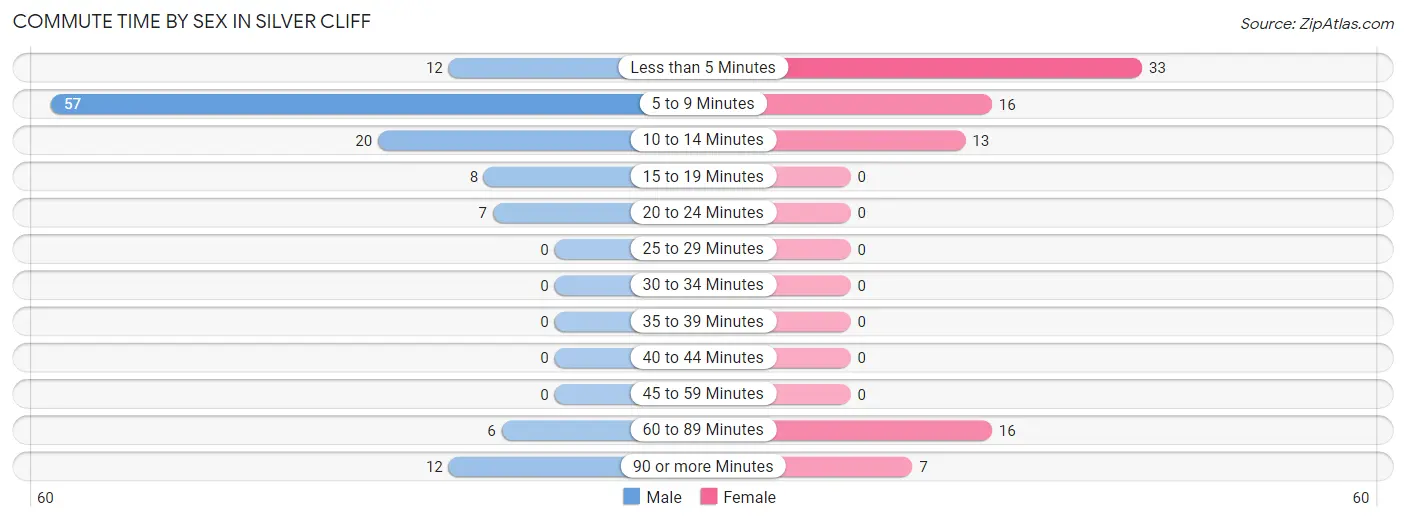
| Commute Time | Male | Female |
| Less than 5 Minutes | 12 (9.8%) | 33 (38.8%) |
| 5 to 9 Minutes | 57 (46.7%) | 16 (18.8%) |
| 10 to 14 Minutes | 20 (16.4%) | 13 (15.3%) |
| 15 to 19 Minutes | 8 (6.6%) | 0 (0.0%) |
| 20 to 24 Minutes | 7 (5.7%) | 0 (0.0%) |
| 25 to 29 Minutes | 0 (0.0%) | 0 (0.0%) |
| 30 to 34 Minutes | 0 (0.0%) | 0 (0.0%) |
| 35 to 39 Minutes | 0 (0.0%) | 0 (0.0%) |
| 40 to 44 Minutes | 0 (0.0%) | 0 (0.0%) |
| 45 to 59 Minutes | 0 (0.0%) | 0 (0.0%) |
| 60 to 89 Minutes | 6 (4.9%) | 16 (18.8%) |
| 90 or more Minutes | 12 (9.8%) | 7 (8.2%) |
Time of Departure to Work by Sex in Silver Cliff
The most frequent times of departure to work in Silver Cliff are 6:30 AM to 6:59 AM (32, 26.2%) for males and 8:00 AM to 8:29 AM (25, 29.4%) for females.
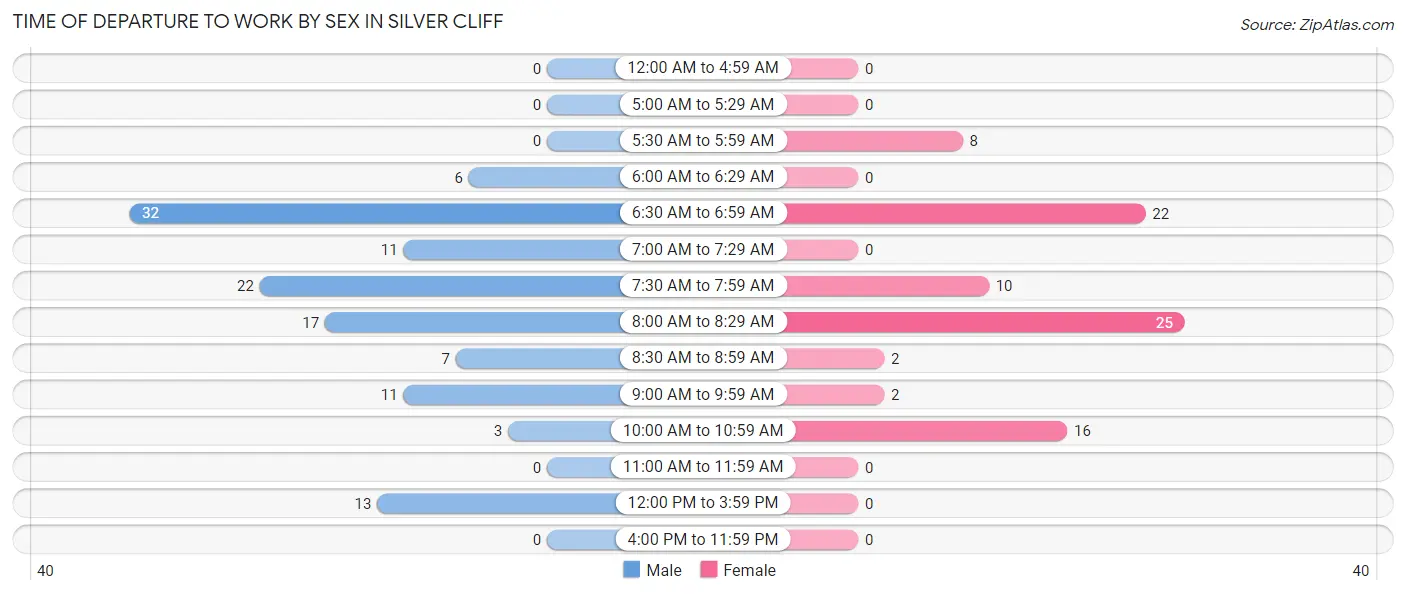
| Time of Departure | Male | Female |
| 12:00 AM to 4:59 AM | 0 (0.0%) | 0 (0.0%) |
| 5:00 AM to 5:29 AM | 0 (0.0%) | 0 (0.0%) |
| 5:30 AM to 5:59 AM | 0 (0.0%) | 8 (9.4%) |
| 6:00 AM to 6:29 AM | 6 (4.9%) | 0 (0.0%) |
| 6:30 AM to 6:59 AM | 32 (26.2%) | 22 (25.9%) |
| 7:00 AM to 7:29 AM | 11 (9.0%) | 0 (0.0%) |
| 7:30 AM to 7:59 AM | 22 (18.0%) | 10 (11.8%) |
| 8:00 AM to 8:29 AM | 17 (13.9%) | 25 (29.4%) |
| 8:30 AM to 8:59 AM | 7 (5.7%) | 2 (2.4%) |
| 9:00 AM to 9:59 AM | 11 (9.0%) | 2 (2.4%) |
| 10:00 AM to 10:59 AM | 3 (2.5%) | 16 (18.8%) |
| 11:00 AM to 11:59 AM | 0 (0.0%) | 0 (0.0%) |
| 12:00 PM to 3:59 PM | 13 (10.7%) | 0 (0.0%) |
| 4:00 PM to 11:59 PM | 0 (0.0%) | 0 (0.0%) |
| Total | 122 (100.0%) | 85 (100.0%) |
Housing Occupancy in Silver Cliff
Occupancy by Ownership in Silver Cliff
Of the total 269 dwellings in Silver Cliff, owner-occupied units account for 150 (55.8%), while renter-occupied units make up 119 (44.2%).
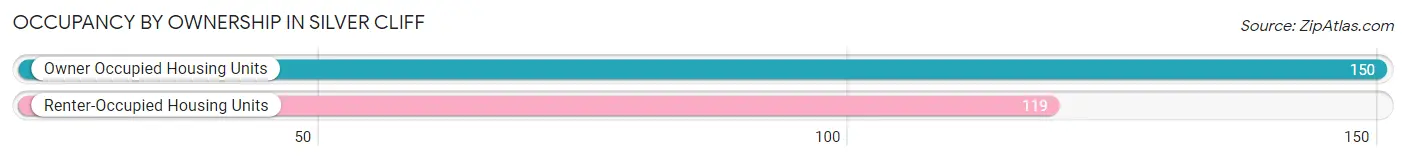
| Occupancy | # Housing Units | % Housing Units |
| Owner Occupied Housing Units | 150 | 55.8% |
| Renter-Occupied Housing Units | 119 | 44.2% |
| Total Occupied Housing Units | 269 | 100.0% |
Occupancy by Household Size in Silver Cliff
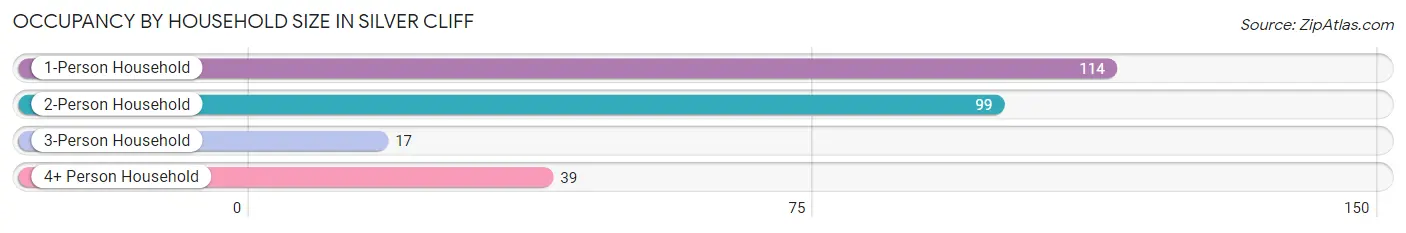
| Household Size | # Housing Units | % Housing Units |
| 1-Person Household | 114 | 42.4% |
| 2-Person Household | 99 | 36.8% |
| 3-Person Household | 17 | 6.3% |
| 4+ Person Household | 39 | 14.5% |
| Total Housing Units | 269 | 100.0% |
Occupancy by Ownership by Household Size in Silver Cliff
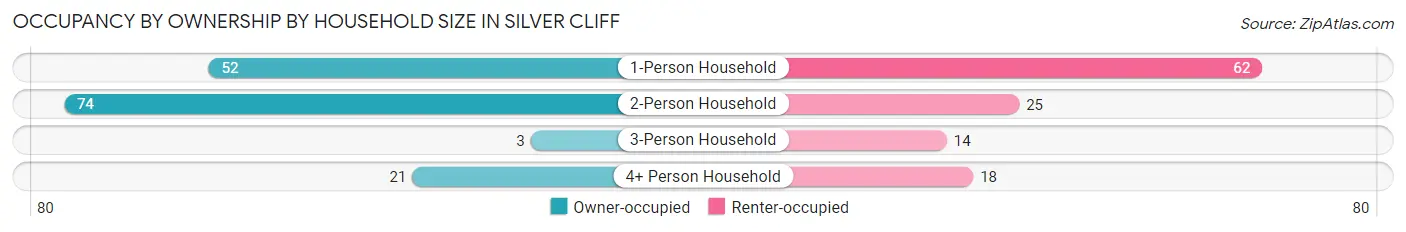
| Household Size | Owner-occupied | Renter-occupied |
| 1-Person Household | 52 (45.6%) | 62 (54.4%) |
| 2-Person Household | 74 (74.8%) | 25 (25.3%) |
| 3-Person Household | 3 (17.6%) | 14 (82.4%) |
| 4+ Person Household | 21 (53.8%) | 18 (46.2%) |
| Total Housing Units | 150 (55.8%) | 119 (44.2%) |
Occupancy by Educational Attainment in Silver Cliff
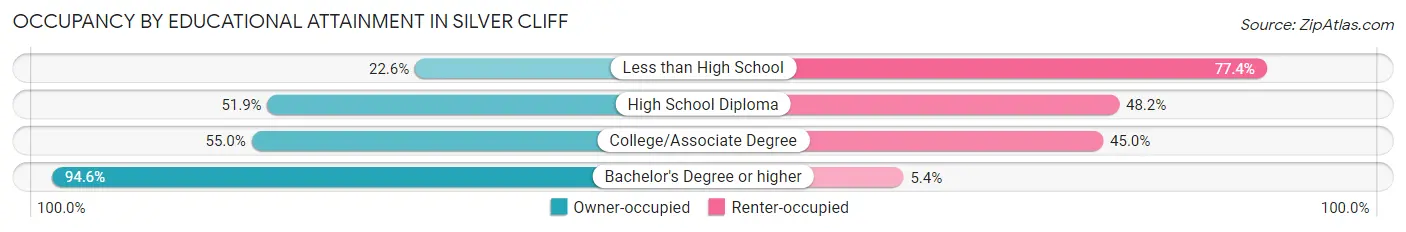
| Household Size | Owner-occupied | Renter-occupied |
| Less than High School | 7 (22.6%) | 24 (77.4%) |
| High School Diploma | 42 (51.8%) | 39 (48.1%) |
| College/Associate Degree | 66 (55.0%) | 54 (45.0%) |
| Bachelor's Degree or higher | 35 (94.6%) | 2 (5.4%) |
Occupancy by Age of Householder in Silver Cliff
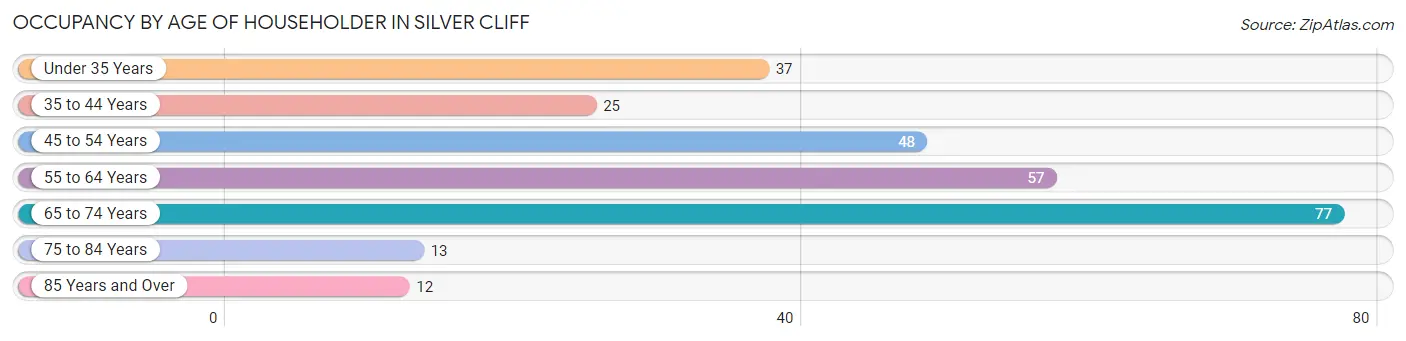
| Age Bracket | # Households | % Households |
| Under 35 Years | 37 | 13.8% |
| 35 to 44 Years | 25 | 9.3% |
| 45 to 54 Years | 48 | 17.8% |
| 55 to 64 Years | 57 | 21.2% |
| 65 to 74 Years | 77 | 28.6% |
| 75 to 84 Years | 13 | 4.8% |
| 85 Years and Over | 12 | 4.5% |
| Total | 269 | 100.0% |
Housing Finances in Silver Cliff
Median Income by Occupancy in Silver Cliff
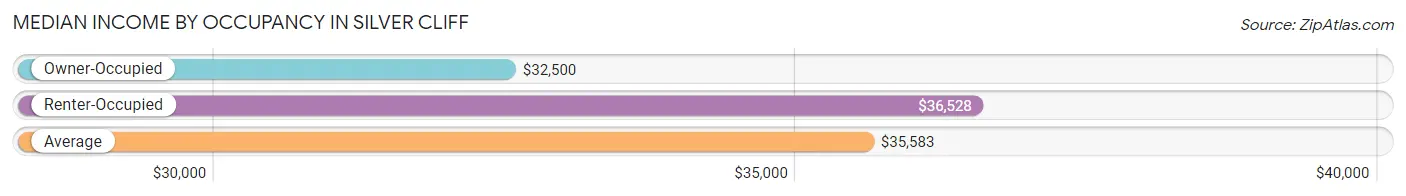
| Occupancy Type | # Households | Median Income |
| Owner-Occupied | 150 (55.8%) | $32,500 |
| Renter-Occupied | 119 (44.2%) | $36,528 |
| Average | 269 (100.0%) | $35,583 |
Occupancy by Householder Income Bracket in Silver Cliff
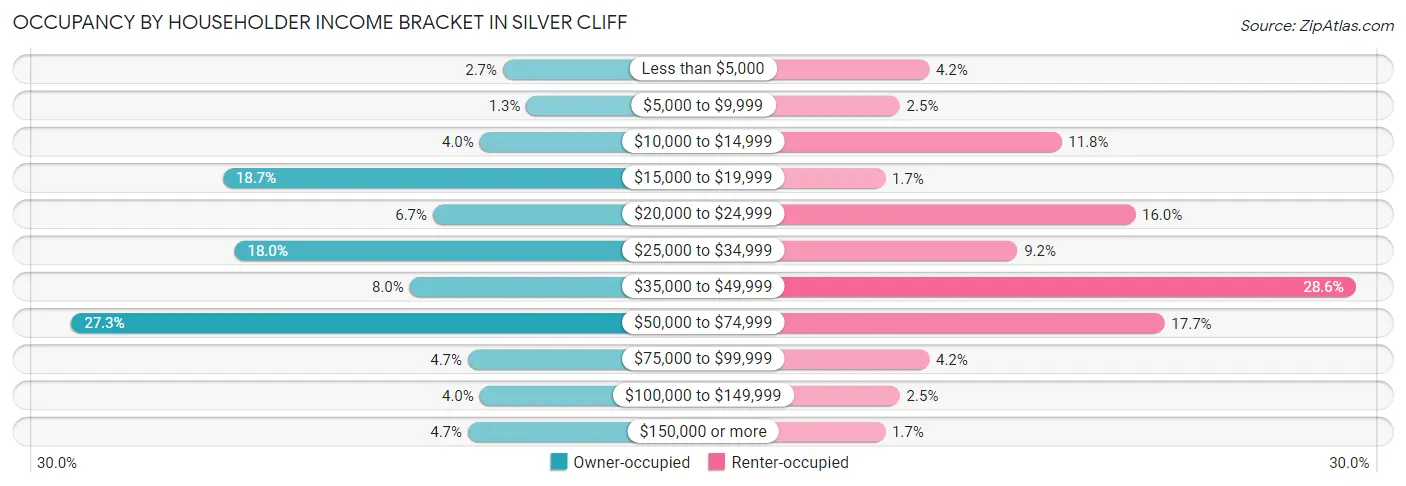
| Income Bracket | Owner-occupied | Renter-occupied |
| Less than $5,000 | 4 (2.7%) | 5 (4.2%) |
| $5,000 to $9,999 | 2 (1.3%) | 3 (2.5%) |
| $10,000 to $14,999 | 6 (4.0%) | 14 (11.8%) |
| $15,000 to $19,999 | 28 (18.7%) | 2 (1.7%) |
| $20,000 to $24,999 | 10 (6.7%) | 19 (16.0%) |
| $25,000 to $34,999 | 27 (18.0%) | 11 (9.2%) |
| $35,000 to $49,999 | 12 (8.0%) | 34 (28.6%) |
| $50,000 to $74,999 | 41 (27.3%) | 21 (17.6%) |
| $75,000 to $99,999 | 7 (4.7%) | 5 (4.2%) |
| $100,000 to $149,999 | 6 (4.0%) | 3 (2.5%) |
| $150,000 or more | 7 (4.7%) | 2 (1.7%) |
| Total | 150 (100.0%) | 119 (100.0%) |
Monthly Housing Cost Tiers in Silver Cliff
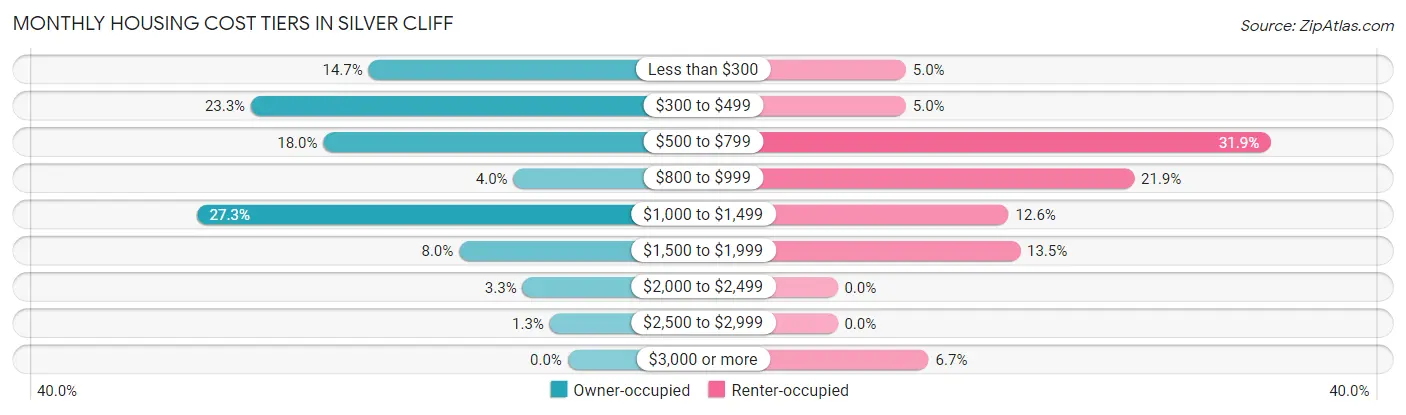
| Monthly Cost | Owner-occupied | Renter-occupied |
| Less than $300 | 22 (14.7%) | 6 (5.0%) |
| $300 to $499 | 35 (23.3%) | 6 (5.0%) |
| $500 to $799 | 27 (18.0%) | 38 (31.9%) |
| $800 to $999 | 6 (4.0%) | 26 (21.8%) |
| $1,000 to $1,499 | 41 (27.3%) | 15 (12.6%) |
| $1,500 to $1,999 | 12 (8.0%) | 16 (13.5%) |
| $2,000 to $2,499 | 5 (3.3%) | 0 (0.0%) |
| $2,500 to $2,999 | 2 (1.3%) | 0 (0.0%) |
| $3,000 or more | 0 (0.0%) | 8 (6.7%) |
| Total | 150 (100.0%) | 119 (100.0%) |
Physical Housing Characteristics in Silver Cliff
Housing Structures in Silver Cliff
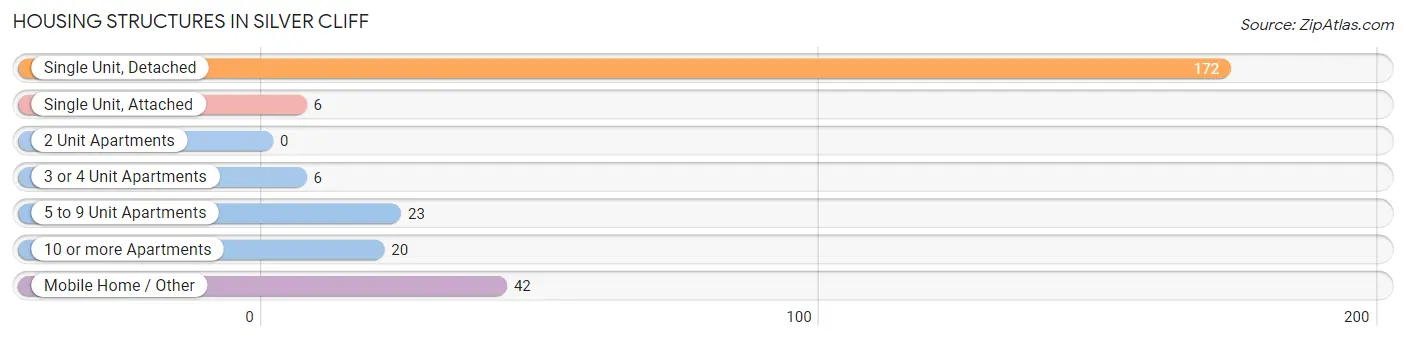
| Structure Type | # Housing Units | % Housing Units |
| Single Unit, Detached | 172 | 63.9% |
| Single Unit, Attached | 6 | 2.2% |
| 2 Unit Apartments | 0 | 0.0% |
| 3 or 4 Unit Apartments | 6 | 2.2% |
| 5 to 9 Unit Apartments | 23 | 8.6% |
| 10 or more Apartments | 20 | 7.4% |
| Mobile Home / Other | 42 | 15.6% |
| Total | 269 | 100.0% |
Housing Structures by Occupancy in Silver Cliff
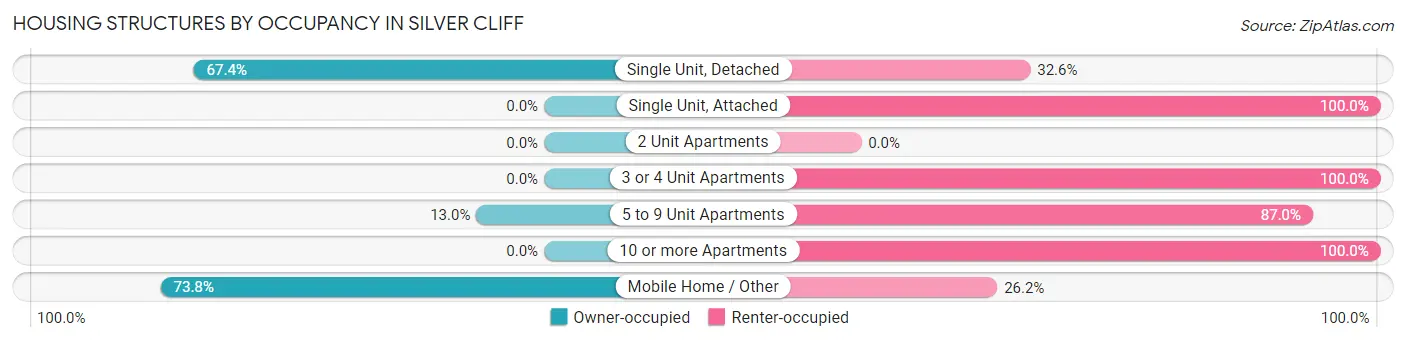
| Structure Type | Owner-occupied | Renter-occupied |
| Single Unit, Detached | 116 (67.4%) | 56 (32.6%) |
| Single Unit, Attached | 0 (0.0%) | 6 (100.0%) |
| 2 Unit Apartments | 0 (0.0%) | 0 (0.0%) |
| 3 or 4 Unit Apartments | 0 (0.0%) | 6 (100.0%) |
| 5 to 9 Unit Apartments | 3 (13.0%) | 20 (87.0%) |
| 10 or more Apartments | 0 (0.0%) | 20 (100.0%) |
| Mobile Home / Other | 31 (73.8%) | 11 (26.2%) |
| Total | 150 (55.8%) | 119 (44.2%) |
Housing Structures by Number of Rooms in Silver Cliff
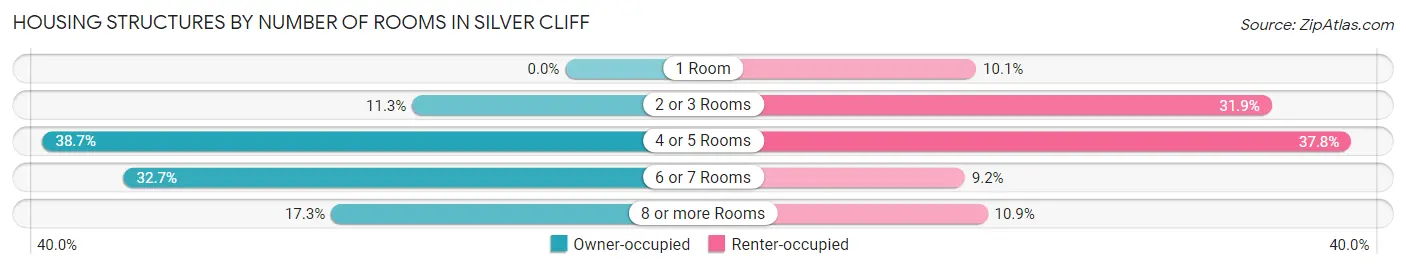
| Number of Rooms | Owner-occupied | Renter-occupied |
| 1 Room | 0 (0.0%) | 12 (10.1%) |
| 2 or 3 Rooms | 17 (11.3%) | 38 (31.9%) |
| 4 or 5 Rooms | 58 (38.7%) | 45 (37.8%) |
| 6 or 7 Rooms | 49 (32.7%) | 11 (9.2%) |
| 8 or more Rooms | 26 (17.3%) | 13 (10.9%) |
| Total | 150 (100.0%) | 119 (100.0%) |
Housing Structure by Heating Type in Silver Cliff
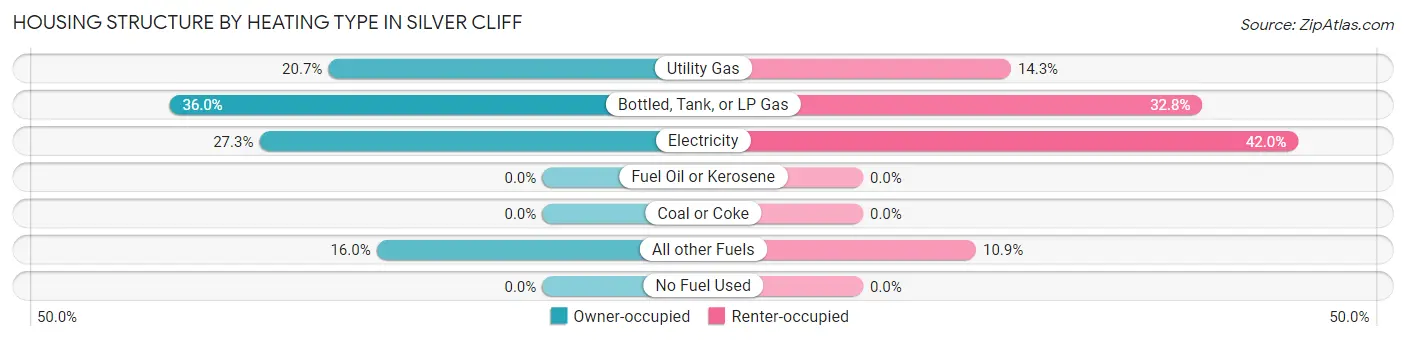
| Heating Type | Owner-occupied | Renter-occupied |
| Utility Gas | 31 (20.7%) | 17 (14.3%) |
| Bottled, Tank, or LP Gas | 54 (36.0%) | 39 (32.8%) |
| Electricity | 41 (27.3%) | 50 (42.0%) |
| Fuel Oil or Kerosene | 0 (0.0%) | 0 (0.0%) |
| Coal or Coke | 0 (0.0%) | 0 (0.0%) |
| All other Fuels | 24 (16.0%) | 13 (10.9%) |
| No Fuel Used | 0 (0.0%) | 0 (0.0%) |
| Total | 150 (100.0%) | 119 (100.0%) |
Household Vehicle Usage in Silver Cliff
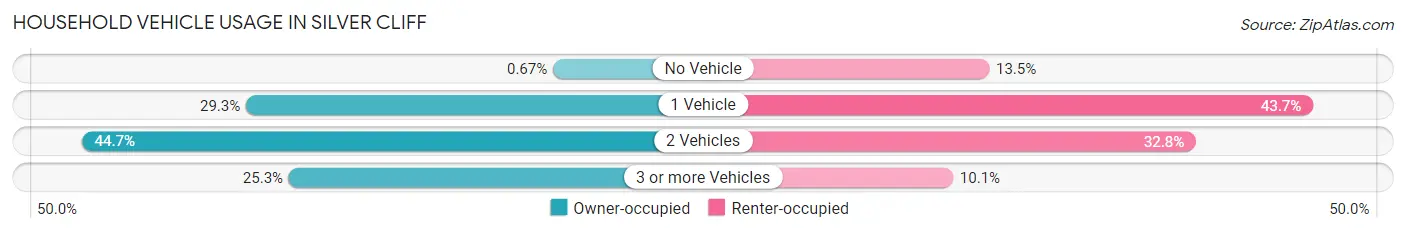
| Vehicles per Household | Owner-occupied | Renter-occupied |
| No Vehicle | 1 (0.7%) | 16 (13.5%) |
| 1 Vehicle | 44 (29.3%) | 52 (43.7%) |
| 2 Vehicles | 67 (44.7%) | 39 (32.8%) |
| 3 or more Vehicles | 38 (25.3%) | 12 (10.1%) |
| Total | 150 (100.0%) | 119 (100.0%) |
Real Estate & Mortgages in Silver Cliff
Real Estate and Mortgage Overview in Silver Cliff
| Characteristic | Without Mortgage | With Mortgage |
| Housing Units | 94 | 56 |
| Median Property Value | $208,300 | $241,700 |
| Median Household Income | $28,529 | $4 |
| Monthly Housing Costs | $417 | $0 |
| Real Estate Taxes | $825 | $3 |
Property Value by Mortgage Status in Silver Cliff
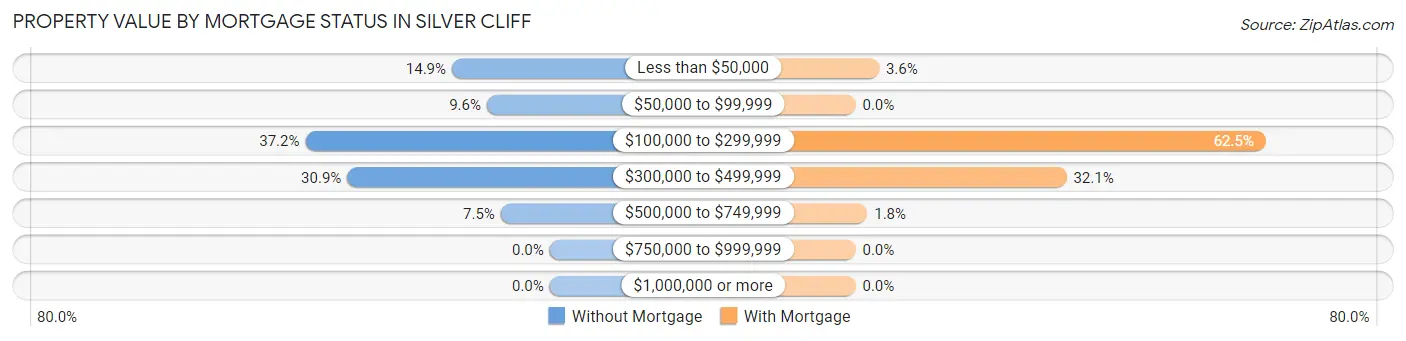
| Property Value | Without Mortgage | With Mortgage |
| Less than $50,000 | 14 (14.9%) | 2 (3.6%) |
| $50,000 to $99,999 | 9 (9.6%) | 0 (0.0%) |
| $100,000 to $299,999 | 35 (37.2%) | 35 (62.5%) |
| $300,000 to $499,999 | 29 (30.8%) | 18 (32.1%) |
| $500,000 to $749,999 | 7 (7.4%) | 1 (1.8%) |
| $750,000 to $999,999 | 0 (0.0%) | 0 (0.0%) |
| $1,000,000 or more | 0 (0.0%) | 0 (0.0%) |
| Total | 94 (100.0%) | 56 (100.0%) |
Household Income by Mortgage Status in Silver Cliff
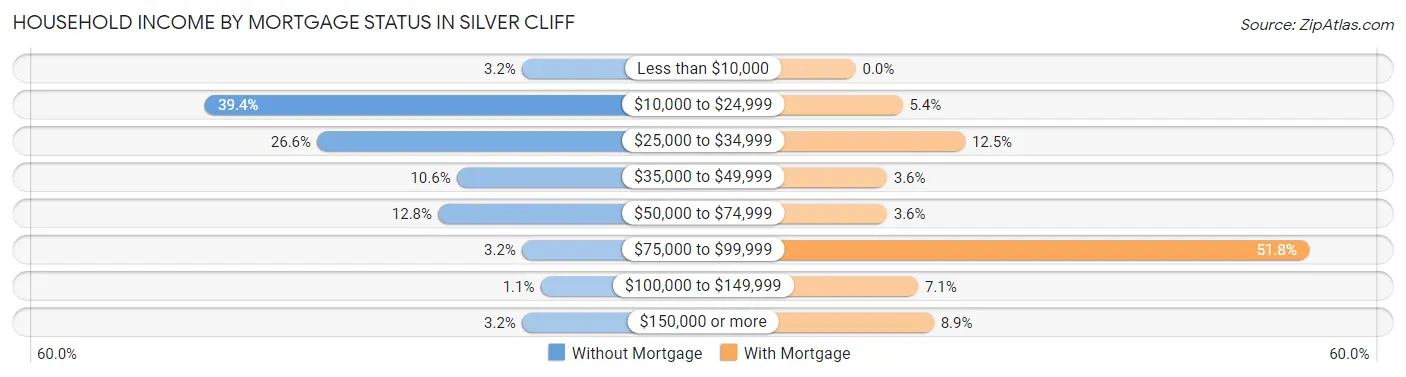
| Household Income | Without Mortgage | With Mortgage |
| Less than $10,000 | 3 (3.2%) | 0 (0.0%) |
| $10,000 to $24,999 | 37 (39.4%) | 3 (5.4%) |
| $25,000 to $34,999 | 25 (26.6%) | 7 (12.5%) |
| $35,000 to $49,999 | 10 (10.6%) | 2 (3.6%) |
| $50,000 to $74,999 | 12 (12.8%) | 2 (3.6%) |
| $75,000 to $99,999 | 3 (3.2%) | 29 (51.8%) |
| $100,000 to $149,999 | 1 (1.1%) | 4 (7.1%) |
| $150,000 or more | 3 (3.2%) | 5 (8.9%) |
| Total | 94 (100.0%) | 56 (100.0%) |
Property Value to Household Income Ratio in Silver Cliff
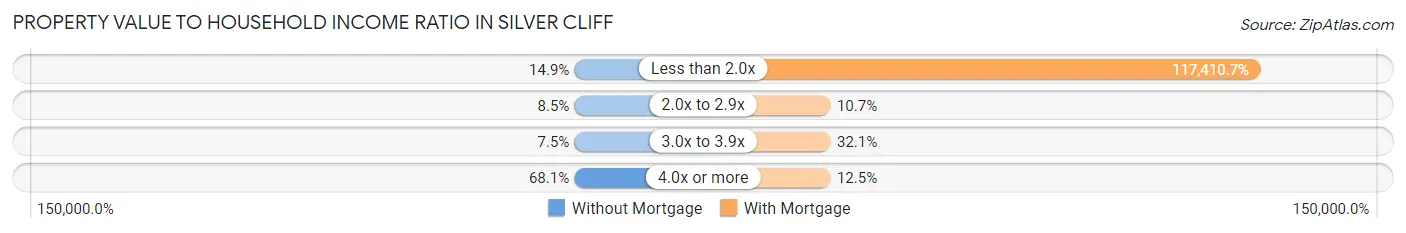
| Value-to-Income Ratio | Without Mortgage | With Mortgage |
| Less than 2.0x | 14 (14.9%) | 65,750 (117,410.7%) |
| 2.0x to 2.9x | 8 (8.5%) | 6 (10.7%) |
| 3.0x to 3.9x | 7 (7.4%) | 18 (32.1%) |
| 4.0x or more | 64 (68.1%) | 7 (12.5%) |
| Total | 94 (100.0%) | 56 (100.0%) |
Real Estate Taxes by Mortgage Status in Silver Cliff
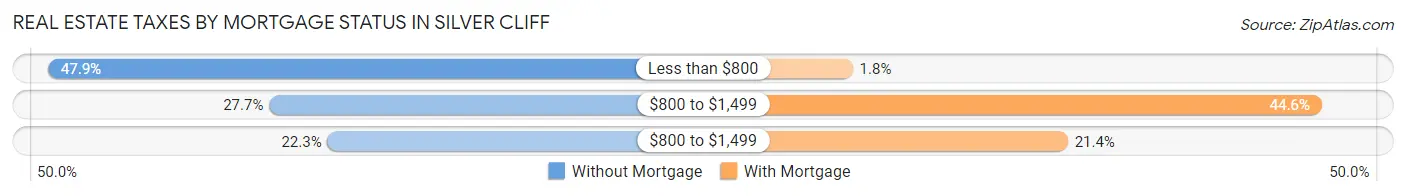
| Property Taxes | Without Mortgage | With Mortgage |
| Less than $800 | 45 (47.9%) | 1 (1.8%) |
| $800 to $1,499 | 26 (27.7%) | 25 (44.6%) |
| $800 to $1,499 | 21 (22.3%) | 12 (21.4%) |
| Total | 94 (100.0%) | 56 (100.0%) |
Health & Disability in Silver Cliff
Health Insurance Coverage by Age in Silver Cliff
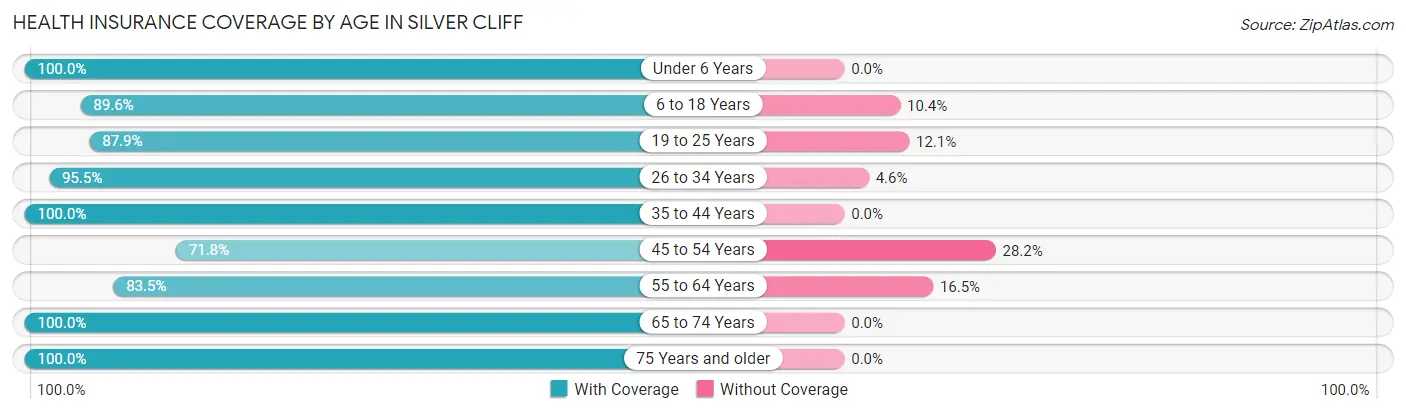
| Age Bracket | With Coverage | Without Coverage |
| Under 6 Years | 32 (100.0%) | 0 (0.0%) |
| 6 to 18 Years | 198 (89.6%) | 23 (10.4%) |
| 19 to 25 Years | 51 (87.9%) | 7 (12.1%) |
| 26 to 34 Years | 42 (95.5%) | 2 (4.5%) |
| 35 to 44 Years | 33 (100.0%) | 0 (0.0%) |
| 45 to 54 Years | 56 (71.8%) | 22 (28.2%) |
| 55 to 64 Years | 101 (83.5%) | 20 (16.5%) |
| 65 to 74 Years | 109 (100.0%) | 0 (0.0%) |
| 75 Years and older | 39 (100.0%) | 0 (0.0%) |
| Total | 661 (89.9%) | 74 (10.1%) |
Health Insurance Coverage by Citizenship Status in Silver Cliff
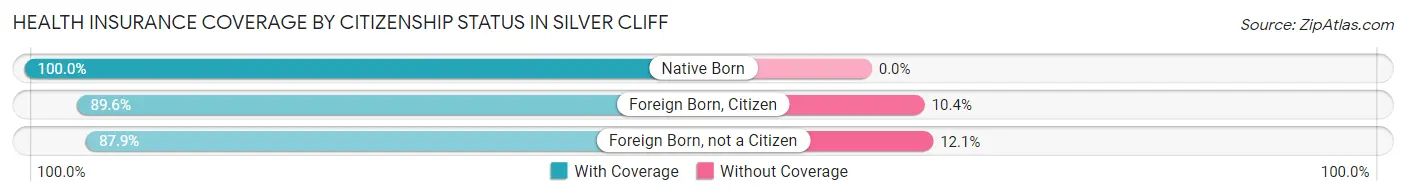
| Citizenship Status | With Coverage | Without Coverage |
| Native Born | 32 (100.0%) | 0 (0.0%) |
| Foreign Born, Citizen | 198 (89.6%) | 23 (10.4%) |
| Foreign Born, not a Citizen | 51 (87.9%) | 7 (12.1%) |
Health Insurance Coverage by Household Income in Silver Cliff
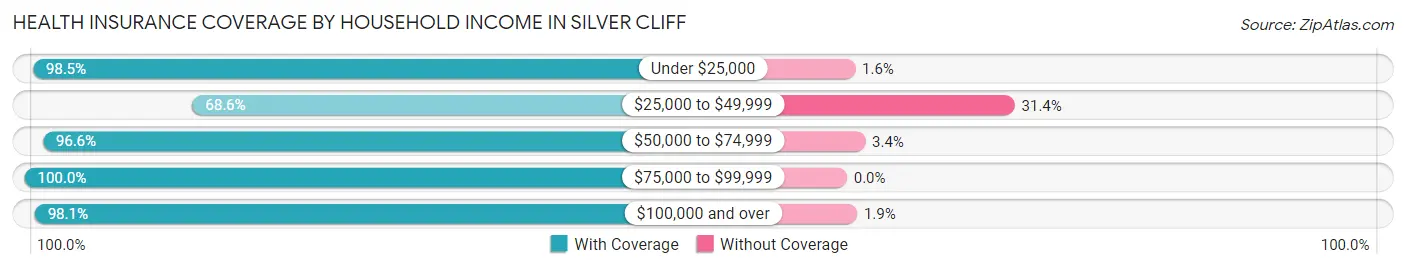
| Household Income | With Coverage | Without Coverage |
| Under $25,000 | 127 (98.5%) | 2 (1.5%) |
| $25,000 to $49,999 | 133 (68.6%) | 61 (31.4%) |
| $50,000 to $74,999 | 225 (96.6%) | 8 (3.4%) |
| $75,000 to $99,999 | 22 (100.0%) | 0 (0.0%) |
| $100,000 and over | 154 (98.1%) | 3 (1.9%) |
Public vs Private Health Insurance Coverage by Age in Silver Cliff
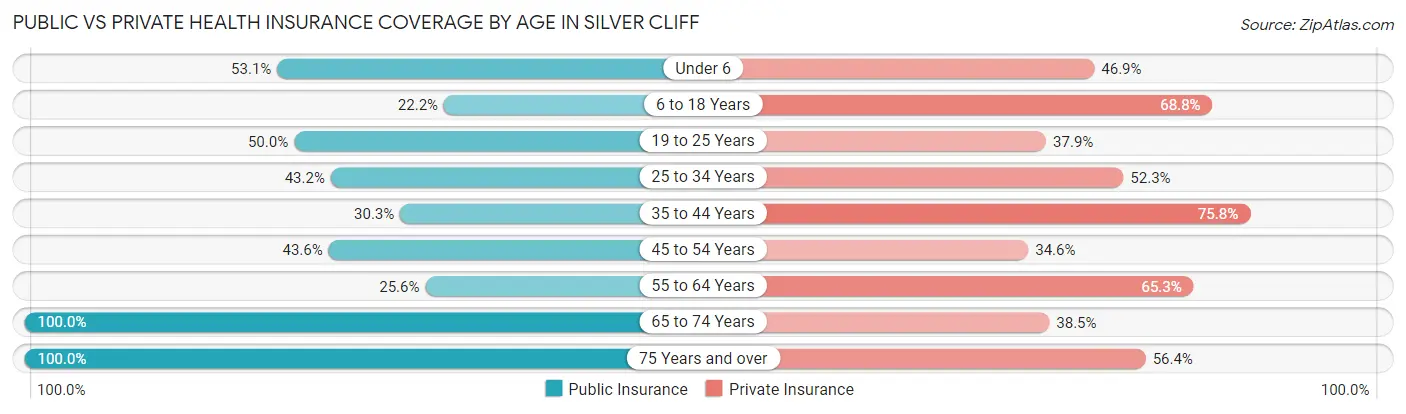
| Age Bracket | Public Insurance | Private Insurance |
| Under 6 | 17 (53.1%) | 15 (46.9%) |
| 6 to 18 Years | 49 (22.2%) | 152 (68.8%) |
| 19 to 25 Years | 29 (50.0%) | 22 (37.9%) |
| 25 to 34 Years | 19 (43.2%) | 23 (52.3%) |
| 35 to 44 Years | 10 (30.3%) | 25 (75.8%) |
| 45 to 54 Years | 34 (43.6%) | 27 (34.6%) |
| 55 to 64 Years | 31 (25.6%) | 79 (65.3%) |
| 65 to 74 Years | 109 (100.0%) | 42 (38.5%) |
| 75 Years and over | 39 (100.0%) | 22 (56.4%) |
| Total | 337 (45.9%) | 407 (55.4%) |
Disability Status by Sex by Age in Silver Cliff
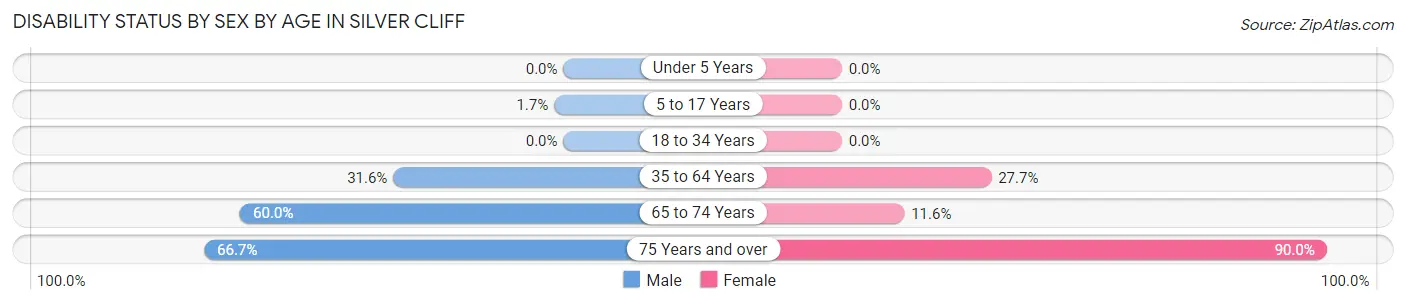
| Age Bracket | Male | Female |
| Under 5 Years | 0 (0.0%) | 0 (0.0%) |
| 5 to 17 Years | 3 (1.7%) | 0 (0.0%) |
| 18 to 34 Years | 0 (0.0%) | 0 (0.0%) |
| 35 to 64 Years | 30 (31.6%) | 38 (27.7%) |
| 65 to 74 Years | 24 (60.0%) | 8 (11.6%) |
| 75 Years and over | 6 (66.7%) | 27 (90.0%) |
Disability Class by Sex by Age in Silver Cliff
Disability Class: Hearing Difficulty
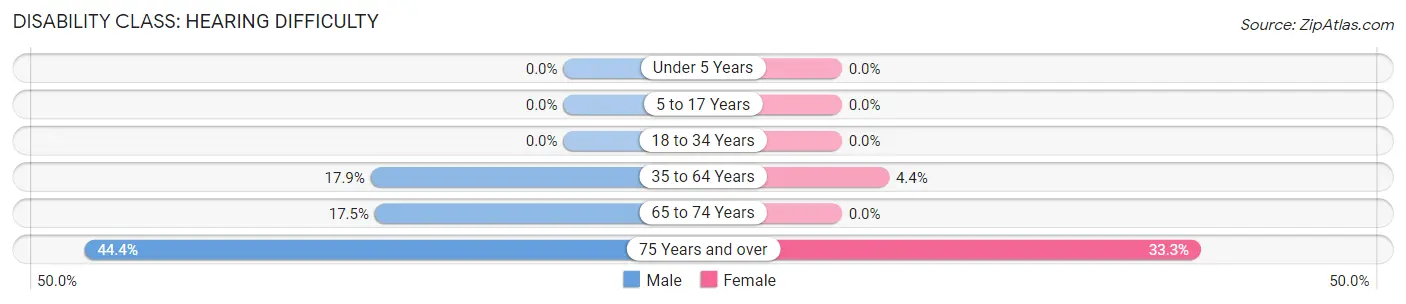
| Age Bracket | Male | Female |
| Under 5 Years | 0 (0.0%) | 0 (0.0%) |
| 5 to 17 Years | 0 (0.0%) | 0 (0.0%) |
| 18 to 34 Years | 0 (0.0%) | 0 (0.0%) |
| 35 to 64 Years | 17 (17.9%) | 6 (4.4%) |
| 65 to 74 Years | 7 (17.5%) | 0 (0.0%) |
| 75 Years and over | 4 (44.4%) | 10 (33.3%) |
Disability Class: Vision Difficulty
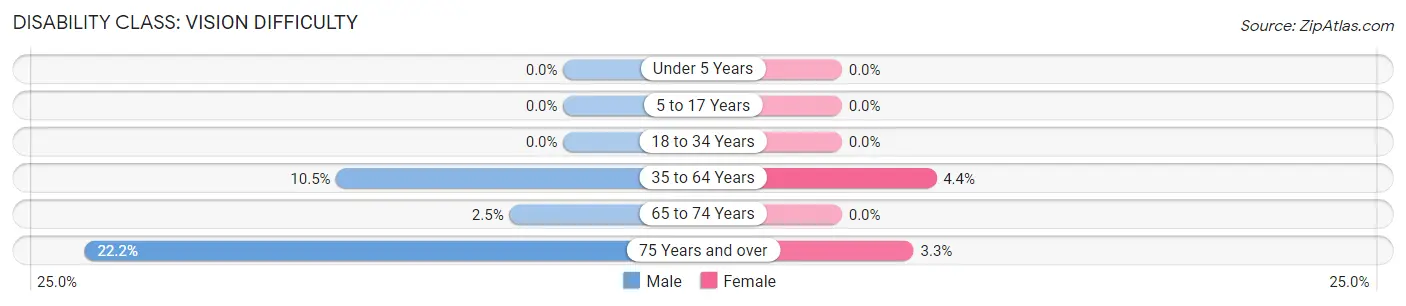
| Age Bracket | Male | Female |
| Under 5 Years | 0 (0.0%) | 0 (0.0%) |
| 5 to 17 Years | 0 (0.0%) | 0 (0.0%) |
| 18 to 34 Years | 0 (0.0%) | 0 (0.0%) |
| 35 to 64 Years | 10 (10.5%) | 6 (4.4%) |
| 65 to 74 Years | 1 (2.5%) | 0 (0.0%) |
| 75 Years and over | 2 (22.2%) | 1 (3.3%) |
Disability Class: Cognitive Difficulty
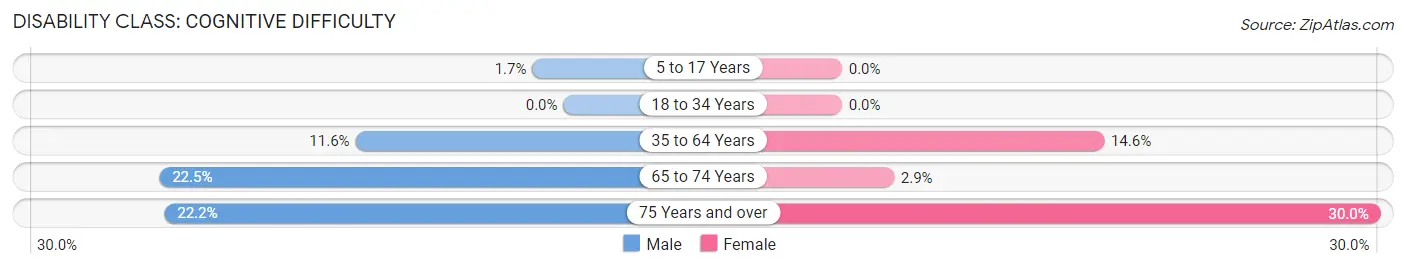
| Age Bracket | Male | Female |
| 5 to 17 Years | 3 (1.7%) | 0 (0.0%) |
| 18 to 34 Years | 0 (0.0%) | 0 (0.0%) |
| 35 to 64 Years | 11 (11.6%) | 20 (14.6%) |
| 65 to 74 Years | 9 (22.5%) | 2 (2.9%) |
| 75 Years and over | 2 (22.2%) | 9 (30.0%) |
Disability Class: Ambulatory Difficulty
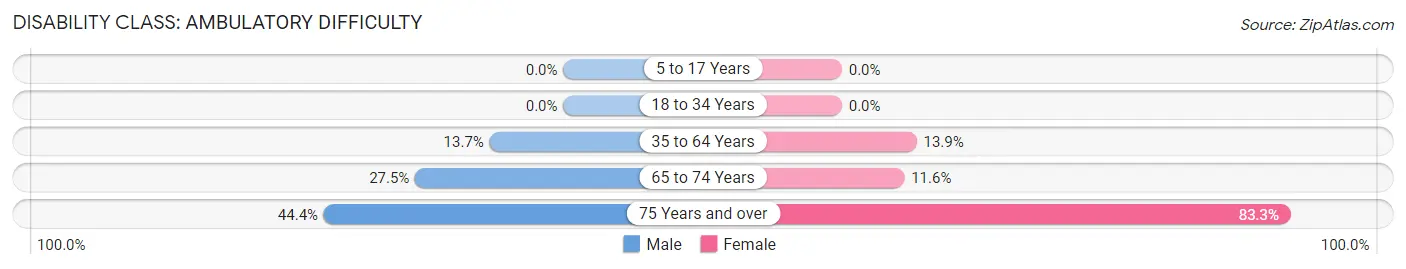
| Age Bracket | Male | Female |
| 5 to 17 Years | 0 (0.0%) | 0 (0.0%) |
| 18 to 34 Years | 0 (0.0%) | 0 (0.0%) |
| 35 to 64 Years | 13 (13.7%) | 19 (13.9%) |
| 65 to 74 Years | 11 (27.5%) | 8 (11.6%) |
| 75 Years and over | 4 (44.4%) | 25 (83.3%) |
Disability Class: Self-Care Difficulty
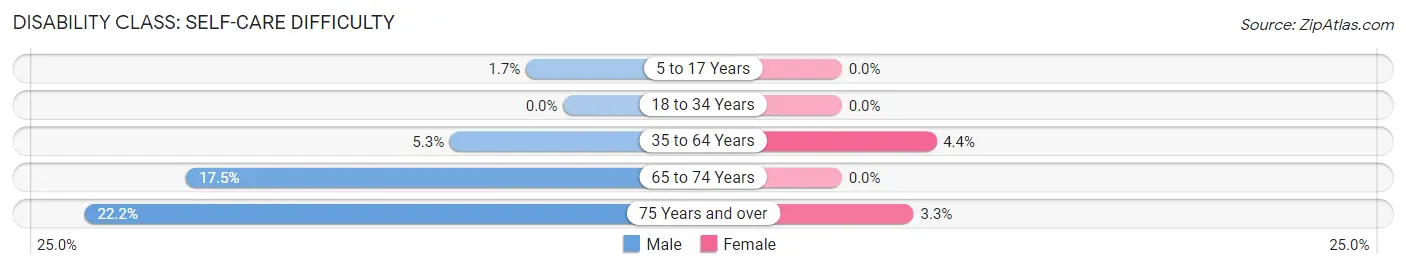
| Age Bracket | Male | Female |
| 5 to 17 Years | 3 (1.7%) | 0 (0.0%) |
| 18 to 34 Years | 0 (0.0%) | 0 (0.0%) |
| 35 to 64 Years | 5 (5.3%) | 6 (4.4%) |
| 65 to 74 Years | 7 (17.5%) | 0 (0.0%) |
| 75 Years and over | 2 (22.2%) | 1 (3.3%) |
Technology Access in Silver Cliff
Computing Device Access in Silver Cliff
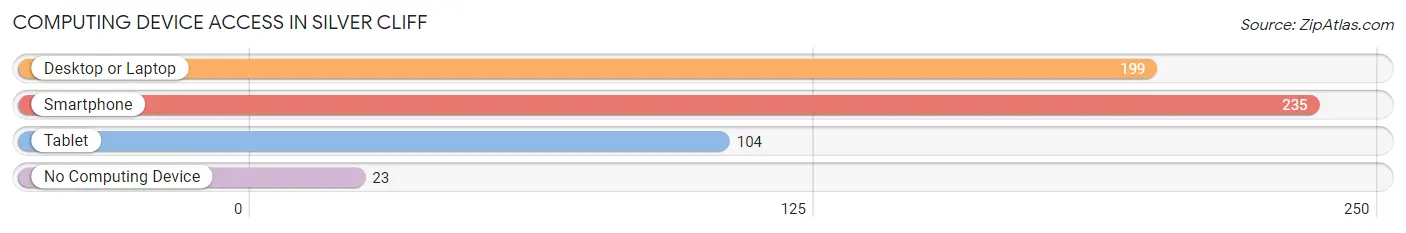
| Device Type | # Households | % Households |
| Desktop or Laptop | 199 | 74.0% |
| Smartphone | 235 | 87.4% |
| Tablet | 104 | 38.7% |
| No Computing Device | 23 | 8.6% |
| Total | 269 | 100.0% |
Internet Access in Silver Cliff
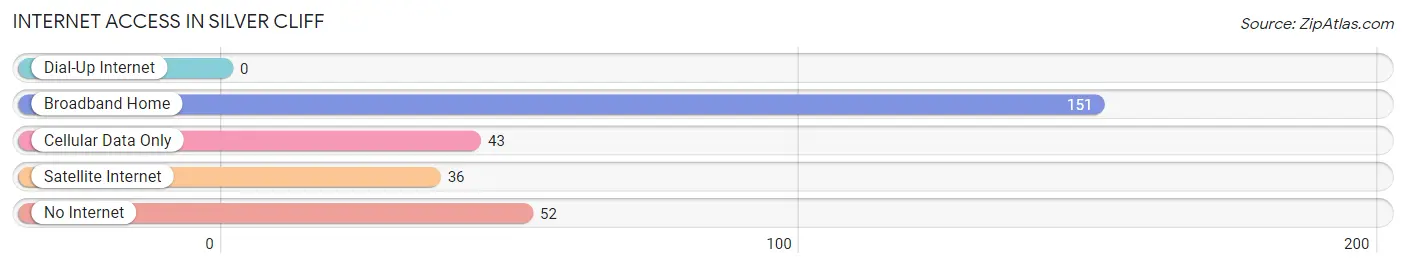
| Internet Type | # Households | % Households |
| Dial-Up Internet | 0 | 0.0% |
| Broadband Home | 151 | 56.1% |
| Cellular Data Only | 43 | 16.0% |
| Satellite Internet | 36 | 13.4% |
| No Internet | 52 | 19.3% |
| Total | 269 | 100.0% |
Silver Cliff Summary
History
Silver Cliff is a small town located in Custer County, Colorado. It was founded in 1878 by prospectors who were searching for silver in the area. The town was named after the silver deposits that were found in the nearby hills. The town quickly grew and by 1880, it had a population of over 1,000 people.
The town was an important center for the mining industry in the late 19th century. It was home to several large mines, including the Silver Cliff Mine, which was the largest silver mine in the state. The town also had several smelters and mills that processed the ore from the mines.
In the early 20th century, the mining industry began to decline and the population of Silver Cliff began to decrease. By the 1950s, the population had dropped to just over 500 people.
Geography
Silver Cliff is located in the Wet Mountain Valley in south-central Colorado. It is situated at an elevation of 8,000 feet and is surrounded by the Sangre de Cristo Mountains. The town is located about 25 miles south of the city of Pueblo and about 50 miles west of Colorado Springs.
The town is located in a semi-arid climate, with hot summers and cold winters. The average annual precipitation is about 16 inches, with most of it falling in the form of snow.
Economy
The economy of Silver Cliff is largely based on tourism. The town is a popular destination for outdoor activities such as hiking, camping, fishing, and hunting. The nearby Sangre de Cristo Mountains offer a variety of trails for hikers and mountain bikers.
The town is also home to several small businesses, including restaurants, shops, and galleries. The town also has a small airport, which is used for private planes and helicopters.
Demographics
As of the 2010 census, the population of Silver Cliff was 590. The racial makeup of the town was 95.3% White, 0.2% African American, 0.3% Native American, 0.2% Asian, 0.2% Pacific Islander, 0.7% from other races, and 2.3% from two or more races. Hispanic or Latino of any race were 4.2% of the population.
The median household income in Silver Cliff was $37,500, and the median family income was $41,250. The per capita income for the town was $17,857. About 11.2% of families and 14.2% of the population were below the poverty line, including 18.2% of those under age 18 and 8.3% of those age 65 or over.
Common Questions
What is the Total Population of Silver Cliff?
Total Population of Silver Cliff is 735.
What is the Total Male Population of Silver Cliff?
Total Male Population of Silver Cliff is 413.
What is the Total Female Population of Silver Cliff?
Total Female Population of Silver Cliff is 322.
What is the Ratio of Males per 100 Females in Silver Cliff?
There are 128.26 Males per 100 Females in Silver Cliff.
What is the Ratio of Females per 100 Males in Silver Cliff?
There are 77.97 Females per 100 Males in Silver Cliff.
What is the Median Population Age in Silver Cliff?
Median Population Age in Silver Cliff is 38.9 Years.
What is the Average Family Size in Silver Cliff
Average Family Size in Silver Cliff is 4.2 People.
What is the Average Household Size in Silver Cliff
Average Household Size in Silver Cliff is 2.7 People.
What is Per Capita Income in Silver Cliff?
Per Capita income in Silver Cliff is $16,907.
What is the Median Family Income in Silver Cliff?
Median Family Income in Silver Cliff is $50,536.
What is the Median Household income in Silver Cliff?
Median Household Income in Silver Cliff is $35,583.
What is Income or Wage Gap in Silver Cliff?
Income or Wage Gap in Silver Cliff is 34.1%.
Women in Silver Cliff earn 65.9 cents for every dollar earned by a man.
What is Inequality or Gini Index in Silver Cliff?
Inequality or Gini Index in Silver Cliff is 0.40.
How Large is the Labor Force in Silver Cliff?
There are 231 People in the Labor Forcein in Silver Cliff.
What is the Percentage of People in the Labor Force in Silver Cliff?
45.2% of People are in the Labor Force in Silver Cliff.
What is the Unemployment Rate in Silver Cliff?
Unemployment Rate in Silver Cliff is 3.5%.