Cities with the Highest Unemployment Rate Amomg Seniors Over the Age of 65 in Colorado
RELATED REPORTS & OPTIONS
Highest Unemployment | Senior > 65
Colorado
Compare Cities
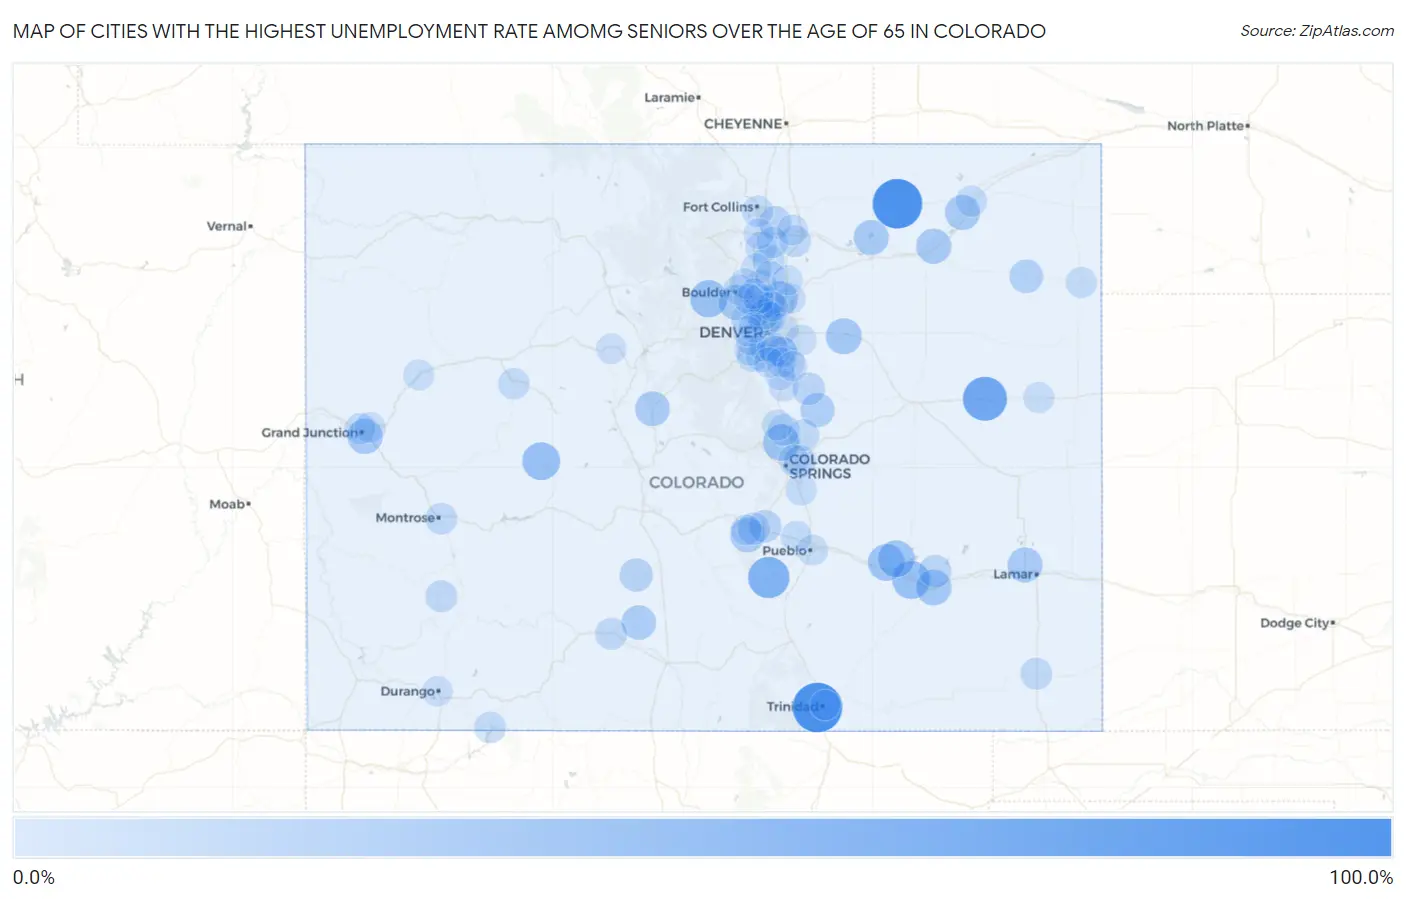
Map of Cities with the Highest Unemployment Rate Amomg Seniors Over the Age of 65 in Colorado
0.0%
100.0%
Cities with the Highest Unemployment Rate Amomg Seniors Over the Age of 65 in Colorado
| City | Senior Unemployment | vs State | vs National | |
| 1. | Jansen | 100.0% | 3.4%(+96.6)#1 | 3.9%(+96.1)#47 |
| 2. | Raymer New Raymer | 100.0% | 3.4%(+96.6)#2 | 3.9%(+96.1)#64 |
| 3. | Matheson | 100.0% | 3.4%(+96.6)#3 | 3.9%(+96.1)#76 |
| 4. | Flagler | 71.3% | 3.4%(+67.9)#4 | 3.9%(+67.4)#167 |
| 5. | Beulah Valley | 57.0% | 3.4%(+53.6)#5 | 3.9%(+53.1)#238 |
| 6. | Rocky Ford | 39.7% | 3.4%(+36.3)#6 | 3.9%(+35.8)#434 |
| 7. | Crested Butte | 39.0% | 3.4%(+35.6)#7 | 3.9%(+35.1)#442 |
| 8. | Nederland | 35.1% | 3.4%(+31.7)#8 | 3.9%(+31.2)#510 |
| 9. | Olney Springs | 33.3% | 3.4%(+29.9)#9 | 3.9%(+29.4)#563 |
| 10. | Crowley | 33.3% | 3.4%(+29.9)#10 | 3.9%(+29.4)#575 |
| 11. | Air Force Academy | 31.8% | 3.4%(+28.4)#11 | 3.9%(+27.9)#619 |
| 12. | Strasburg | 28.8% | 3.4%(+25.4)#12 | 3.9%(+24.9)#715 |
| 13. | North La Junta | 28.0% | 3.4%(+24.6)#13 | 3.9%(+24.1)#759 |
| 14. | Orchard Mesa | 27.2% | 3.4%(+23.8)#14 | 3.9%(+23.3)#785 |
| 15. | Todd Creek | 26.1% | 3.4%(+22.7)#15 | 3.9%(+22.2)#818 |
| 16. | Eldorado Springs | 25.7% | 3.4%(+22.3)#16 | 3.9%(+21.8)#835 |
| 17. | Hillrose | 25.0% | 3.4%(+21.6)#17 | 3.9%(+21.1)#876 |
| 18. | Atwood | 25.0% | 3.4%(+21.6)#18 | 3.9%(+21.1)#879 |
| 19. | Wiley | 24.9% | 3.4%(+21.5)#19 | 3.9%(+21.0)#893 |
| 20. | Jackson Lake | 24.9% | 3.4%(+21.5)#20 | 3.9%(+21.0)#900 |
| 21. | Sherrelwood | 23.1% | 3.4%(+19.7)#21 | 3.9%(+19.2)#963 |
| 22. | Fairplay | 23.0% | 3.4%(+19.6)#22 | 3.9%(+19.1)#980 |
| 23. | Rockvale | 23.0% | 3.4%(+19.6)#23 | 3.9%(+19.1)#981 |
| 24. | Center | 21.7% | 3.4%(+18.3)#24 | 3.9%(+17.8)#1,056 |
| 25. | Elbert | 20.0% | 3.4%(+16.6)#25 | 3.9%(+16.1)#1,160 |
| 26. | Yuma | 18.0% | 3.4%(+14.6)#26 | 3.9%(+14.1)#1,340 |
| 27. | Saguache | 15.7% | 3.4%(+12.3)#27 | 3.9%(+11.8)#1,607 |
| 28. | Penrose | 13.3% | 3.4%(+9.90)#28 | 3.9%(+9.40)#1,892 |
| 29. | Windsor | 13.1% | 3.4%(+9.70)#29 | 3.9%(+9.20)#1,921 |
| 30. | Elizabeth | 12.8% | 3.4%(+9.40)#30 | 3.9%(+8.90)#1,975 |
| 31. | Cheraw | 12.4% | 3.4%(+9.00)#31 | 3.9%(+8.50)#2,069 |
| 32. | Florence | 10.6% | 3.4%(+7.20)#32 | 3.9%(+6.70)#2,397 |
| 33. | Northglenn | 10.4% | 3.4%(+7.00)#33 | 3.9%(+6.50)#2,429 |
| 34. | Cimarron Hills | 10.3% | 3.4%(+6.90)#34 | 3.9%(+6.40)#2,451 |
| 35. | Mountain Village | 9.5% | 3.4%(+6.10)#35 | 3.9%(+5.60)#2,691 |
| 36. | Del Norte | 9.2% | 3.4%(+5.80)#36 | 3.9%(+5.30)#2,797 |
| 37. | Springfield | 8.8% | 3.4%(+5.40)#37 | 3.9%(+4.90)#2,933 |
| 38. | Evans | 8.4% | 3.4%(+5.00)#38 | 3.9%(+4.50)#3,039 |
| 39. | Montrose | 8.1% | 3.4%(+4.70)#39 | 3.9%(+4.20)#3,155 |
| 40. | Berthoud | 7.7% | 3.4%(+4.30)#40 | 3.9%(+3.80)#3,309 |
| 41. | Monument | 7.5% | 3.4%(+4.10)#41 | 3.9%(+3.60)#3,380 |
| 42. | Mead | 7.4% | 3.4%(+4.00)#42 | 3.9%(+3.50)#3,422 |
| 43. | Fort Collins | 7.1% | 3.4%(+3.70)#43 | 3.9%(+3.20)#3,512 |
| 44. | Arboles | 7.1% | 3.4%(+3.70)#44 | 3.9%(+3.20)#3,557 |
| 45. | Welby | 6.9% | 3.4%(+3.50)#45 | 3.9%(+3.00)#3,606 |
| 46. | Ken Caryl | 6.8% | 3.4%(+3.40)#46 | 3.9%(+2.90)#3,650 |
| 47. | Black Forest | 6.8% | 3.4%(+3.40)#47 | 3.9%(+2.90)#3,660 |
| 48. | Carbondale | 6.8% | 3.4%(+3.40)#48 | 3.9%(+2.90)#3,666 |
| 49. | Grand Junction | 6.5% | 3.4%(+3.10)#49 | 3.9%(+2.60)#3,796 |
| 50. | Johnstown | 6.5% | 3.4%(+3.10)#50 | 3.9%(+2.60)#3,808 |
| 51. | Stonegate | 6.2% | 3.4%(+2.80)#51 | 3.9%(+2.30)#3,968 |
| 52. | Erie | 5.9% | 3.4%(+2.50)#52 | 3.9%(+2.00)#4,128 |
| 53. | Wray | 5.9% | 3.4%(+2.50)#53 | 3.9%(+2.00)#4,157 |
| 54. | Sterling | 5.5% | 3.4%(+2.10)#54 | 3.9%(+1.60)#4,338 |
| 55. | Fountain | 5.4% | 3.4%(+2.00)#55 | 3.9%(+1.50)#4,387 |
| 56. | Littleton | 5.3% | 3.4%(+1.90)#56 | 3.9%(+1.40)#4,439 |
| 57. | Pueblo West | 5.3% | 3.4%(+1.90)#57 | 3.9%(+1.40)#4,446 |
| 58. | Park Center | 5.3% | 3.4%(+1.90)#58 | 3.9%(+1.40)#4,481 |
| 59. | Dakota Ridge | 5.1% | 3.4%(+1.70)#59 | 3.9%(+1.20)#4,572 |
| 60. | Westminster | 5.0% | 3.4%(+1.60)#60 | 3.9%(+1.10)#4,630 |
| 61. | Pueblo | 4.7% | 3.4%(+1.30)#61 | 3.9%(+0.800)#4,805 |
| 62. | Longmont | 4.5% | 3.4%(+1.10)#62 | 3.9%(+0.600)#4,958 |
| 63. | Palmer Lake | 4.4% | 3.4%(+1.00)#63 | 3.9%(+0.500)#5,101 |
| 64. | Denver | 4.3% | 3.4%(+0.900)#64 | 3.9%(+0.400)#5,111 |
| 65. | Lakewood | 4.3% | 3.4%(+0.900)#65 | 3.9%(+0.400)#5,114 |
| 66. | Greeley | 4.2% | 3.4%(+0.800)#66 | 3.9%(+0.300)#5,187 |
| 67. | Fruitvale | 4.2% | 3.4%(+0.800)#67 | 3.9%(+0.300)#5,223 |
| 68. | Brighton | 4.1% | 3.4%(+0.700)#68 | 3.9%(+0.200)#5,274 |
| 69. | Parachute | 4.1% | 3.4%(+0.700)#69 | 3.9%(+0.200)#5,319 |
| 70. | Stratton | 4.1% | 3.4%(+0.700)#70 | 3.9%(+0.200)#5,326 |
| 71. | Boulder | 3.8% | 3.4%(+0.400)#71 | 3.9%(-0.100)#5,505 |
| 72. | Federal Heights | 3.8% | 3.4%(+0.400)#72 | 3.9%(-0.100)#5,540 |
| 73. | Aurora | 3.7% | 3.4%(+0.300)#73 | 3.9%(-0.200)#5,578 |
| 74. | Williamsburg | 3.5% | 3.4%(+0.100)#74 | 3.9%(-0.400)#5,783 |
| 75. | Colorado Springs | 3.3% | 3.4%(-0.100)#75 | 3.9%(-0.600)#5,864 |
| 76. | Cherry Creek | 3.3% | 3.4%(-0.100)#76 | 3.9%(-0.600)#5,909 |
| 77. | Arvada | 3.2% | 3.4%(-0.200)#77 | 3.9%(-0.700)#5,949 |
| 78. | Gunbarrel | 3.1% | 3.4%(-0.300)#78 | 3.9%(-0.800)#6,079 |
| 79. | Sheridan | 2.8% | 3.4%(-0.600)#79 | 3.9%(-1.10)#6,333 |
| 80. | Loveland | 2.7% | 3.4%(-0.700)#80 | 3.9%(-1.20)#6,362 |
| 81. | Lafayette | 2.7% | 3.4%(-0.700)#81 | 3.9%(-1.20)#6,380 |
| 82. | Thornton | 2.5% | 3.4%(-0.900)#82 | 3.9%(-1.40)#6,492 |
| 83. | Canon City | 2.5% | 3.4%(-0.900)#83 | 3.9%(-1.40)#6,530 |
| 84. | Castle Rock | 2.4% | 3.4%(-1.00)#84 | 3.9%(-1.50)#6,580 |
| 85. | Broomfield | 2.4% | 3.4%(-1.00)#85 | 3.9%(-1.50)#6,581 |
| 86. | Frederick | 2.4% | 3.4%(-1.00)#86 | 3.9%(-1.50)#6,622 |
| 87. | Centennial | 2.3% | 3.4%(-1.10)#87 | 3.9%(-1.60)#6,655 |
| 88. | Fort Lupton | 2.2% | 3.4%(-1.20)#88 | 3.9%(-1.70)#6,771 |
| 89. | Vail | 2.2% | 3.4%(-1.20)#89 | 3.9%(-1.70)#6,778 |
| 90. | Durango | 2.0% | 3.4%(-1.40)#90 | 3.9%(-1.90)#6,887 |
| 91. | Castle Pines | 1.9% | 3.4%(-1.50)#91 | 3.9%(-2.00)#6,950 |
| 92. | Trinidad | 1.9% | 3.4%(-1.50)#92 | 3.9%(-2.00)#6,961 |
| 93. | Louisville | 1.8% | 3.4%(-1.60)#93 | 3.9%(-2.10)#7,005 |
| 94. | Greenwood Village | 1.8% | 3.4%(-1.60)#94 | 3.9%(-2.10)#7,011 |
| 95. | Cherry Hills Village | 1.6% | 3.4%(-1.80)#95 | 3.9%(-2.30)#7,153 |
| 96. | Applewood | 1.4% | 3.4%(-2.00)#96 | 3.9%(-2.50)#7,253 |
| 97. | Highlands Ranch | 1.3% | 3.4%(-2.10)#97 | 3.9%(-2.60)#7,262 |
| 98. | Lone Tree | 1.2% | 3.4%(-2.20)#98 | 3.9%(-2.70)#7,350 |
| 99. | Parker | 0.70% | 3.4%(-2.70)#99 | 3.9%(-3.20)#7,522 |
| 100. | Wheat Ridge | 0.60% | 3.4%(-2.80)#100 | 3.9%(-3.30)#7,554 |
Common Questions
What are the Top 10 Cities with the Highest Unemployment Rate Amomg Seniors Over the Age of 65 in Colorado?
Top 10 Cities with the Highest Unemployment Rate Amomg Seniors Over the Age of 65 in Colorado are:
#1
100.0%
#2
100.0%
#3
71.3%
#4
57.0%
#5
39.7%
#6
39.0%
#7
35.1%
#8
33.3%
#9
33.3%
#10
31.8%
What city has the Highest Unemployment Rate Amomg Seniors Over the Age of 65 in Colorado?
Jansen has the Highest Unemployment Rate Amomg Seniors Over the Age of 65 in Colorado with 100.0%.
What is the Unemployment Rate Amomg Seniors Over the Age of 65 in the State of Colorado?
Unemployment Rate Amomg Seniors Over the Age of 65 in Colorado is 3.4%.
What is the Unemployment Rate Amomg Seniors Over the Age of 65 in the United States?
Unemployment Rate Amomg Seniors Over the Age of 65 in the United States is 3.9%.