Frisco, CO
Frisco Map
Frisco Overview
2,900
TOTAL POPULATION
1,402
MALE POPULATION
1,498
FEMALE POPULATION
93.59
MALES / 100 FEMALES
106.85
FEMALES / 100 MALES
43.8
MEDIAN AGE
2.8
AVG FAMILY SIZE
2.2
AVG HOUSEHOLD SIZE
$58,760
PER CAPITA INCOME
$121,797
AVG FAMILY INCOME
$101,140
AVG HOUSEHOLD INCOME
14.4%
WAGE / INCOME GAP [ % ]
85.6¢/ $1
WAGE / INCOME GAP [ $ ]
0.43
INEQUALITY / GINI INDEX
1,929
LABOR FORCE [ PEOPLE ]
74.0%
PERCENT IN LABOR FORCE
1.5%
UNEMPLOYMENT RATE
Frisco Zip Codes
Frisco Area Codes
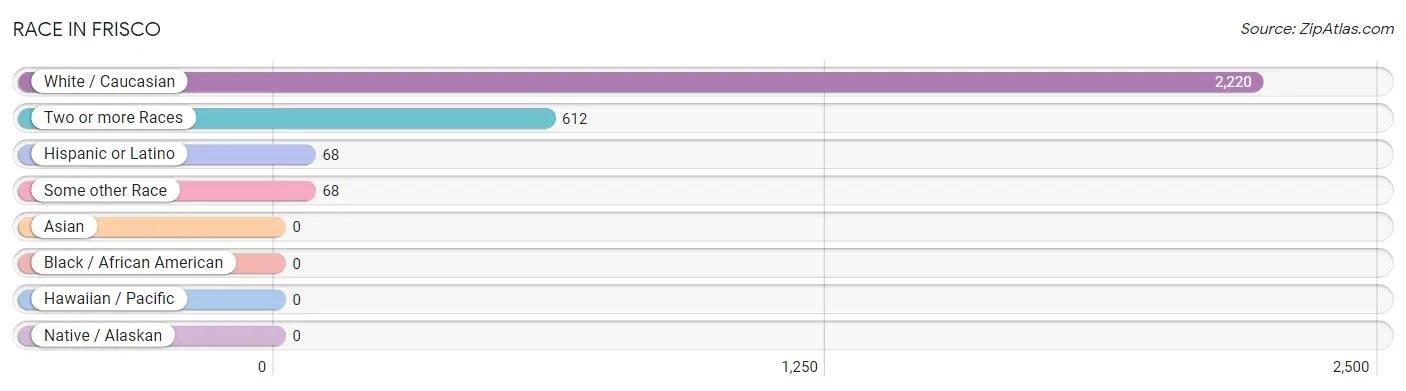
Race in Frisco
The most populous races in Frisco are White / Caucasian (2,220 | 76.5%), Two or more Races (612 | 21.1%), and Hispanic or Latino (68 | 2.3%).
| Race | # Population | % Population |
| Asian | 0 | 0.0% |
| Black / African American | 0 | 0.0% |
| Hawaiian / Pacific | 0 | 0.0% |
| Hispanic or Latino | 68 | 2.3% |
| Native / Alaskan | 0 | 0.0% |
| White / Caucasian | 2,220 | 76.5% |
| Two or more Races | 612 | 21.1% |
| Some other Race | 68 | 2.3% |
| Total | 2,900 | 100.0% |
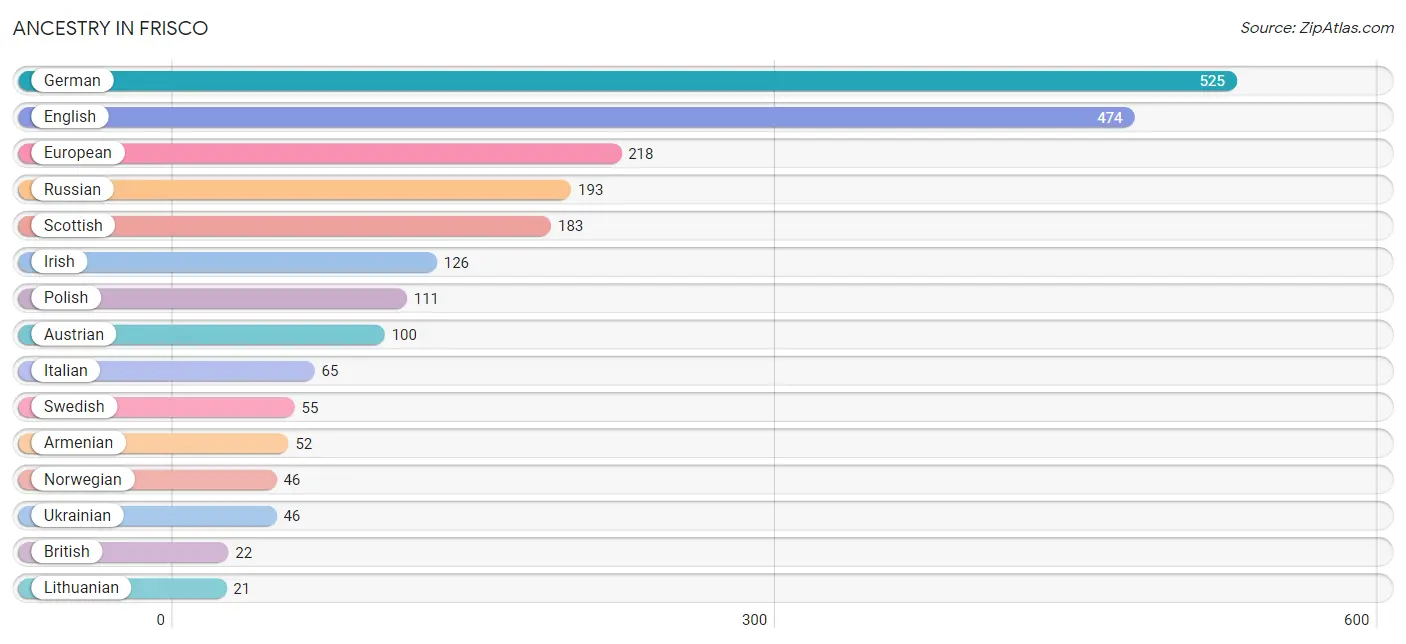
Ancestry in Frisco
The most populous ancestries reported in Frisco are German (525 | 18.1%), English (474 | 16.3%), European (218 | 7.5%), Russian (193 | 6.7%), and Scottish (183 | 6.3%), together accounting for 54.9% of all Frisco residents.
| Ancestry | # Population | % Population |
| Armenian | 52 | 1.8% |
| Austrian | 100 | 3.5% |
| British | 22 | 0.8% |
| English | 474 | 16.3% |
| European | 218 | 7.5% |
| German | 525 | 18.1% |
| Irish | 126 | 4.3% |
| Italian | 65 | 2.2% |
| Lithuanian | 21 | 0.7% |
| Norwegian | 46 | 1.6% |
| Polish | 111 | 3.8% |
| Russian | 193 | 6.7% |
| Scottish | 183 | 6.3% |
| Swedish | 55 | 1.9% |
| Ukrainian | 46 | 1.6% | View All 15 Rows |
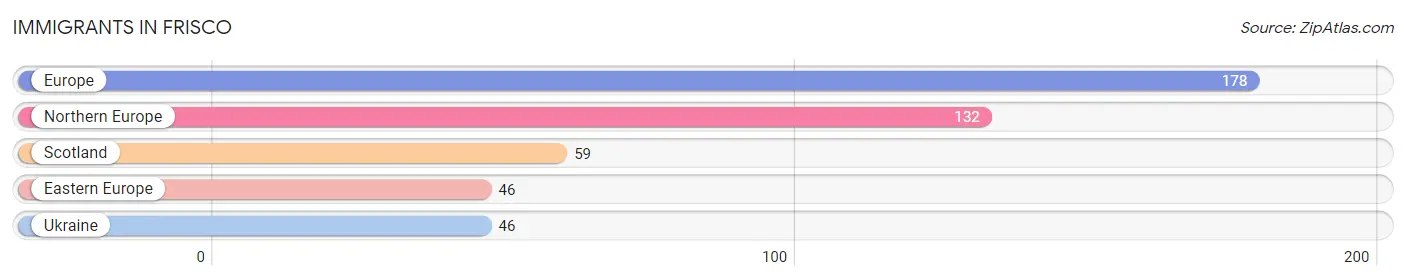
Immigrants in Frisco
The most numerous immigrant groups reported in Frisco came from Europe (178 | 6.1%), Northern Europe (132 | 4.5%), Scotland (59 | 2.0%), Eastern Europe (46 | 1.6%), and Ukraine (46 | 1.6%), together accounting for 15.9% of all Frisco residents.
| Immigration Origin | # Population | % Population |
| Eastern Europe | 46 | 1.6% |
| Europe | 178 | 6.1% |
| Northern Europe | 132 | 4.5% |
| Scotland | 59 | 2.0% |
| Ukraine | 46 | 1.6% | View All 5 Rows |
Sex and Age in Frisco
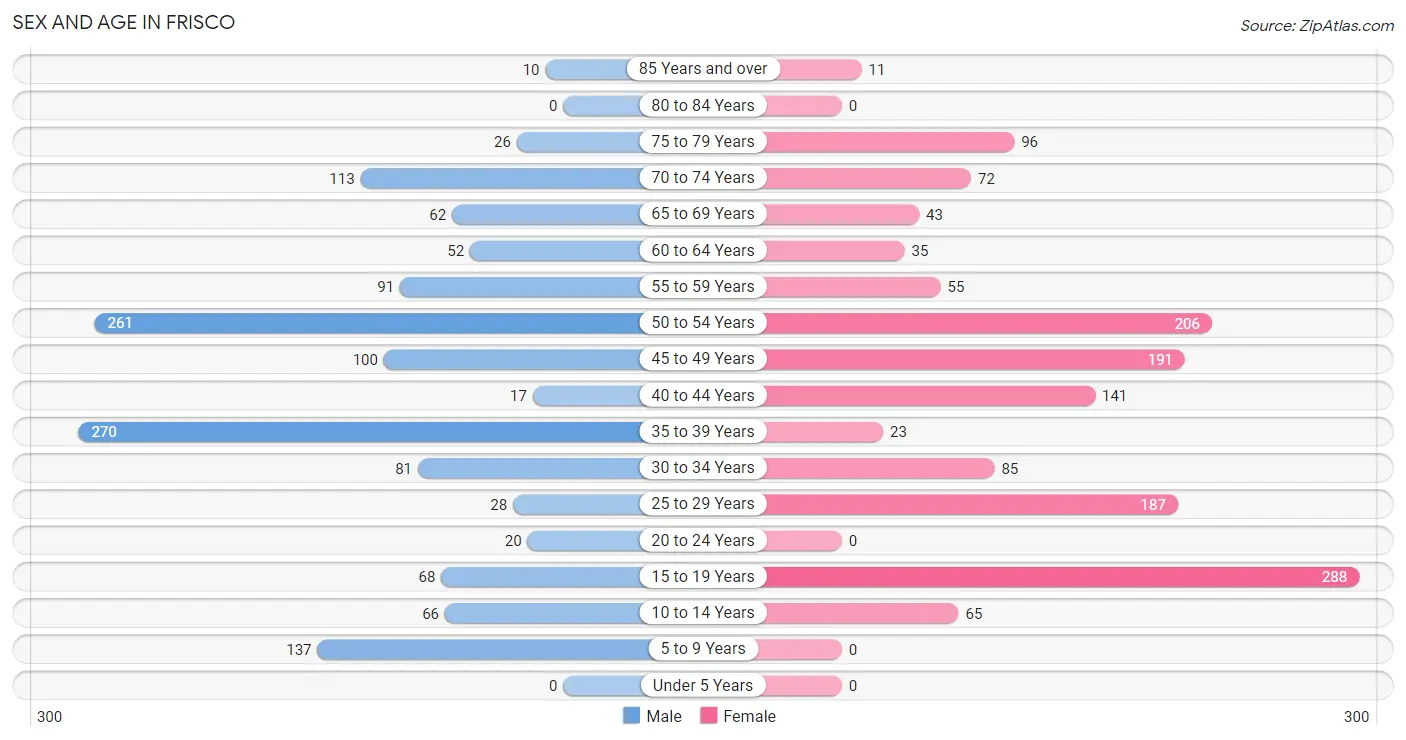
Sex and Age in Frisco
The most populous age groups in Frisco are 35 to 39 Years (270 | 19.3%) for men and 15 to 19 Years (288 | 19.2%) for women.
| Age Bracket | Male | Female |
| Under 5 Years | 0 (0.0%) | 0 (0.0%) |
| 5 to 9 Years | 137 (9.8%) | 0 (0.0%) |
| 10 to 14 Years | 66 (4.7%) | 65 (4.3%) |
| 15 to 19 Years | 68 (4.9%) | 288 (19.2%) |
| 20 to 24 Years | 20 (1.4%) | 0 (0.0%) |
| 25 to 29 Years | 28 (2.0%) | 187 (12.5%) |
| 30 to 34 Years | 81 (5.8%) | 85 (5.7%) |
| 35 to 39 Years | 270 (19.3%) | 23 (1.5%) |
| 40 to 44 Years | 17 (1.2%) | 141 (9.4%) |
| 45 to 49 Years | 100 (7.1%) | 191 (12.8%) |
| 50 to 54 Years | 261 (18.6%) | 206 (13.8%) |
| 55 to 59 Years | 91 (6.5%) | 55 (3.7%) |
| 60 to 64 Years | 52 (3.7%) | 35 (2.3%) |
| 65 to 69 Years | 62 (4.4%) | 43 (2.9%) |
| 70 to 74 Years | 113 (8.1%) | 72 (4.8%) |
| 75 to 79 Years | 26 (1.8%) | 96 (6.4%) |
| 80 to 84 Years | 0 (0.0%) | 0 (0.0%) |
| 85 Years and over | 10 (0.7%) | 11 (0.7%) |
| Total | 1,402 (100.0%) | 1,498 (100.0%) |
Families and Households in Frisco
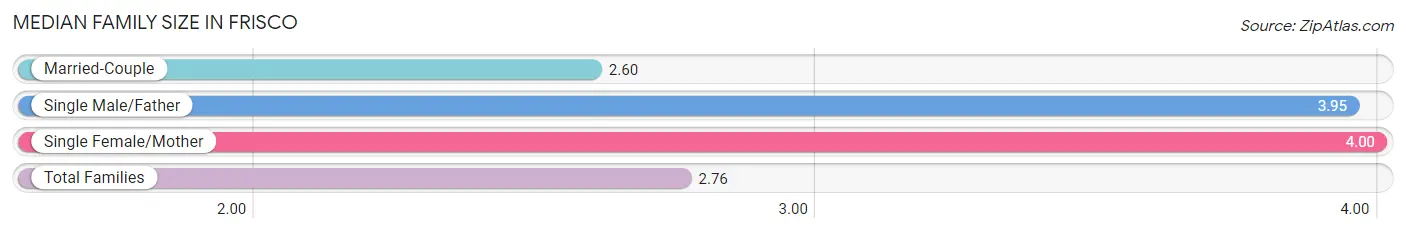
Median Family Size in Frisco
The median family size in Frisco is 2.76 persons per family, with single female/mother families (32 | 4.2%) accounting for the largest median family size of 4 persons per family. On the other hand, married-couple families (669 | 88.3%) represent the smallest median family size with 2.60 persons per family.
| Family Type | # Families | Family Size |
| Married-Couple | 669 (88.3%) | 2.60 |
| Single Male/Father | 57 (7.5%) | 3.95 |
| Single Female/Mother | 32 (4.2%) | 4.00 |
| Total Families | 758 (100.0%) | 2.76 |
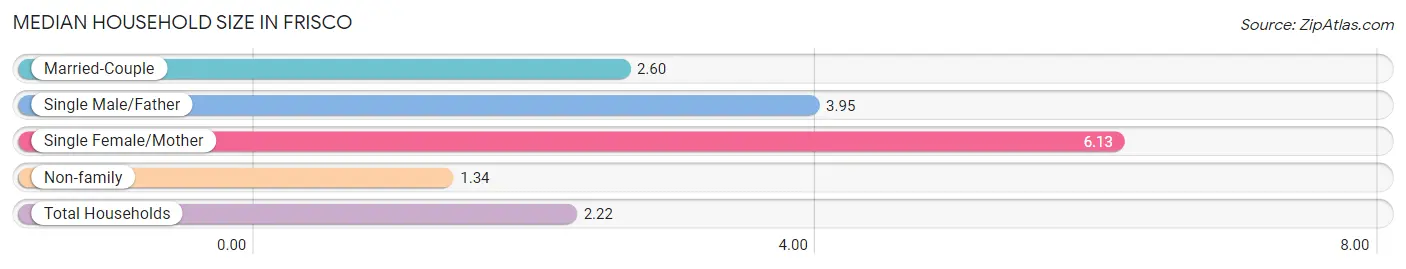
Median Household Size in Frisco
The median household size in Frisco is 2.22 persons per household, with single female/mother households (32 | 2.5%) accounting for the largest median household size of 6.13 persons per household. non-family households (550 | 42.0%) represent the smallest median household size with 1.34 persons per household.
| Household Type | # Households | Household Size |
| Married-Couple | 669 (51.1%) | 2.60 |
| Single Male/Father | 57 (4.4%) | 3.95 |
| Single Female/Mother | 32 (2.5%) | 6.13 |
| Non-family | 550 (42.0%) | 1.34 |
| Total Households | 1,308 (100.0%) | 2.22 |
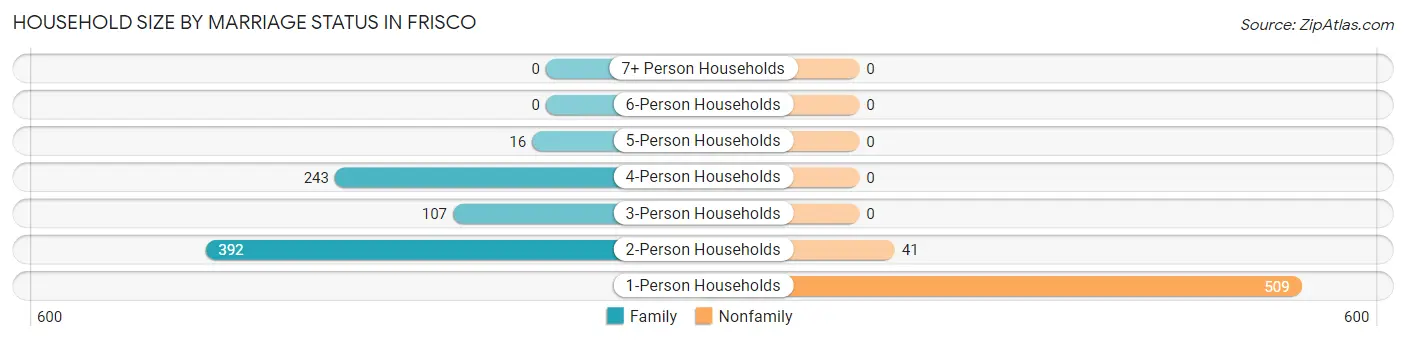
Household Size by Marriage Status in Frisco
Out of a total of 1,308 households in Frisco, 758 (58.0%) are family households, while 550 (42.0%) are nonfamily households. The most numerous type of family households are 2-person households, comprising 392, and the most common type of nonfamily households are 1-person households, comprising 509.
| Household Size | Family Households | Nonfamily Households |
| 1-Person Households | - | 509 (38.9%) |
| 2-Person Households | 392 (30.0%) | 41 (3.1%) |
| 3-Person Households | 107 (8.2%) | 0 (0.0%) |
| 4-Person Households | 243 (18.6%) | 0 (0.0%) |
| 5-Person Households | 16 (1.2%) | 0 (0.0%) |
| 6-Person Households | 0 (0.0%) | 0 (0.0%) |
| 7+ Person Households | 0 (0.0%) | 0 (0.0%) |
| Total | 758 (58.0%) | 550 (42.0%) |
Female Fertility in Frisco
Fertility by Age in Frisco
| Age Bracket | Women with Births | Births / 1,000 Women |
| 15 to 19 years | 0 (0.0%) | 0.0 |
| 20 to 34 years | 0 (0.0%) | 0.0 |
| 35 to 50 years | 0 (0.0%) | 0.0 |
| Total | 0 (0.0%) | 0.0 |
Fertility by Age by Marriage Status in Frisco
| Age Bracket | Married | Unmarried |
| 15 to 19 years | 0 (0.0%) | 0 (0.0%) |
| 20 to 34 years | 0 (0.0%) | 0 (0.0%) |
| 35 to 50 years | 0 (0.0%) | 0 (0.0%) |
| Total | 0 (0.0%) | 0 (0.0%) |
Fertility by Education in Frisco
| Educational Attainment | Women with Births | Births / 1,000 Women |
| Less than High School | 0 (0.0%) | 0.0 |
| High School Diploma | 0 (0.0%) | 0.0 |
| College or Associate's Degree | 0 (0.0%) | 0.0 |
| Bachelor's Degree | 0 (0.0%) | 0.0 |
| Graduate Degree | 0 (0.0%) | 0.0 |
| Total | 0 (0.0%) | 0.0 |
Fertility by Education by Marriage Status in Frisco
| Educational Attainment | Married | Unmarried |
| Less than High School | 0 (0.0%) | 0 (0.0%) |
| High School Diploma | 0 (0.0%) | 0 (0.0%) |
| College or Associate's Degree | 0 (0.0%) | 0 (0.0%) |
| Bachelor's Degree | 0 (0.0%) | 0 (0.0%) |
| Graduate Degree | 0 (0.0%) | 0 (0.0%) |
| Total | 0 (0.0%) | 0 (0.0%) |
Income in Frisco
Income Overview in Frisco
Per Capita Income in Frisco is $58,760, while median incomes of families and households are $121,797 and $101,140 respectively.
| Characteristic | Number | Measure |
| Per Capita Income | 2,900 | $58,760 |
| Median Family Income | 758 | $121,797 |
| Mean Family Income | 758 | $156,996 |
| Median Household Income | 1,308 | $101,140 |
| Mean Household Income | 1,308 | $133,308 |
| Income Deficit | 758 | $0 |
| Wage / Income Gap (%) | 2,900 | 14.35% |
| Wage / Income Gap ($) | 2,900 | 85.65¢ per $1 |
| Gini / Inequality Index | 2,900 | 0.43 |
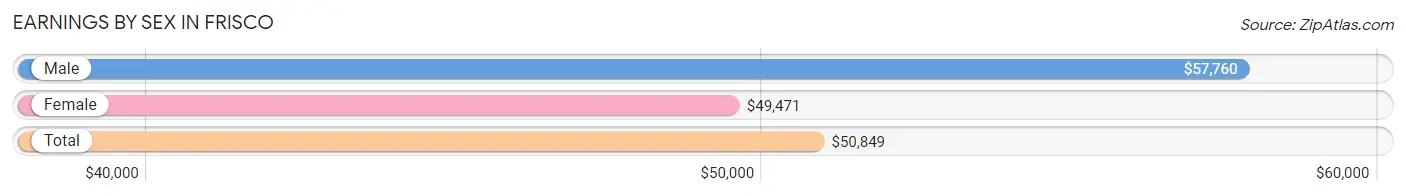
Earnings by Sex in Frisco
Average Earnings in Frisco are $50,849, $57,760 for men and $49,471 for women, a difference of 14.3%.
| Sex | Number | Average Earnings |
| Male | 1,105 (55.4%) | $57,760 |
| Female | 891 (44.6%) | $49,471 |
| Total | 1,996 (100.0%) | $50,849 |
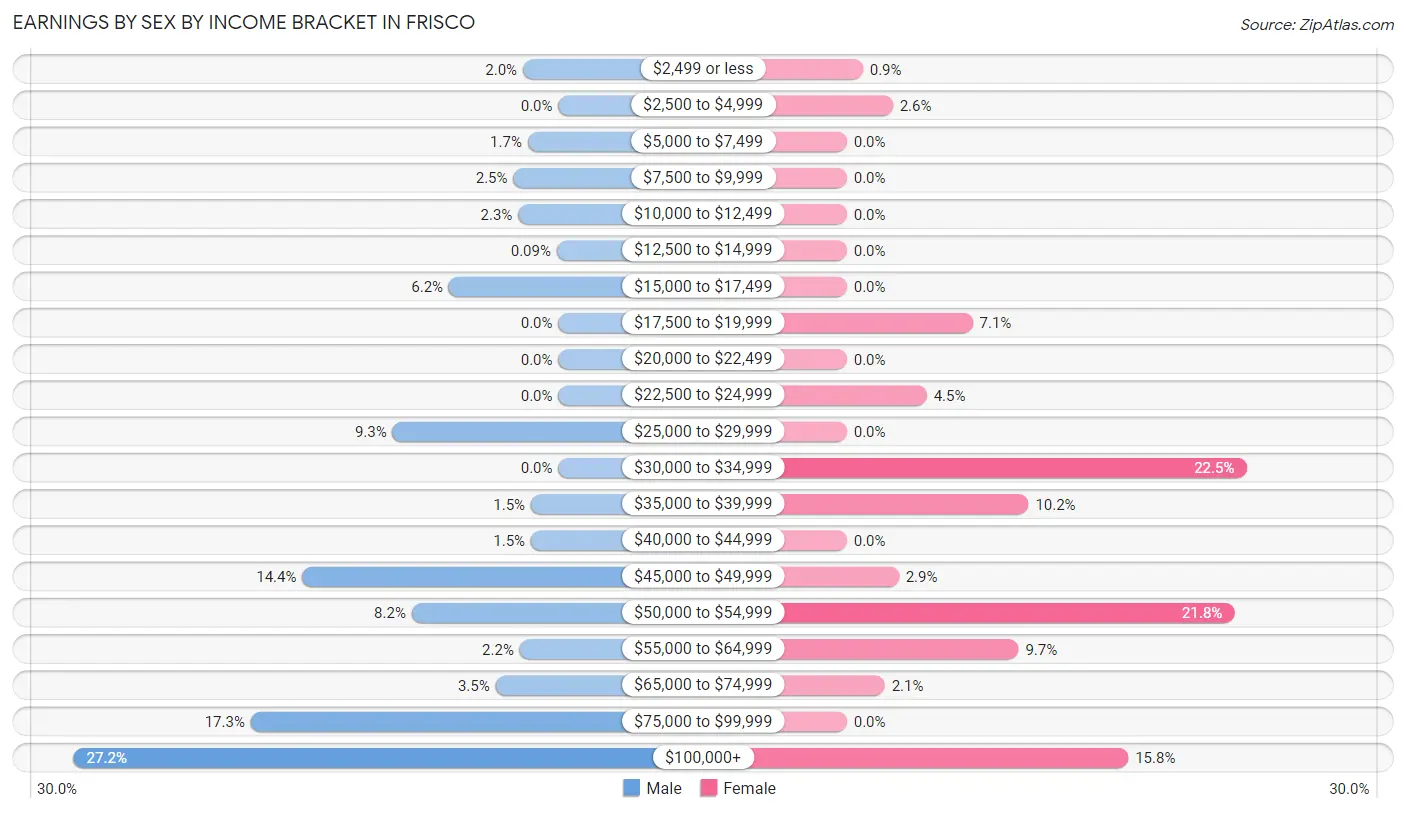
Earnings by Sex by Income Bracket in Frisco
The most common earnings brackets in Frisco are $100,000+ for men (301 | 27.2%) and $30,000 to $34,999 for women (200 | 22.5%).
| Income | Male | Female |
| $2,499 or less | 22 (2.0%) | 8 (0.9%) |
| $2,500 to $4,999 | 0 (0.0%) | 23 (2.6%) |
| $5,000 to $7,499 | 19 (1.7%) | 0 (0.0%) |
| $7,500 to $9,999 | 28 (2.5%) | 0 (0.0%) |
| $10,000 to $12,499 | 25 (2.3%) | 0 (0.0%) |
| $12,500 to $14,999 | 1 (0.1%) | 0 (0.0%) |
| $15,000 to $17,499 | 68 (6.1%) | 0 (0.0%) |
| $17,500 to $19,999 | 0 (0.0%) | 63 (7.1%) |
| $20,000 to $22,499 | 0 (0.0%) | 0 (0.0%) |
| $22,500 to $24,999 | 0 (0.0%) | 40 (4.5%) |
| $25,000 to $29,999 | 103 (9.3%) | 0 (0.0%) |
| $30,000 to $34,999 | 0 (0.0%) | 200 (22.5%) |
| $35,000 to $39,999 | 17 (1.5%) | 91 (10.2%) |
| $40,000 to $44,999 | 17 (1.5%) | 0 (0.0%) |
| $45,000 to $49,999 | 159 (14.4%) | 26 (2.9%) |
| $50,000 to $54,999 | 91 (8.2%) | 194 (21.8%) |
| $55,000 to $64,999 | 24 (2.2%) | 86 (9.7%) |
| $65,000 to $74,999 | 39 (3.5%) | 19 (2.1%) |
| $75,000 to $99,999 | 191 (17.3%) | 0 (0.0%) |
| $100,000+ | 301 (27.2%) | 141 (15.8%) |
| Total | 1,105 (100.0%) | 891 (100.0%) |
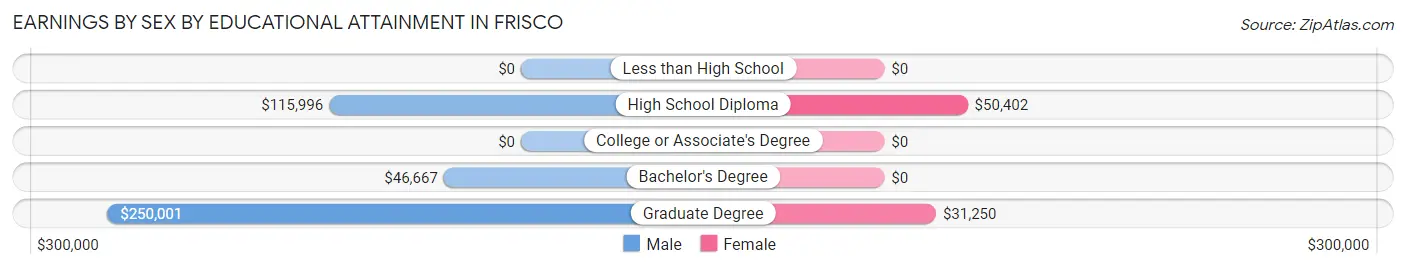
Earnings by Sex by Educational Attainment in Frisco
Average earnings in Frisco are $71,442 for men and $50,618 for women, a difference of 29.1%. Men with an educational attainment of graduate degree enjoy the highest average annual earnings of $250,001, while those with bachelor's degree education earn the least with $46,667. Women with an educational attainment of high school diploma earn the most with the average annual earnings of $50,402, while those with graduate degree education have the smallest earnings of $31,250.
| Educational Attainment | Male Income | Female Income |
| Less than High School | - | - |
| High School Diploma | $115,996 | $50,402 |
| College or Associate's Degree | - | - |
| Bachelor's Degree | $46,667 | $0 |
| Graduate Degree | $250,001 | $31,250 |
| Total | $71,442 | $50,618 |
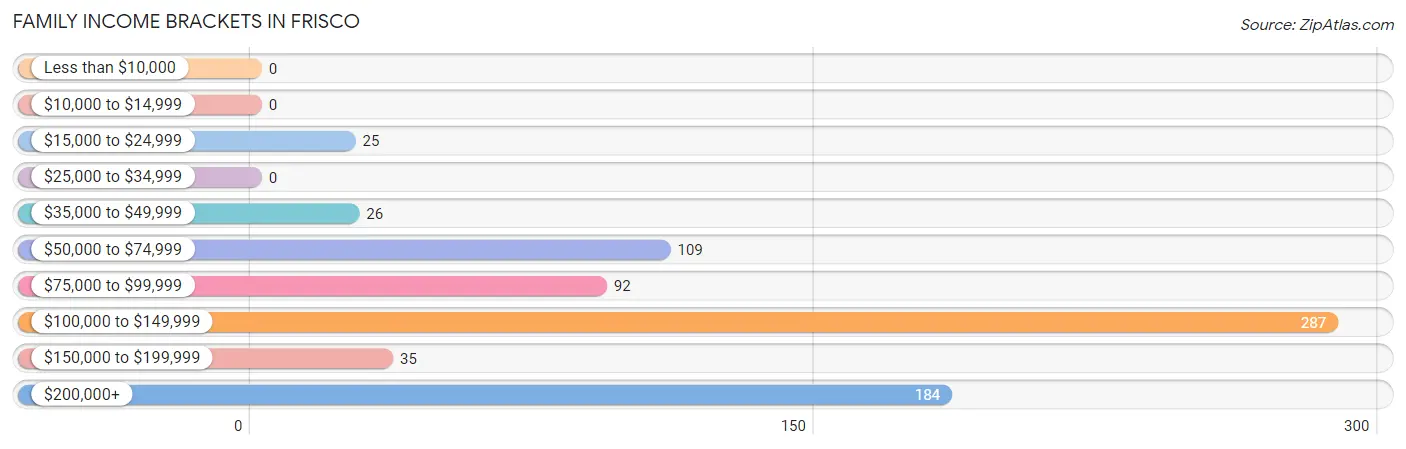
Family Income in Frisco
Family Income Brackets in Frisco
According to the Frisco family income data, there are 287 families falling into the $100,000 to $149,999 income range, which is the most common income bracket and makes up 37.9% of all families.
| Income Bracket | # Families | % Families |
| Less than $10,000 | 0 | 0.0% |
| $10,000 to $14,999 | 0 | 0.0% |
| $15,000 to $24,999 | 25 | 3.3% |
| $25,000 to $34,999 | 0 | 0.0% |
| $35,000 to $49,999 | 26 | 3.4% |
| $50,000 to $74,999 | 109 | 14.4% |
| $75,000 to $99,999 | 92 | 12.1% |
| $100,000 to $149,999 | 287 | 37.9% |
| $150,000 to $199,999 | 35 | 4.6% |
| $200,000+ | 184 | 24.3% |
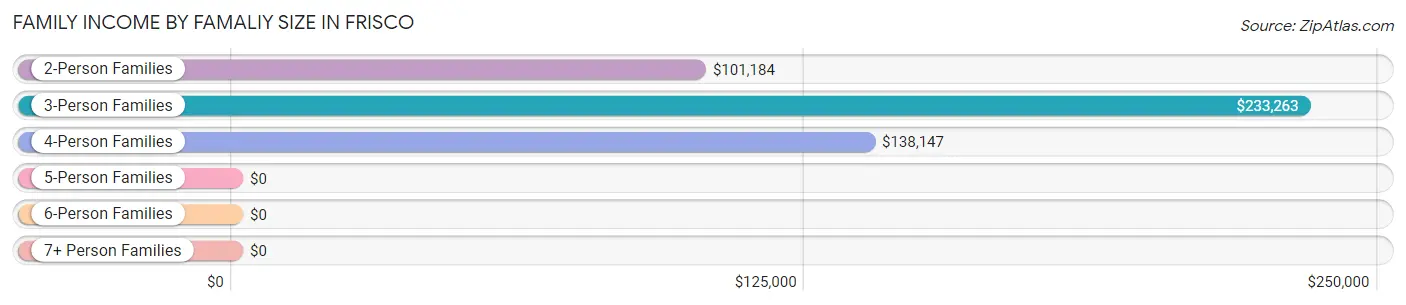
Family Income by Famaliy Size in Frisco
3-person families (139 | 18.3%) account for the highest median family income in Frisco with $233,263 per family, while 3-person families (139 | 18.3%) have the highest median income of $77,754 per family member.
| Income Bracket | # Families | Median Income |
| 2-Person Families | 392 (51.7%) | $101,184 |
| 3-Person Families | 139 (18.3%) | $233,263 |
| 4-Person Families | 211 (27.8%) | $138,147 |
| 5-Person Families | 16 (2.1%) | $0 |
| 6-Person Families | 0 (0.0%) | $0 |
| 7+ Person Families | 0 (0.0%) | $0 |
| Total | 758 (100.0%) | $121,797 |
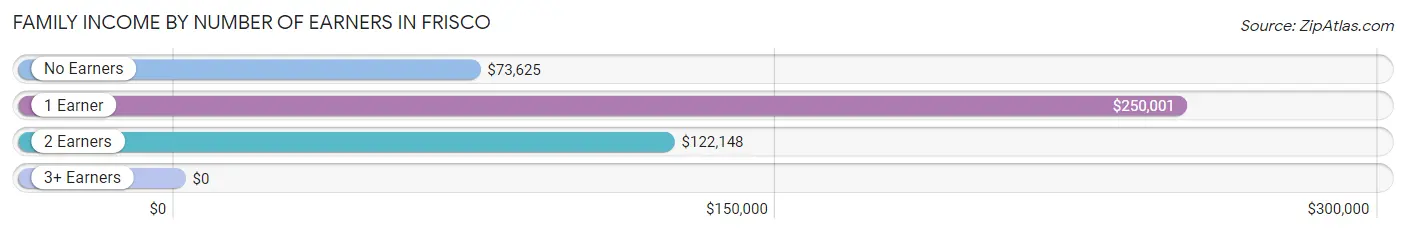
Family Income by Number of Earners in Frisco
| Number of Earners | # Families | Median Income |
| No Earners | 61 (8.1%) | $73,625 |
| 1 Earner | 151 (19.9%) | $250,001 |
| 2 Earners | 479 (63.2%) | $122,148 |
| 3+ Earners | 67 (8.8%) | $0 |
| Total | 758 (100.0%) | $121,797 |
Household Income in Frisco
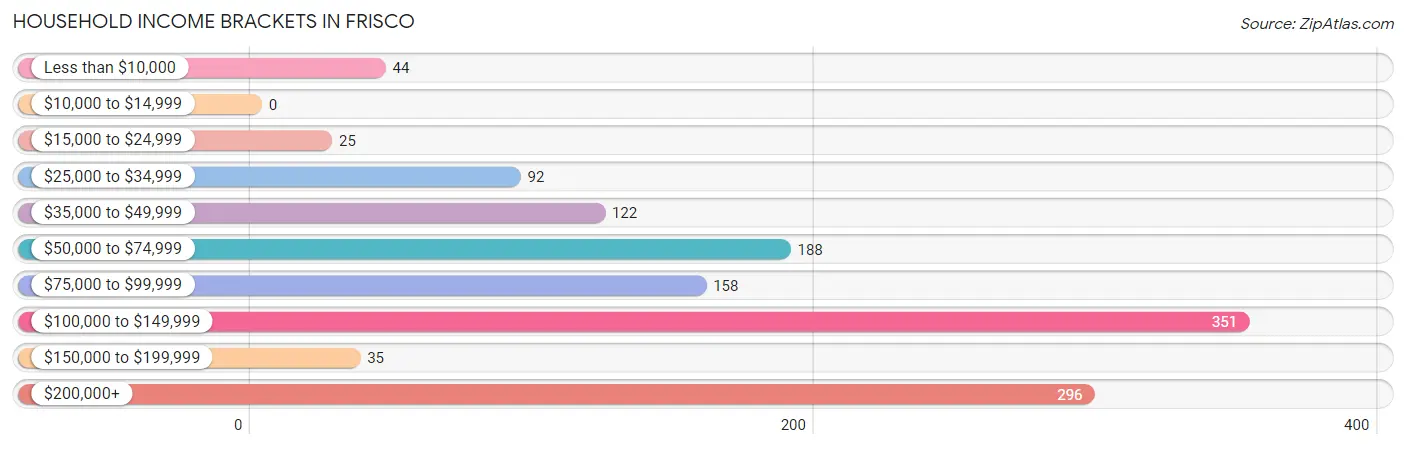
Household Income Brackets in Frisco
With 351 households falling in the category, the $100,000 to $149,999 income range is the most frequent in Frisco, accounting for 26.8% of all households.
| Income Bracket | # Households | % Households |
| Less than $10,000 | 44 | 3.4% |
| $10,000 to $14,999 | 0 | 0.0% |
| $15,000 to $24,999 | 25 | 1.9% |
| $25,000 to $34,999 | 92 | 7.0% |
| $35,000 to $49,999 | 122 | 9.3% |
| $50,000 to $74,999 | 188 | 14.4% |
| $75,000 to $99,999 | 158 | 12.1% |
| $100,000 to $149,999 | 351 | 26.8% |
| $150,000 to $199,999 | 35 | 2.7% |
| $200,000+ | 296 | 22.6% |
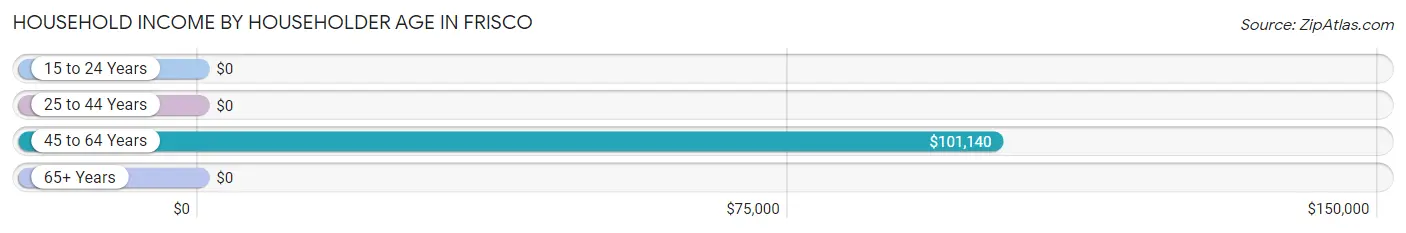
Household Income by Householder Age in Frisco
The median household income in Frisco is $101,140, with the highest median household income of $101,140 found in the 45 to 64 years age bracket for the primary householder. A total of 756 households (57.8%) fall into this category.
| Income Bracket | # Households | Median Income |
| 15 to 24 Years | 0 (0.0%) | $0 |
| 25 to 44 Years | 287 (21.9%) | $0 |
| 45 to 64 Years | 756 (57.8%) | $101,140 |
| 65+ Years | 265 (20.3%) | $0 |
| Total | 1,308 (100.0%) | $101,140 |
Poverty in Frisco
Income Below Poverty by Sex and Age in Frisco
With 6.2% poverty level for males and 6.5% for females among the residents of Frisco, 12 to 14 year old males and 15 year old females are the most vulnerable to poverty, with 33 males (50.0%) and 25 females (100.0%) in their respective age groups living below the poverty level.
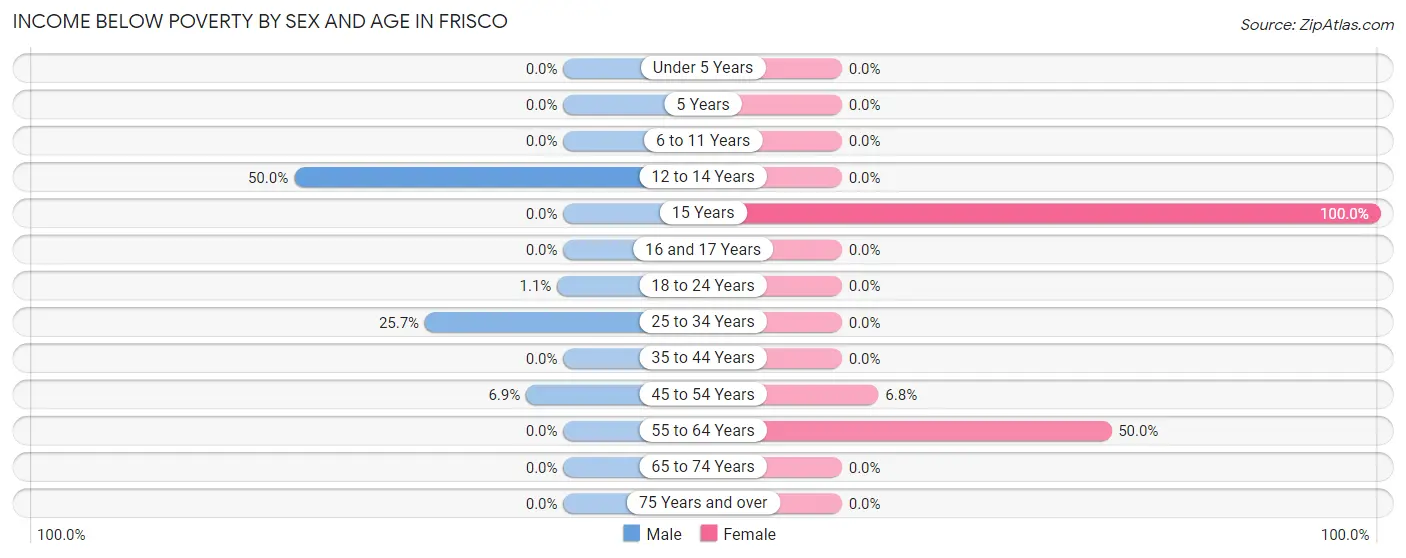
| Age Bracket | Male | Female |
| Under 5 Years | 0 (0.0%) | 0 (0.0%) |
| 5 Years | 0 (0.0%) | 0 (0.0%) |
| 6 to 11 Years | 0 (0.0%) | 0 (0.0%) |
| 12 to 14 Years | 33 (50.0%) | 0 (0.0%) |
| 15 Years | 0 (0.0%) | 25 (100.0%) |
| 16 and 17 Years | 0 (0.0%) | 0 (0.0%) |
| 18 to 24 Years | 1 (1.1%) | 0 (0.0%) |
| 25 to 34 Years | 28 (25.7%) | 0 (0.0%) |
| 35 to 44 Years | 0 (0.0%) | 0 (0.0%) |
| 45 to 54 Years | 25 (6.9%) | 27 (6.8%) |
| 55 to 64 Years | 0 (0.0%) | 45 (50.0%) |
| 65 to 74 Years | 0 (0.0%) | 0 (0.0%) |
| 75 Years and over | 0 (0.0%) | 0 (0.0%) |
| Total | 87 (6.2%) | 97 (6.5%) |
Income Above Poverty by Sex and Age in Frisco
According to the poverty statistics in Frisco, males aged 5 years and females aged 12 to 14 years are the age groups that are most secure financially, with 100.0% of males and 100.0% of females in these age groups living above the poverty line.
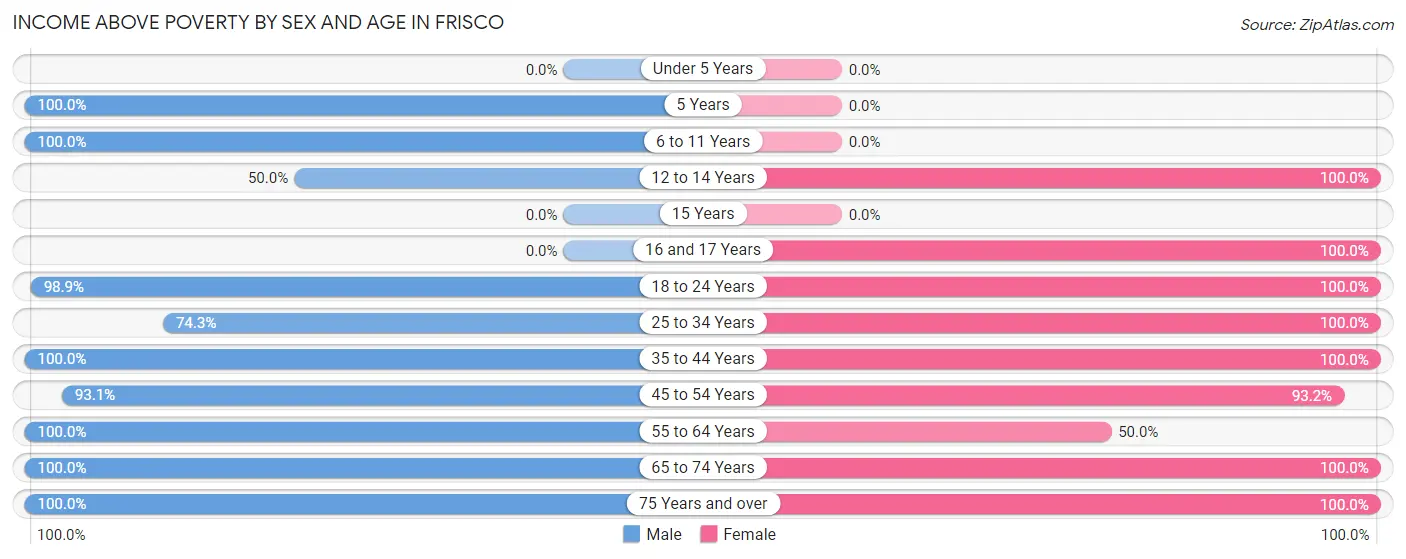
| Age Bracket | Male | Female |
| Under 5 Years | 0 (0.0%) | 0 (0.0%) |
| 5 Years | 22 (100.0%) | 0 (0.0%) |
| 6 to 11 Years | 115 (100.0%) | 0 (0.0%) |
| 12 to 14 Years | 33 (50.0%) | 65 (100.0%) |
| 15 Years | 0 (0.0%) | 0 (0.0%) |
| 16 and 17 Years | 0 (0.0%) | 200 (100.0%) |
| 18 to 24 Years | 87 (98.9%) | 63 (100.0%) |
| 25 to 34 Years | 81 (74.3%) | 272 (100.0%) |
| 35 to 44 Years | 287 (100.0%) | 164 (100.0%) |
| 45 to 54 Years | 336 (93.1%) | 370 (93.2%) |
| 55 to 64 Years | 143 (100.0%) | 45 (50.0%) |
| 65 to 74 Years | 175 (100.0%) | 115 (100.0%) |
| 75 Years and over | 36 (100.0%) | 107 (100.0%) |
| Total | 1,315 (93.8%) | 1,401 (93.5%) |
Income Below Poverty Among Married-Couple Families in Frisco
The poverty statistics for married-couple families in Frisco show that 3.7% or 25 of the total 669 families live below the poverty line. Families with 1 or 2 children have the highest poverty rate of 7.5%, comprising of 25 families. On the other hand, families with no children have the lowest poverty rate of 0.0%, which includes 0 families.
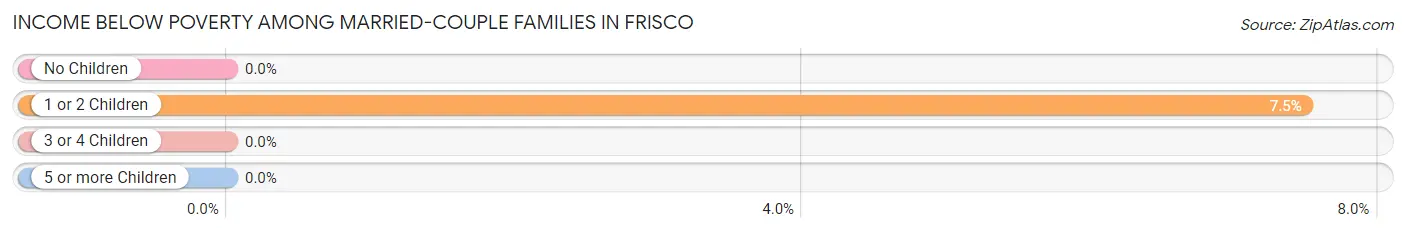
| Children | Above Poverty | Below Poverty |
| No Children | 335 (100.0%) | 0 (0.0%) |
| 1 or 2 Children | 309 (92.5%) | 25 (7.5%) |
| 3 or 4 Children | 0 (0.0%) | 0 (0.0%) |
| 5 or more Children | 0 (0.0%) | 0 (0.0%) |
| Total | 644 (96.3%) | 25 (3.7%) |
Income Below Poverty Among Single-Parent Households in Frisco
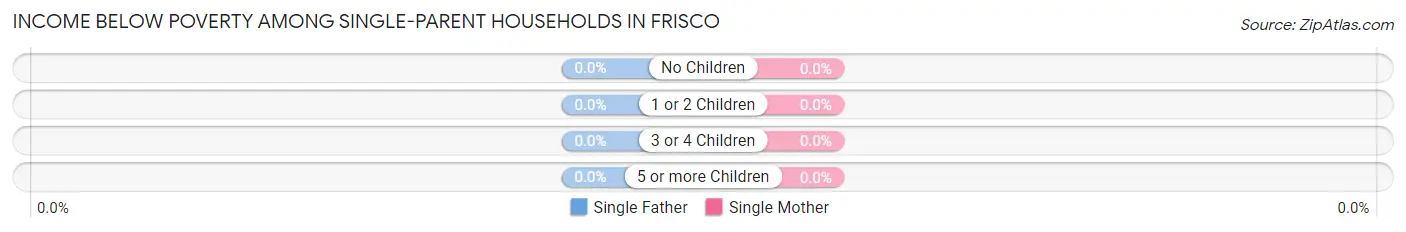
| Children | Single Father | Single Mother |
| No Children | 0 (0.0%) | 0 (0.0%) |
| 1 or 2 Children | 0 (0.0%) | 0 (0.0%) |
| 3 or 4 Children | 0 (0.0%) | 0 (0.0%) |
| 5 or more Children | 0 (0.0%) | 0 (0.0%) |
| Total | 0 (0.0%) | 0 (0.0%) |
Income Below Poverty Among Married-Couple vs Single-Parent Households in Frisco
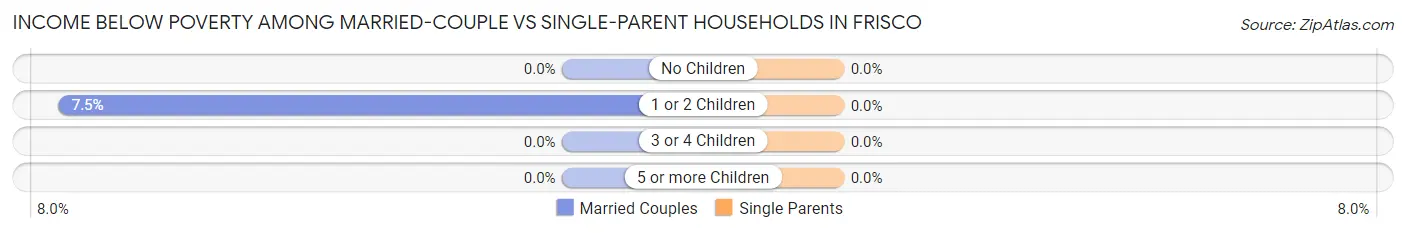
| Children | Married-Couple Families | Single-Parent Households |
| No Children | 0 (0.0%) | 0 (0.0%) |
| 1 or 2 Children | 25 (7.5%) | 0 (0.0%) |
| 3 or 4 Children | 0 (0.0%) | 0 (0.0%) |
| 5 or more Children | 0 (0.0%) | 0 (0.0%) |
| Total | 25 (3.7%) | 0 (0.0%) |
Employment Characteristics in Frisco
Employment by Class of Employer in Frisco
Among the 1,671 employed individuals in Frisco, private company employees (1,367 | 81.8%), self-employed (incorporated) (123 | 7.4%), and self-employed (not incorporated) (100 | 6.0%) make up the most common classes of employment.
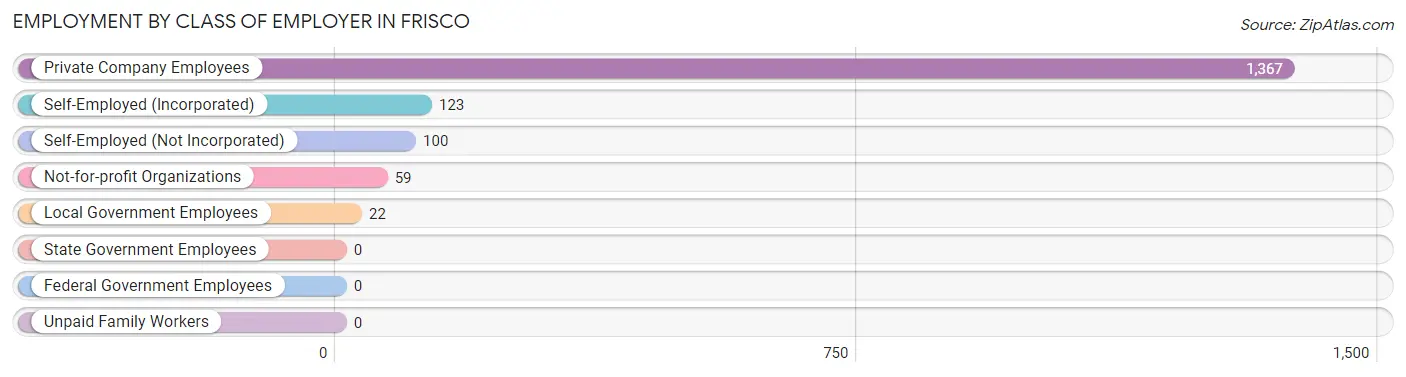
| Employer Class | # Employees | % Employees |
| Private Company Employees | 1,367 | 81.8% |
| Self-Employed (Incorporated) | 123 | 7.4% |
| Self-Employed (Not Incorporated) | 100 | 6.0% |
| Not-for-profit Organizations | 59 | 3.5% |
| Local Government Employees | 22 | 1.3% |
| State Government Employees | 0 | 0.0% |
| Federal Government Employees | 0 | 0.0% |
| Unpaid Family Workers | 0 | 0.0% |
| Total | 1,671 | 100.0% |
Employment Status by Age in Frisco
According to the labor force statistics for Frisco, out of the total population over 16 years of age (2,607), 74.0% or 1,929 individuals are in the labor force, with 1.5% or 29 of them unemployed. The age group with the highest labor force participation rate is 20 to 24 years, with 100.0% or 20 individuals in the labor force. Within the labor force, the 25 to 29 years age range has the highest percentage of unemployed individuals, with 13.0% or 28 of them being unemployed.
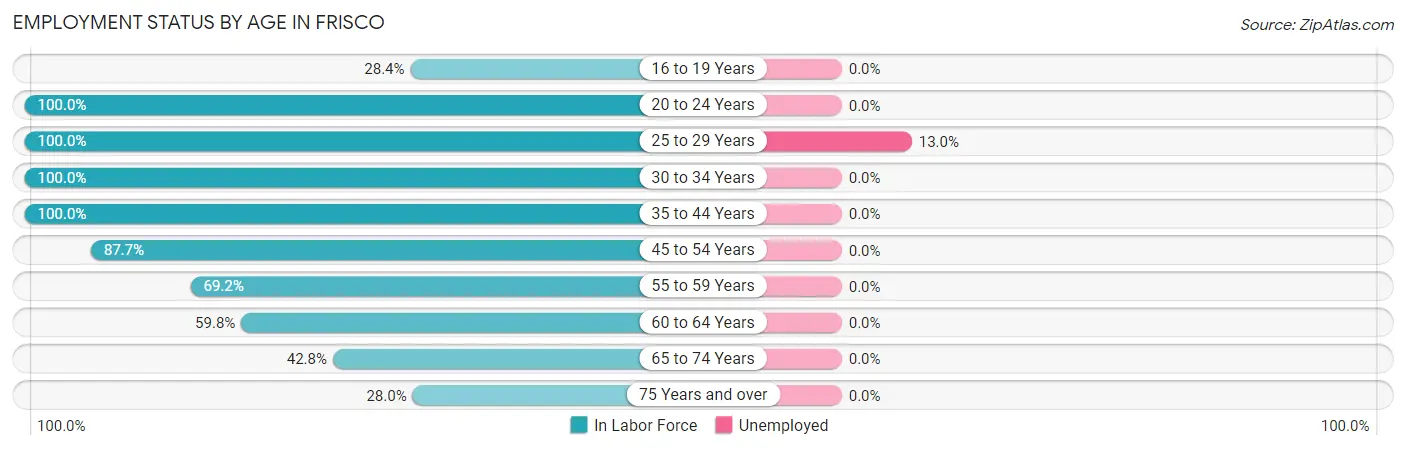
| Age Bracket | In Labor Force | Unemployed |
| 16 to 19 Years | 94 (28.4%) | 0 (0.0%) |
| 20 to 24 Years | 20 (100.0%) | 0 (0.0%) |
| 25 to 29 Years | 215 (100.0%) | 28 (13.0%) |
| 30 to 34 Years | 166 (100.0%) | 0 (0.0%) |
| 35 to 44 Years | 451 (100.0%) | 0 (0.0%) |
| 45 to 54 Years | 665 (87.7%) | 0 (0.0%) |
| 55 to 59 Years | 101 (69.2%) | 0 (0.0%) |
| 60 to 64 Years | 52 (59.8%) | 0 (0.0%) |
| 65 to 74 Years | 124 (42.8%) | 0 (0.0%) |
| 75 Years and over | 40 (28.0%) | 0 (0.0%) |
| Total | 1,929 (74.0%) | 29 (1.5%) |
Employment Status by Educational Attainment in Frisco
According to labor force statistics for Frisco, 90.5% of individuals (1,650) out of the total population between 25 and 64 years of age (1,823) are in the labor force, with 1.7% or 28 of them being unemployed. The group with the highest labor force participation rate are those with the educational attainment of high school diploma, with 100.0% or 470 individuals in the labor force. Within the labor force, individuals with high school diploma education have the highest percentage of unemployment, with 6.0% or 28 of them being unemployed.
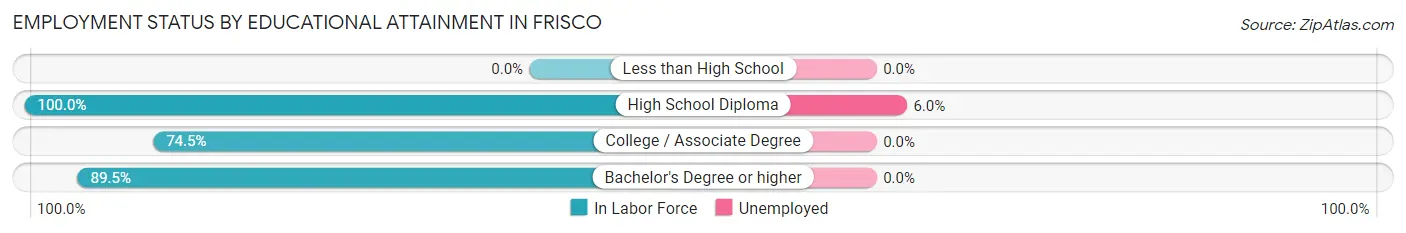
| Educational Attainment | In Labor Force | Unemployed |
| Less than High School | 0 (0.0%) | 0 (0.0%) |
| High School Diploma | 470 (100.0%) | 28 (6.0%) |
| College / Associate Degree | 152 (74.5%) | 0 (0.0%) |
| Bachelor's Degree or higher | 1,028 (89.5%) | 0 (0.0%) |
| Total | 1,650 (90.5%) | 31 (1.7%) |
Employment Occupations by Sex in Frisco
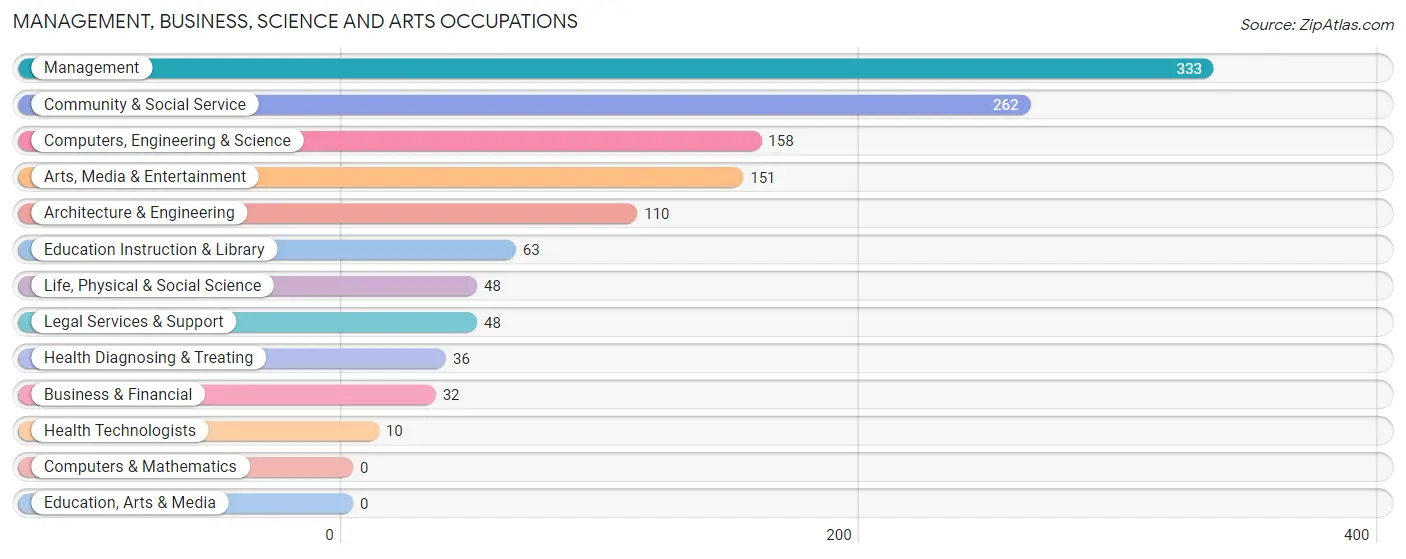
Management, Business, Science and Arts Occupations
The most common Management, Business, Science and Arts occupations in Frisco are Management (333 | 17.5%), Community & Social Service (262 | 13.8%), Computers, Engineering & Science (158 | 8.3%), Arts, Media & Entertainment (151 | 8.0%), and Architecture & Engineering (110 | 5.8%).
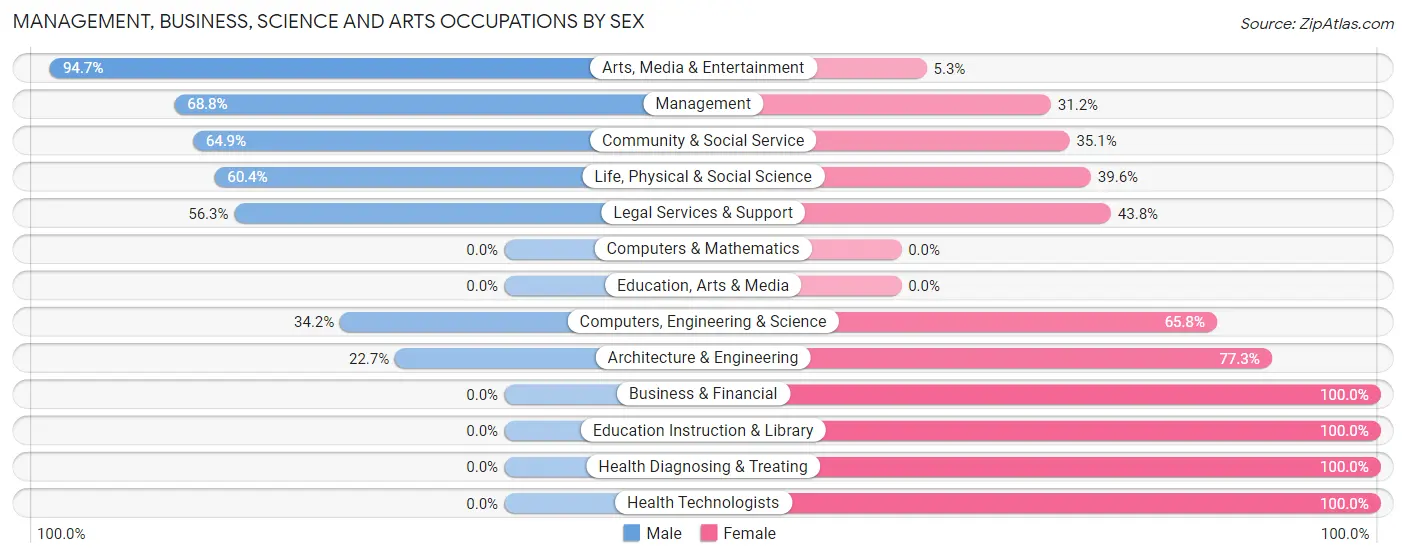
Management, Business, Science and Arts Occupations by Sex
Within the Management, Business, Science and Arts occupations in Frisco, the most male-oriented occupations are Arts, Media & Entertainment (94.7%), Management (68.8%), and Community & Social Service (64.9%), while the most female-oriented occupations are Business & Financial (100.0%), Education Instruction & Library (100.0%), and Health Diagnosing & Treating (100.0%).
| Occupation | Male | Female |
| Management | 229 (68.8%) | 104 (31.2%) |
| Business & Financial | 0 (0.0%) | 32 (100.0%) |
| Computers, Engineering & Science | 54 (34.2%) | 104 (65.8%) |
| Computers & Mathematics | 0 (0.0%) | 0 (0.0%) |
| Architecture & Engineering | 25 (22.7%) | 85 (77.3%) |
| Life, Physical & Social Science | 29 (60.4%) | 19 (39.6%) |
| Community & Social Service | 170 (64.9%) | 92 (35.1%) |
| Education, Arts & Media | 0 (0.0%) | 0 (0.0%) |
| Legal Services & Support | 27 (56.2%) | 21 (43.8%) |
| Education Instruction & Library | 0 (0.0%) | 63 (100.0%) |
| Arts, Media & Entertainment | 143 (94.7%) | 8 (5.3%) |
| Health Diagnosing & Treating | 0 (0.0%) | 36 (100.0%) |
| Health Technologists | 0 (0.0%) | 10 (100.0%) |
| Total (Category) | 453 (55.2%) | 368 (44.8%) |
| Total (Overall) | 1,009 (53.1%) | 891 (46.9%) |
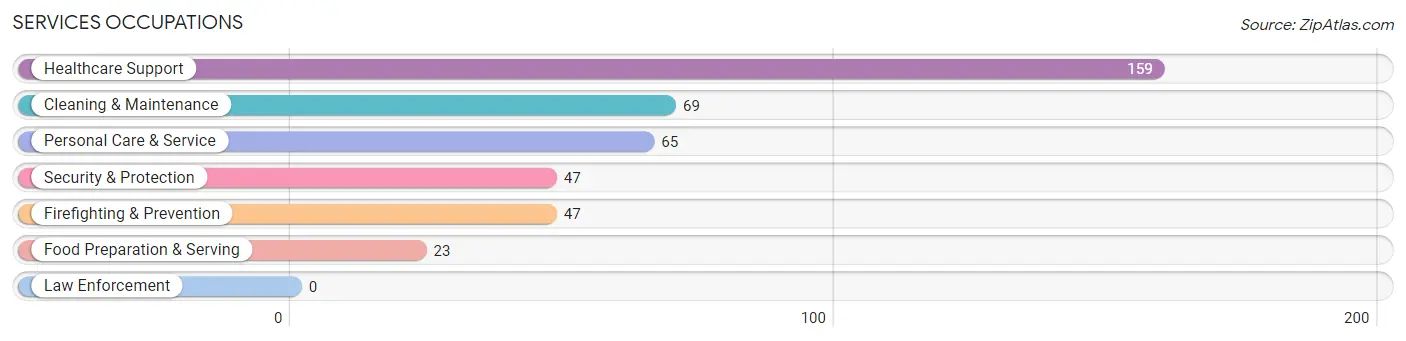
Services Occupations
The most common Services occupations in Frisco are Healthcare Support (159 | 8.4%), Cleaning & Maintenance (69 | 3.6%), Personal Care & Service (65 | 3.4%), Security & Protection (47 | 2.5%), and Firefighting & Prevention (47 | 2.5%).
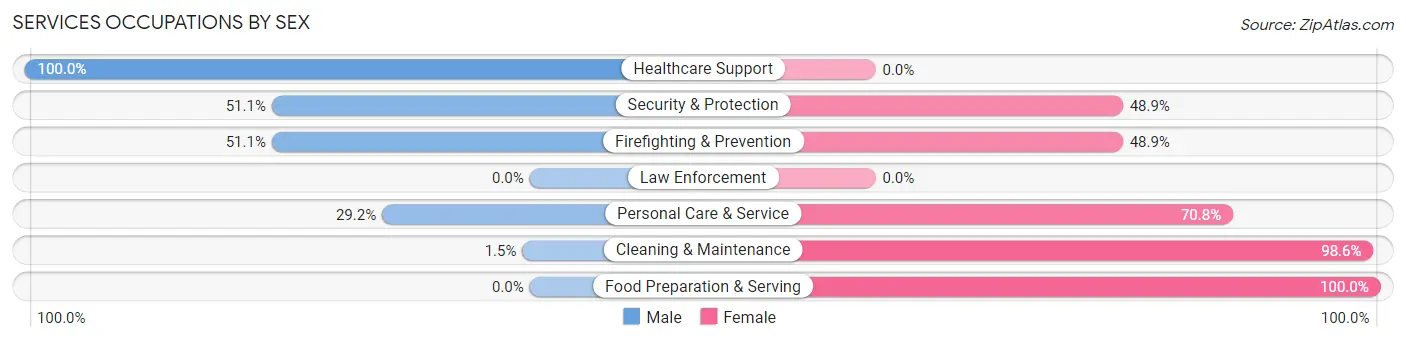
Services Occupations by Sex
Within the Services occupations in Frisco, the most male-oriented occupations are Healthcare Support (100.0%), Security & Protection (51.1%), and Firefighting & Prevention (51.1%), while the most female-oriented occupations are Food Preparation & Serving (100.0%), Cleaning & Maintenance (98.6%), and Personal Care & Service (70.8%).
| Occupation | Male | Female |
| Healthcare Support | 159 (100.0%) | 0 (0.0%) |
| Security & Protection | 24 (51.1%) | 23 (48.9%) |
| Firefighting & Prevention | 24 (51.1%) | 23 (48.9%) |
| Law Enforcement | 0 (0.0%) | 0 (0.0%) |
| Food Preparation & Serving | 0 (0.0%) | 23 (100.0%) |
| Cleaning & Maintenance | 1 (1.5%) | 68 (98.6%) |
| Personal Care & Service | 19 (29.2%) | 46 (70.8%) |
| Total (Category) | 203 (55.9%) | 160 (44.1%) |
| Total (Overall) | 1,009 (53.1%) | 891 (46.9%) |
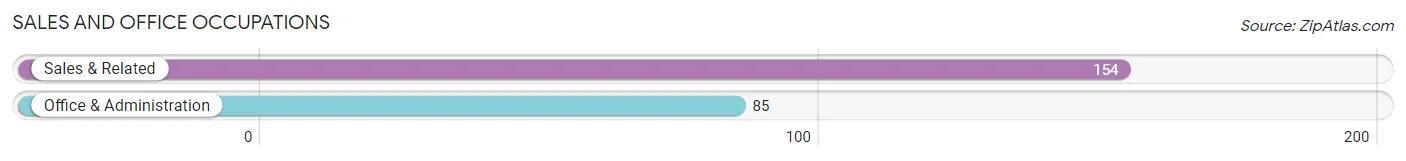
Sales and Office Occupations
The most common Sales and Office occupations in Frisco are Sales & Related (154 | 8.1%), and Office & Administration (85 | 4.5%).
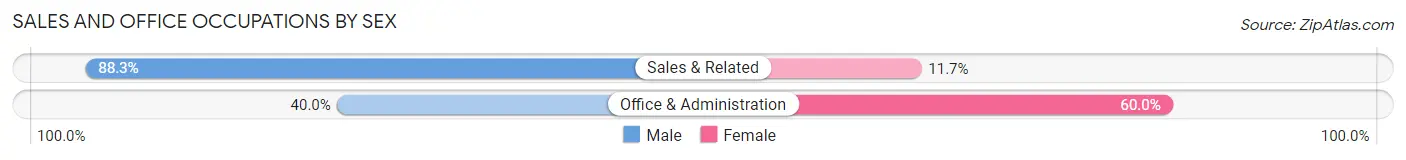
Sales and Office Occupations by Sex
| Occupation | Male | Female |
| Sales & Related | 136 (88.3%) | 18 (11.7%) |
| Office & Administration | 34 (40.0%) | 51 (60.0%) |
| Total (Category) | 170 (71.1%) | 69 (28.9%) |
| Total (Overall) | 1,009 (53.1%) | 891 (46.9%) |
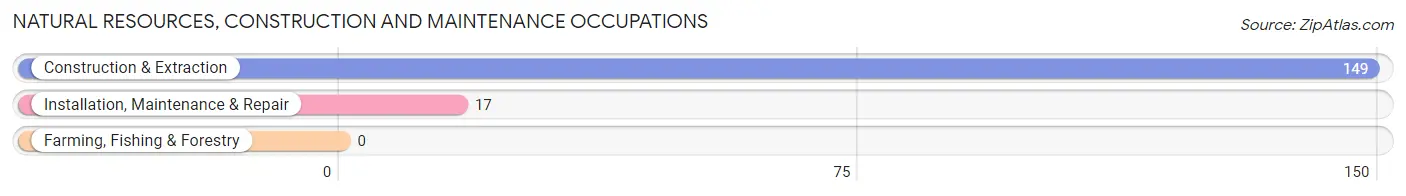
Natural Resources, Construction and Maintenance Occupations
The most common Natural Resources, Construction and Maintenance occupations in Frisco are Construction & Extraction (149 | 7.8%), and Installation, Maintenance & Repair (17 | 0.9%).
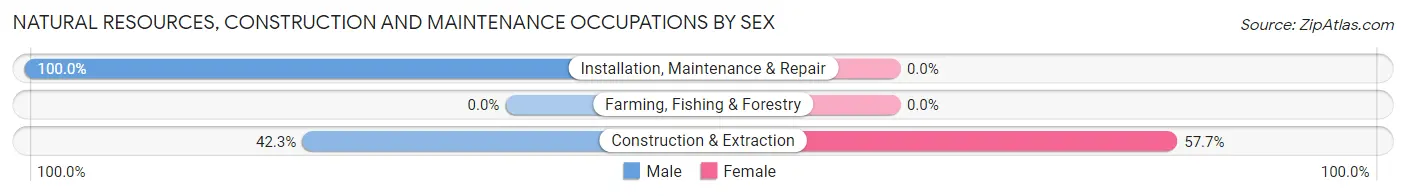
Natural Resources, Construction and Maintenance Occupations by Sex
| Occupation | Male | Female |
| Farming, Fishing & Forestry | 0 (0.0%) | 0 (0.0%) |
| Construction & Extraction | 63 (42.3%) | 86 (57.7%) |
| Installation, Maintenance & Repair | 17 (100.0%) | 0 (0.0%) |
| Total (Category) | 80 (48.2%) | 86 (51.8%) |
| Total (Overall) | 1,009 (53.1%) | 891 (46.9%) |
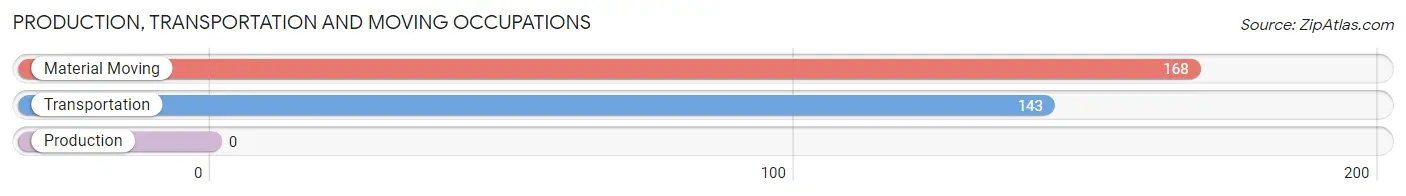
Production, Transportation and Moving Occupations
The most common Production, Transportation and Moving occupations in Frisco are Material Moving (168 | 8.8%), and Transportation (143 | 7.5%).
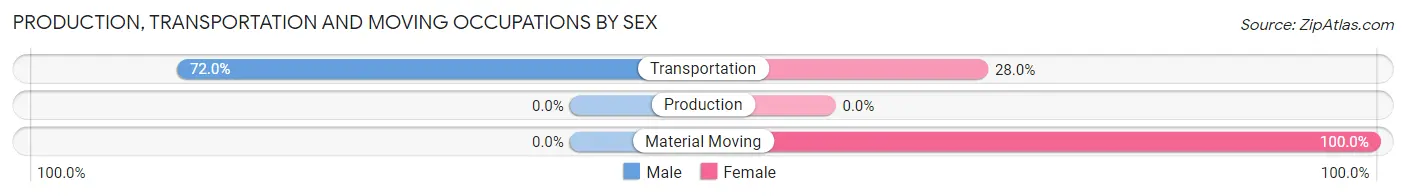
Production, Transportation and Moving Occupations by Sex
| Occupation | Male | Female |
| Production | 0 (0.0%) | 0 (0.0%) |
| Transportation | 103 (72.0%) | 40 (28.0%) |
| Material Moving | 0 (0.0%) | 168 (100.0%) |
| Total (Category) | 103 (33.1%) | 208 (66.9%) |
| Total (Overall) | 1,009 (53.1%) | 891 (46.9%) |
Employment Industries by Sex in Frisco
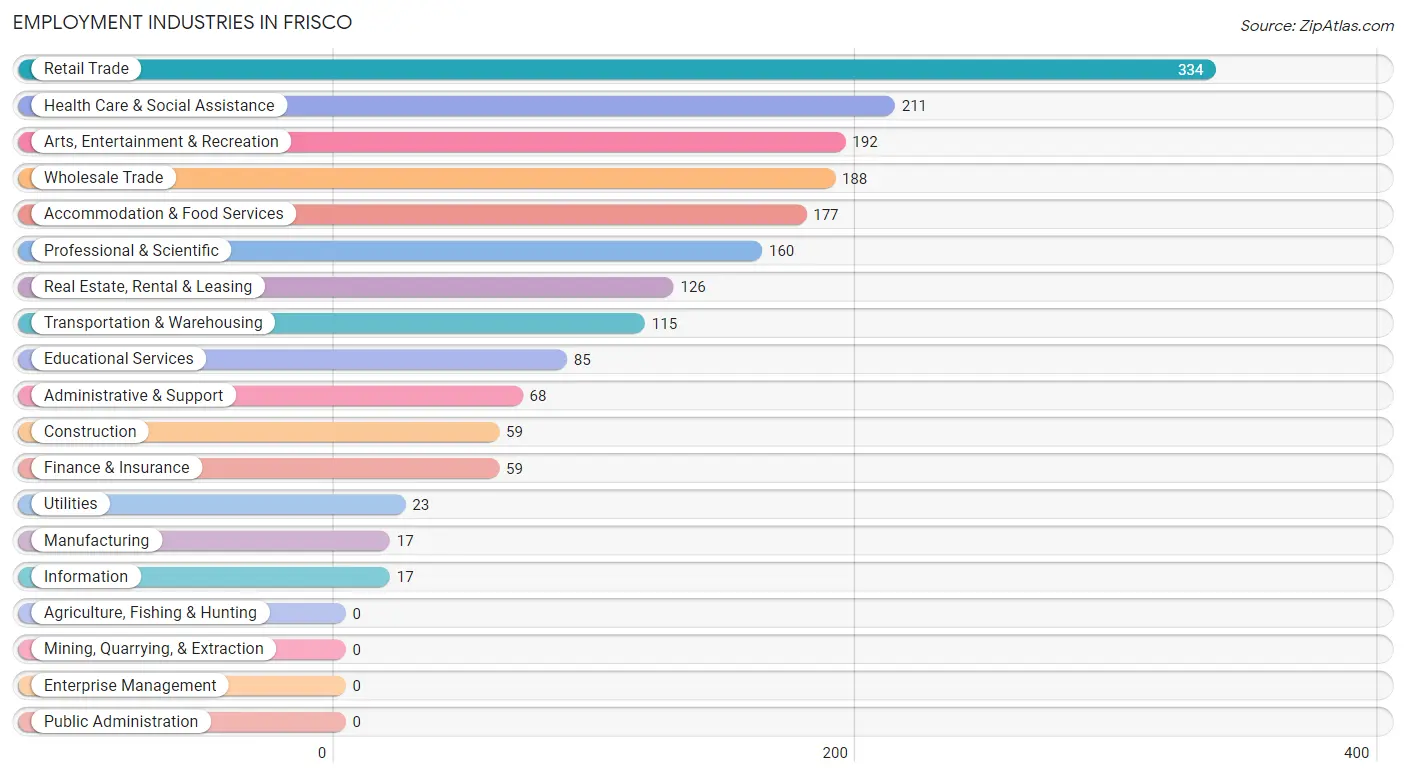
Employment Industries in Frisco
The major employment industries in Frisco include Retail Trade (334 | 17.6%), Health Care & Social Assistance (211 | 11.1%), Arts, Entertainment & Recreation (192 | 10.1%), Wholesale Trade (188 | 9.9%), and Accommodation & Food Services (177 | 9.3%).
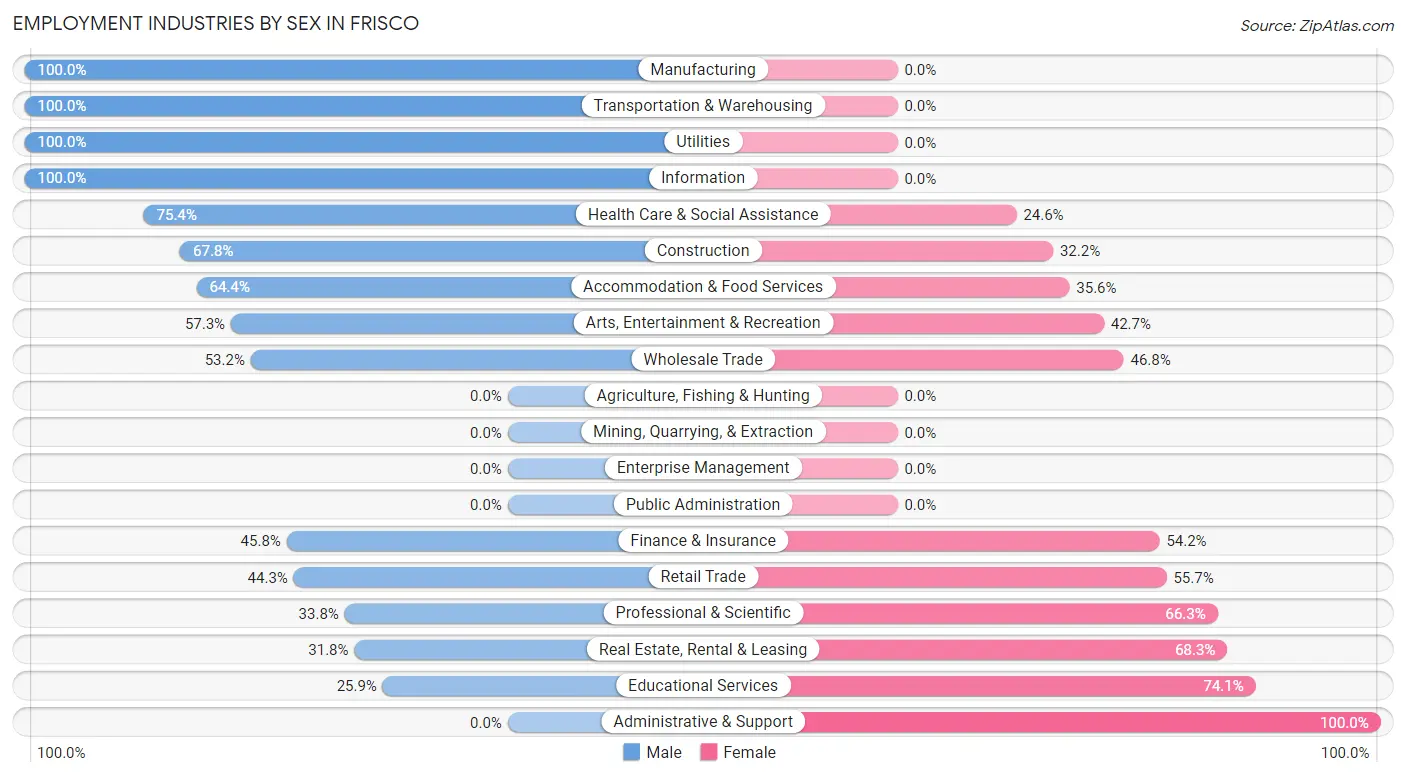
Employment Industries by Sex in Frisco
The Frisco industries that see more men than women are Manufacturing (100.0%), Transportation & Warehousing (100.0%), and Utilities (100.0%), whereas the industries that tend to have a higher number of women are Administrative & Support (100.0%), Educational Services (74.1%), and Real Estate, Rental & Leasing (68.2%).
| Industry | Male | Female |
| Agriculture, Fishing & Hunting | 0 (0.0%) | 0 (0.0%) |
| Mining, Quarrying, & Extraction | 0 (0.0%) | 0 (0.0%) |
| Construction | 40 (67.8%) | 19 (32.2%) |
| Manufacturing | 17 (100.0%) | 0 (0.0%) |
| Wholesale Trade | 100 (53.2%) | 88 (46.8%) |
| Retail Trade | 148 (44.3%) | 186 (55.7%) |
| Transportation & Warehousing | 115 (100.0%) | 0 (0.0%) |
| Utilities | 23 (100.0%) | 0 (0.0%) |
| Information | 17 (100.0%) | 0 (0.0%) |
| Finance & Insurance | 27 (45.8%) | 32 (54.2%) |
| Real Estate, Rental & Leasing | 40 (31.8%) | 86 (68.2%) |
| Professional & Scientific | 54 (33.8%) | 106 (66.2%) |
| Enterprise Management | 0 (0.0%) | 0 (0.0%) |
| Administrative & Support | 0 (0.0%) | 68 (100.0%) |
| Educational Services | 22 (25.9%) | 63 (74.1%) |
| Health Care & Social Assistance | 159 (75.4%) | 52 (24.6%) |
| Arts, Entertainment & Recreation | 110 (57.3%) | 82 (42.7%) |
| Accommodation & Food Services | 114 (64.4%) | 63 (35.6%) |
| Public Administration | 0 (0.0%) | 0 (0.0%) |
| Total | 1,009 (53.1%) | 891 (46.9%) |
Education in Frisco
School Enrollment in Frisco
The most common levels of schooling among the 667 students in Frisco are high school (404 | 60.6%), elementary school (115 | 17.2%), and middle school (83 | 12.4%).
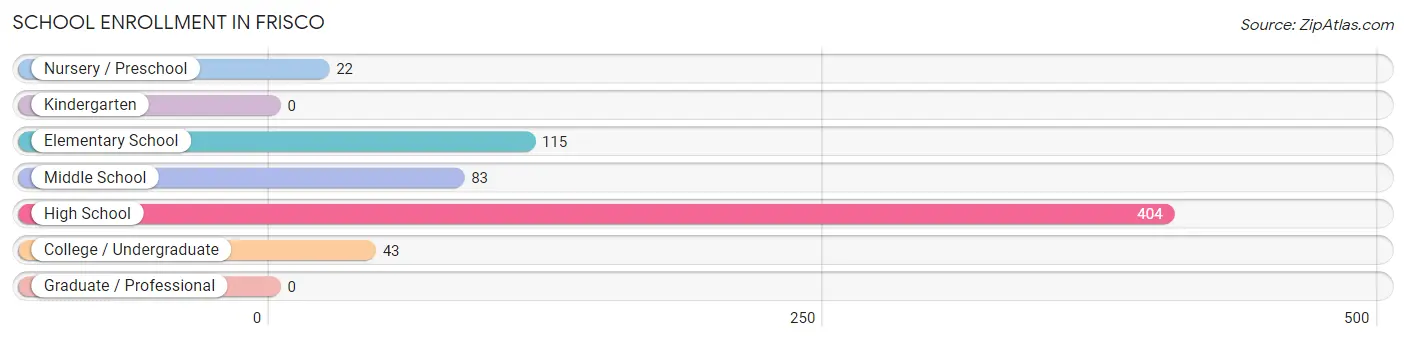
| School Level | # Students | % Students |
| Nursery / Preschool | 22 | 3.3% |
| Kindergarten | 0 | 0.0% |
| Elementary School | 115 | 17.2% |
| Middle School | 83 | 12.4% |
| High School | 404 | 60.6% |
| College / Undergraduate | 43 | 6.5% |
| Graduate / Professional | 0 | 0.0% |
| Total | 667 | 100.0% |
School Enrollment by Age by Funding Source in Frisco
Out of a total of 667 students who are enrolled in schools in Frisco, 66 (9.9%) attend a private institution, while the remaining 601 (90.1%) are enrolled in public schools. The age group of 10 to 14 year olds has the highest likelihood of being enrolled in private schools, with 33 (25.2% in the age bracket) enrolled. Conversely, the age group of 5 to 9 year old has the lowest likelihood of being enrolled in a private school, with 137 (100.0% in the age bracket) attending a public institution.
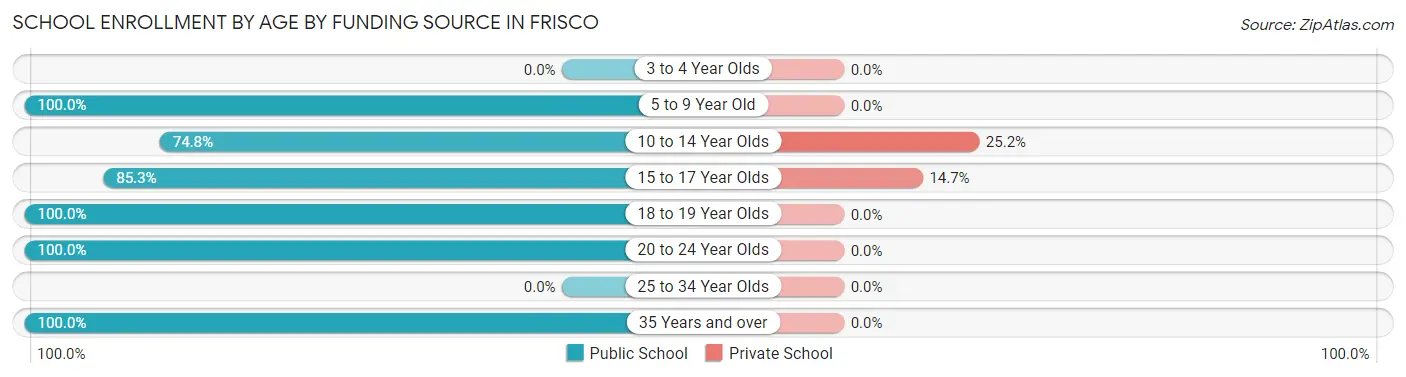
| Age Bracket | Public School | Private School |
| 3 to 4 Year Olds | 0 (0.0%) | 0 (0.0%) |
| 5 to 9 Year Old | 137 (100.0%) | 0 (0.0%) |
| 10 to 14 Year Olds | 98 (74.8%) | 33 (25.2%) |
| 15 to 17 Year Olds | 192 (85.3%) | 33 (14.7%) |
| 18 to 19 Year Olds | 131 (100.0%) | 0 (0.0%) |
| 20 to 24 Year Olds | 19 (100.0%) | 0 (0.0%) |
| 25 to 34 Year Olds | 0 (0.0%) | 0 (0.0%) |
| 35 Years and over | 24 (100.0%) | 0 (0.0%) |
| Total | 601 (90.1%) | 66 (9.9%) |
Educational Attainment by Field of Study in Frisco
Business (614 | 38.2%), education (149 | 9.3%), science & technology (123 | 7.7%), physical & health sciences (121 | 7.5%), and social sciences (112 | 7.0%) are the most common fields of study among 1,606 individuals in Frisco who have obtained a bachelor's degree or higher.
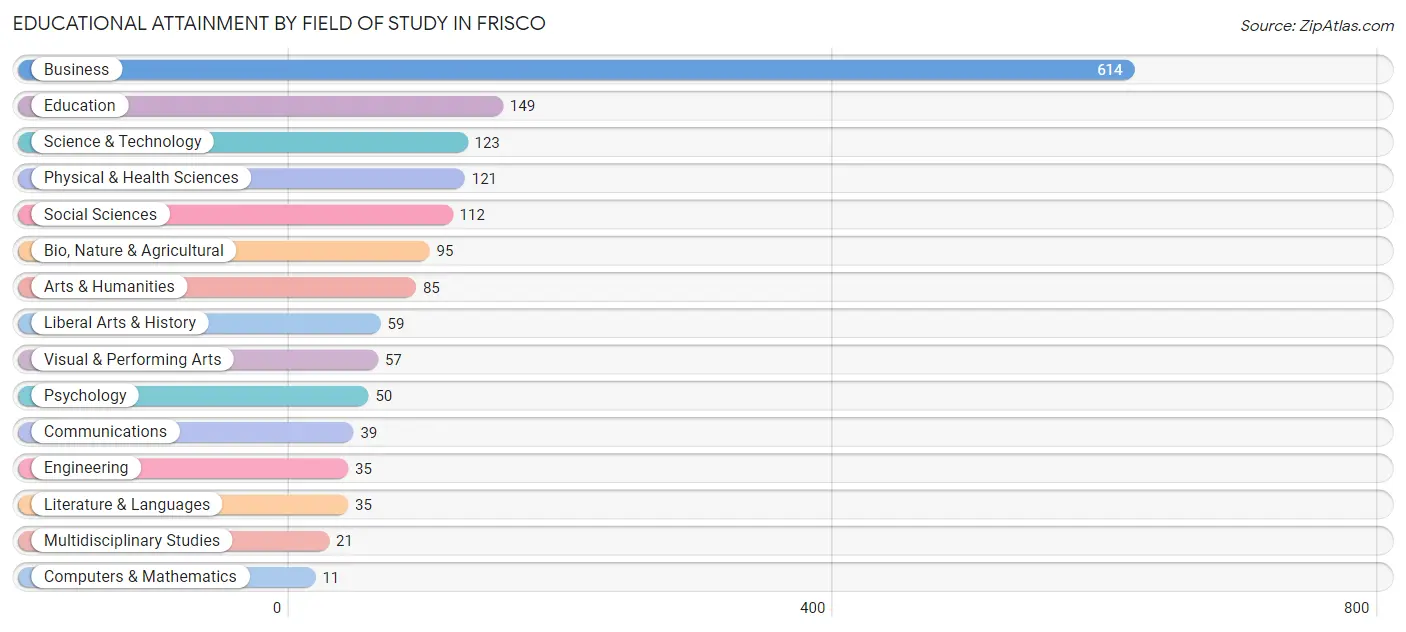
| Field of Study | # Graduates | % Graduates |
| Computers & Mathematics | 11 | 0.7% |
| Bio, Nature & Agricultural | 95 | 5.9% |
| Physical & Health Sciences | 121 | 7.5% |
| Psychology | 50 | 3.1% |
| Social Sciences | 112 | 7.0% |
| Engineering | 35 | 2.2% |
| Multidisciplinary Studies | 21 | 1.3% |
| Science & Technology | 123 | 7.7% |
| Business | 614 | 38.2% |
| Education | 149 | 9.3% |
| Literature & Languages | 35 | 2.2% |
| Liberal Arts & History | 59 | 3.7% |
| Visual & Performing Arts | 57 | 3.5% |
| Communications | 39 | 2.4% |
| Arts & Humanities | 85 | 5.3% |
| Total | 1,606 | 100.0% |
Transportation & Commute in Frisco
Vehicle Availability by Sex in Frisco
The most prevalent vehicle ownership categories in Frisco are males with 2 vehicles (511, accounting for 56.3%) and females with 2 vehicles (511, making up 67.1%).
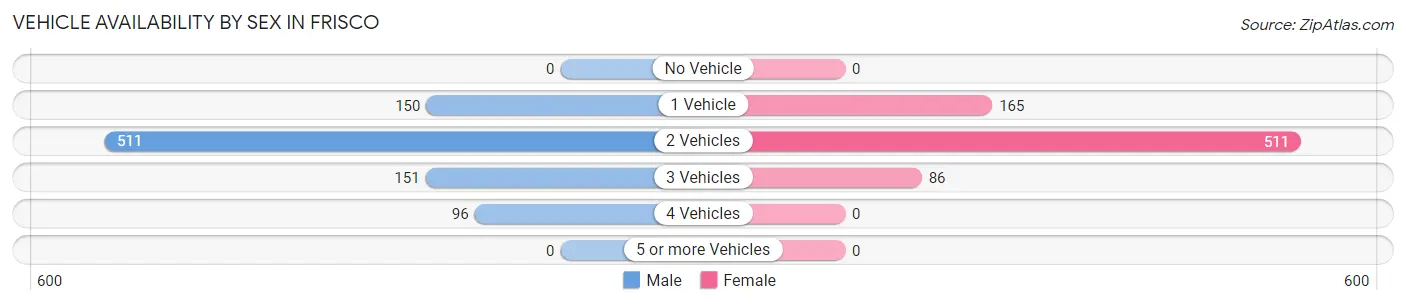
| Vehicles Available | Male | Female |
| No Vehicle | 0 (0.0%) | 0 (0.0%) |
| 1 Vehicle | 150 (16.5%) | 165 (21.6%) |
| 2 Vehicles | 511 (56.3%) | 511 (67.1%) |
| 3 Vehicles | 151 (16.6%) | 86 (11.3%) |
| 4 Vehicles | 96 (10.6%) | 0 (0.0%) |
| 5 or more Vehicles | 0 (0.0%) | 0 (0.0%) |
| Total | 908 (100.0%) | 762 (100.0%) |
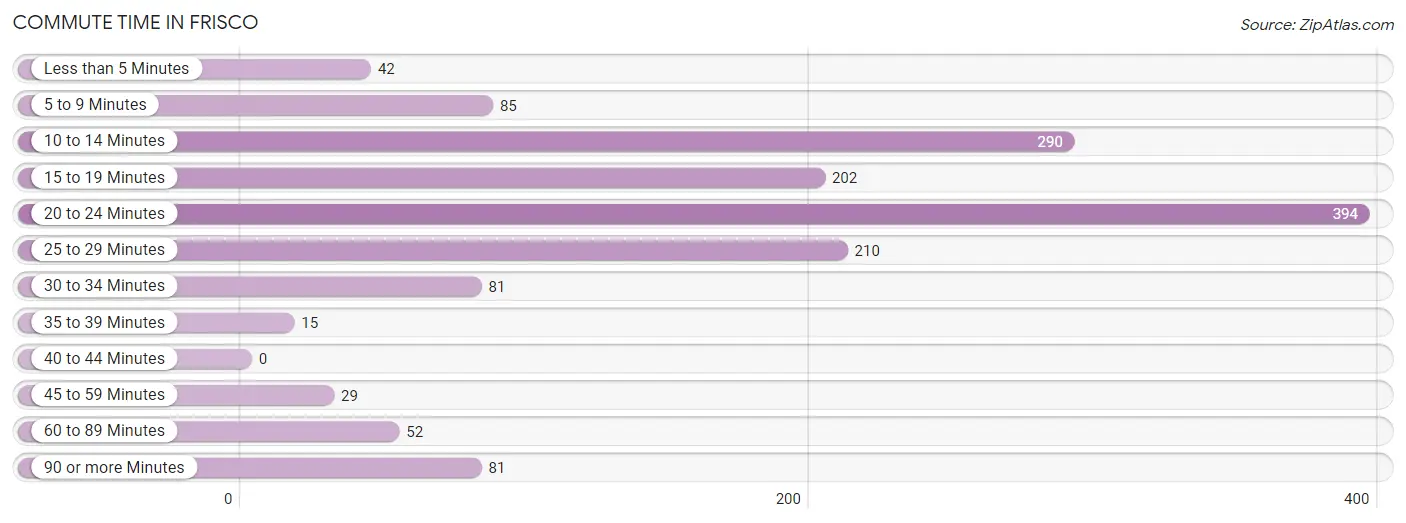
Commute Time in Frisco
The most frequently occuring commute durations in Frisco are 20 to 24 minutes (394 commuters, 26.6%), 10 to 14 minutes (290 commuters, 19.6%), and 25 to 29 minutes (210 commuters, 14.2%).
| Commute Time | # Commuters | % Commuters |
| Less than 5 Minutes | 42 | 2.8% |
| 5 to 9 Minutes | 85 | 5.7% |
| 10 to 14 Minutes | 290 | 19.6% |
| 15 to 19 Minutes | 202 | 13.6% |
| 20 to 24 Minutes | 394 | 26.6% |
| 25 to 29 Minutes | 210 | 14.2% |
| 30 to 34 Minutes | 81 | 5.5% |
| 35 to 39 Minutes | 15 | 1.0% |
| 40 to 44 Minutes | 0 | 0.0% |
| 45 to 59 Minutes | 29 | 2.0% |
| 60 to 89 Minutes | 52 | 3.5% |
| 90 or more Minutes | 81 | 5.5% |
Commute Time by Sex in Frisco
The most common commute times in Frisco are 20 to 24 minutes (173 commuters, 24.1%) for males and 20 to 24 minutes (221 commuters, 29.0%) for females.
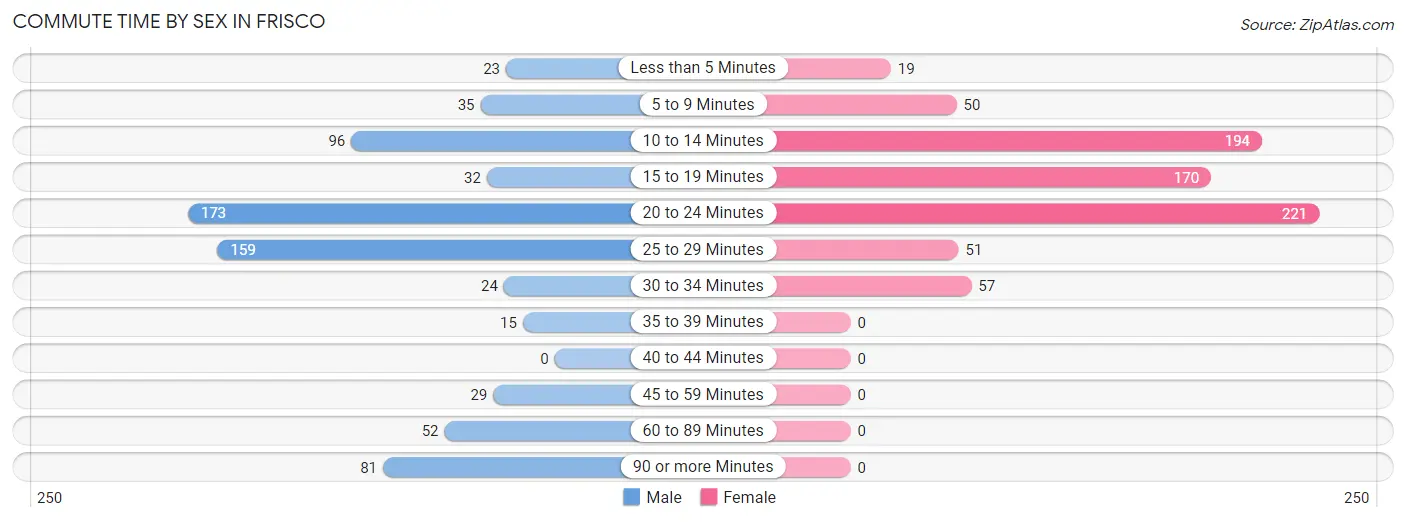
| Commute Time | Male | Female |
| Less than 5 Minutes | 23 (3.2%) | 19 (2.5%) |
| 5 to 9 Minutes | 35 (4.9%) | 50 (6.6%) |
| 10 to 14 Minutes | 96 (13.4%) | 194 (25.5%) |
| 15 to 19 Minutes | 32 (4.4%) | 170 (22.3%) |
| 20 to 24 Minutes | 173 (24.1%) | 221 (29.0%) |
| 25 to 29 Minutes | 159 (22.1%) | 51 (6.7%) |
| 30 to 34 Minutes | 24 (3.3%) | 57 (7.5%) |
| 35 to 39 Minutes | 15 (2.1%) | 0 (0.0%) |
| 40 to 44 Minutes | 0 (0.0%) | 0 (0.0%) |
| 45 to 59 Minutes | 29 (4.0%) | 0 (0.0%) |
| 60 to 89 Minutes | 52 (7.2%) | 0 (0.0%) |
| 90 or more Minutes | 81 (11.3%) | 0 (0.0%) |
Time of Departure to Work by Sex in Frisco
The most frequent times of departure to work in Frisco are 12:00 AM to 4:59 AM (192, 26.7%) for males and 9:00 AM to 9:59 AM (186, 24.4%) for females.
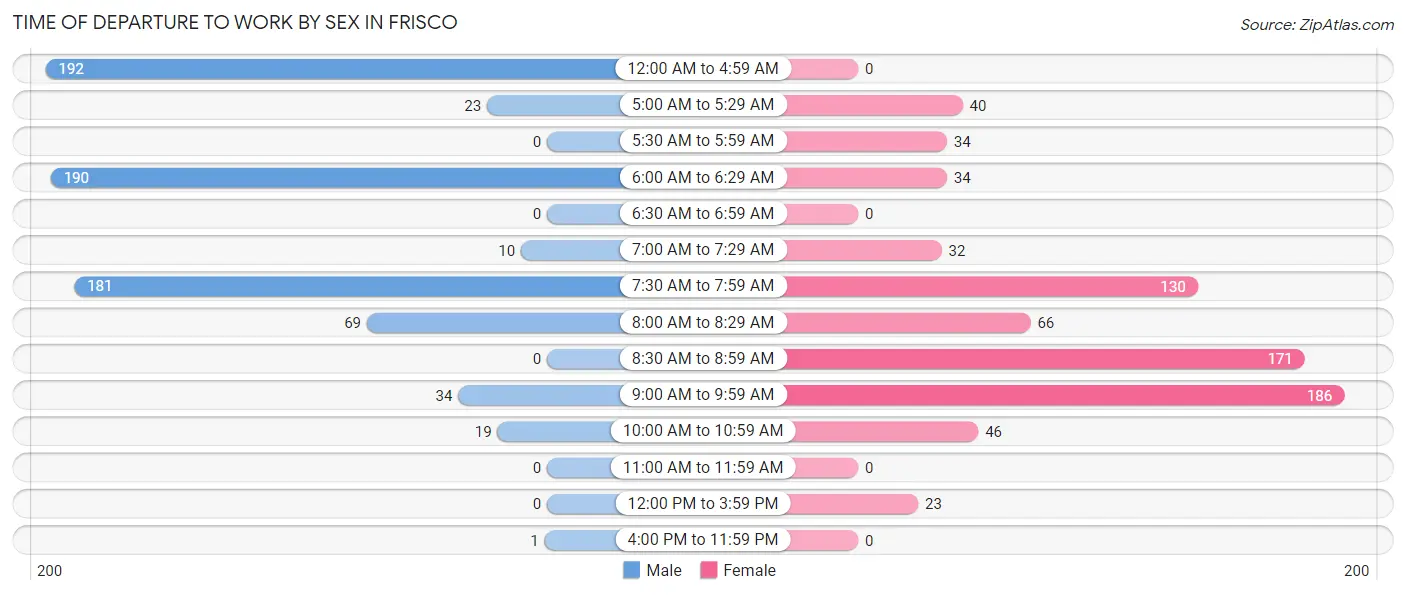
| Time of Departure | Male | Female |
| 12:00 AM to 4:59 AM | 192 (26.7%) | 0 (0.0%) |
| 5:00 AM to 5:29 AM | 23 (3.2%) | 40 (5.2%) |
| 5:30 AM to 5:59 AM | 0 (0.0%) | 34 (4.5%) |
| 6:00 AM to 6:29 AM | 190 (26.4%) | 34 (4.5%) |
| 6:30 AM to 6:59 AM | 0 (0.0%) | 0 (0.0%) |
| 7:00 AM to 7:29 AM | 10 (1.4%) | 32 (4.2%) |
| 7:30 AM to 7:59 AM | 181 (25.2%) | 130 (17.1%) |
| 8:00 AM to 8:29 AM | 69 (9.6%) | 66 (8.7%) |
| 8:30 AM to 8:59 AM | 0 (0.0%) | 171 (22.4%) |
| 9:00 AM to 9:59 AM | 34 (4.7%) | 186 (24.4%) |
| 10:00 AM to 10:59 AM | 19 (2.6%) | 46 (6.0%) |
| 11:00 AM to 11:59 AM | 0 (0.0%) | 0 (0.0%) |
| 12:00 PM to 3:59 PM | 0 (0.0%) | 23 (3.0%) |
| 4:00 PM to 11:59 PM | 1 (0.1%) | 0 (0.0%) |
| Total | 719 (100.0%) | 762 (100.0%) |
Housing Occupancy in Frisco
Occupancy by Ownership in Frisco
Of the total 1,308 dwellings in Frisco, owner-occupied units account for 705 (53.9%), while renter-occupied units make up 603 (46.1%).
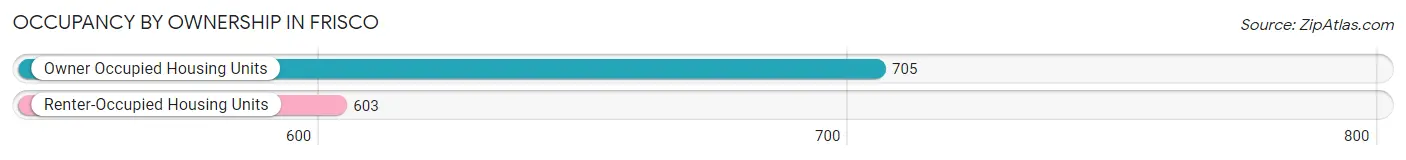
| Occupancy | # Housing Units | % Housing Units |
| Owner Occupied Housing Units | 705 | 53.9% |
| Renter-Occupied Housing Units | 603 | 46.1% |
| Total Occupied Housing Units | 1,308 | 100.0% |
Occupancy by Household Size in Frisco
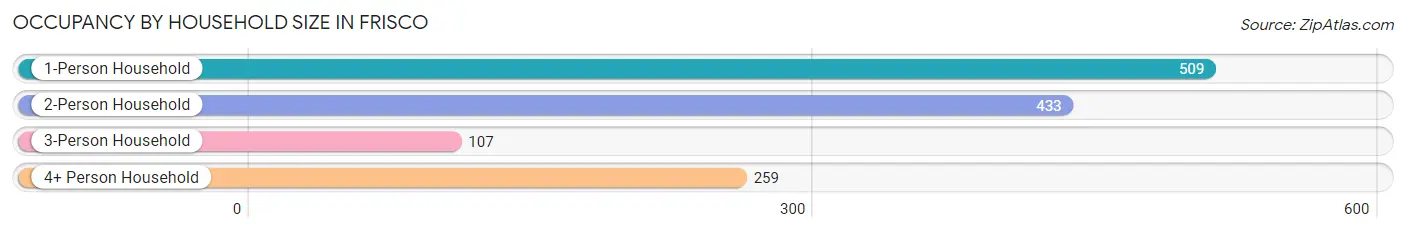
| Household Size | # Housing Units | % Housing Units |
| 1-Person Household | 509 | 38.9% |
| 2-Person Household | 433 | 33.1% |
| 3-Person Household | 107 | 8.2% |
| 4+ Person Household | 259 | 19.8% |
| Total Housing Units | 1,308 | 100.0% |
Occupancy by Ownership by Household Size in Frisco
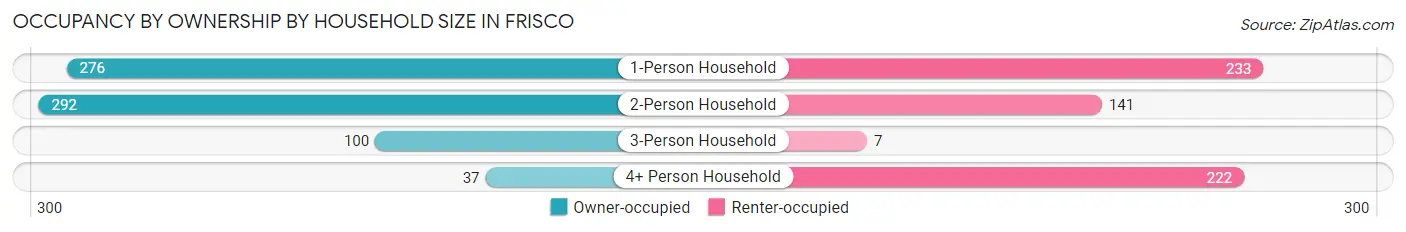
| Household Size | Owner-occupied | Renter-occupied |
| 1-Person Household | 276 (54.2%) | 233 (45.8%) |
| 2-Person Household | 292 (67.4%) | 141 (32.6%) |
| 3-Person Household | 100 (93.5%) | 7 (6.5%) |
| 4+ Person Household | 37 (14.3%) | 222 (85.7%) |
| Total Housing Units | 705 (53.9%) | 603 (46.1%) |
Occupancy by Educational Attainment in Frisco
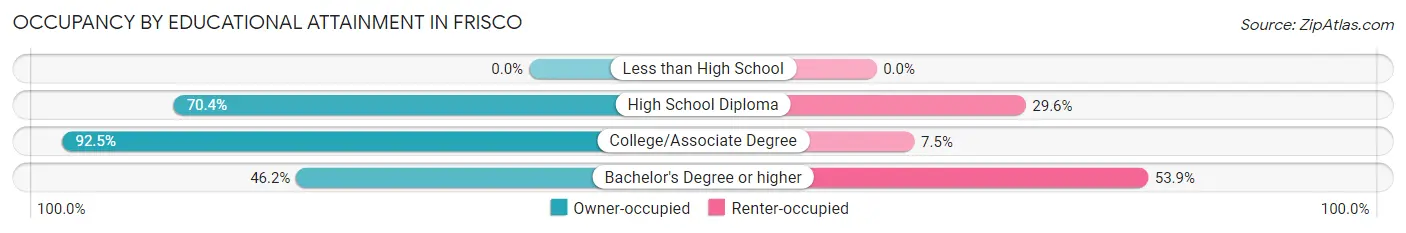
| Household Size | Owner-occupied | Renter-occupied |
| Less than High School | 0 (0.0%) | 0 (0.0%) |
| High School Diploma | 169 (70.4%) | 71 (29.6%) |
| College/Associate Degree | 86 (92.5%) | 7 (7.5%) |
| Bachelor's Degree or higher | 450 (46.2%) | 525 (53.8%) |
Occupancy by Age of Householder in Frisco
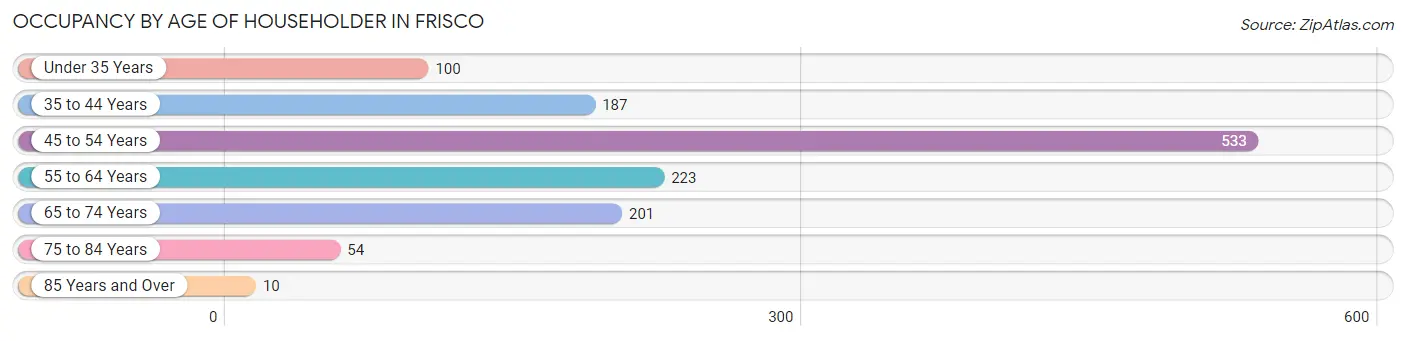
| Age Bracket | # Households | % Households |
| Under 35 Years | 100 | 7.6% |
| 35 to 44 Years | 187 | 14.3% |
| 45 to 54 Years | 533 | 40.7% |
| 55 to 64 Years | 223 | 17.1% |
| 65 to 74 Years | 201 | 15.4% |
| 75 to 84 Years | 54 | 4.1% |
| 85 Years and Over | 10 | 0.8% |
| Total | 1,308 | 100.0% |
Housing Finances in Frisco
Median Income by Occupancy in Frisco
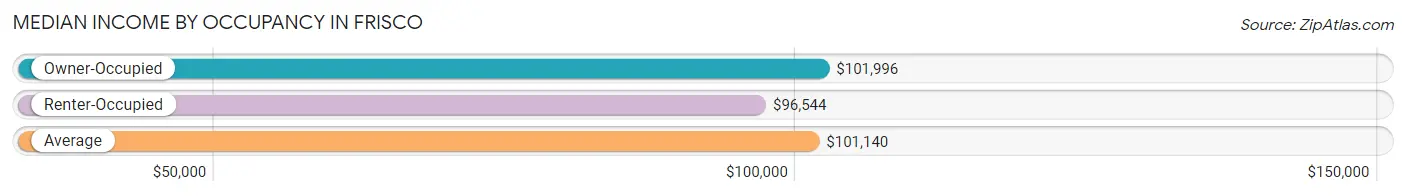
| Occupancy Type | # Households | Median Income |
| Owner-Occupied | 705 (53.9%) | $101,996 |
| Renter-Occupied | 603 (46.1%) | $96,544 |
| Average | 1,308 (100.0%) | $101,140 |
Occupancy by Householder Income Bracket in Frisco
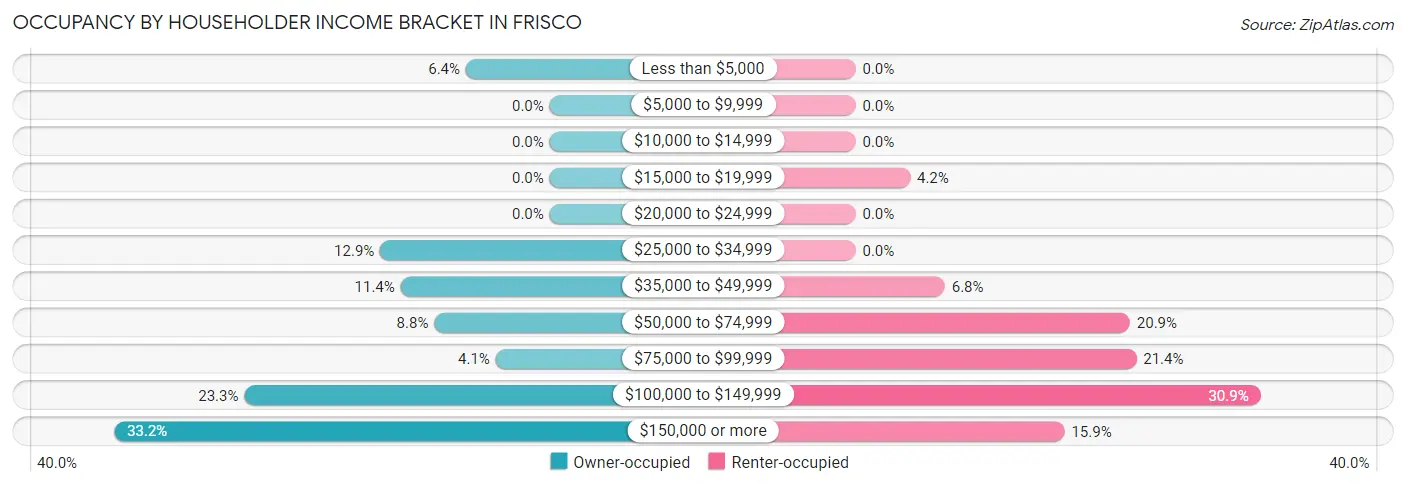
| Income Bracket | Owner-occupied | Renter-occupied |
| Less than $5,000 | 45 (6.4%) | 0 (0.0%) |
| $5,000 to $9,999 | 0 (0.0%) | 0 (0.0%) |
| $10,000 to $14,999 | 0 (0.0%) | 0 (0.0%) |
| $15,000 to $19,999 | 0 (0.0%) | 25 (4.2%) |
| $20,000 to $24,999 | 0 (0.0%) | 0 (0.0%) |
| $25,000 to $34,999 | 91 (12.9%) | 0 (0.0%) |
| $35,000 to $49,999 | 80 (11.4%) | 41 (6.8%) |
| $50,000 to $74,999 | 62 (8.8%) | 126 (20.9%) |
| $75,000 to $99,999 | 29 (4.1%) | 129 (21.4%) |
| $100,000 to $149,999 | 164 (23.3%) | 186 (30.8%) |
| $150,000 or more | 234 (33.2%) | 96 (15.9%) |
| Total | 705 (100.0%) | 603 (100.0%) |
Monthly Housing Cost Tiers in Frisco
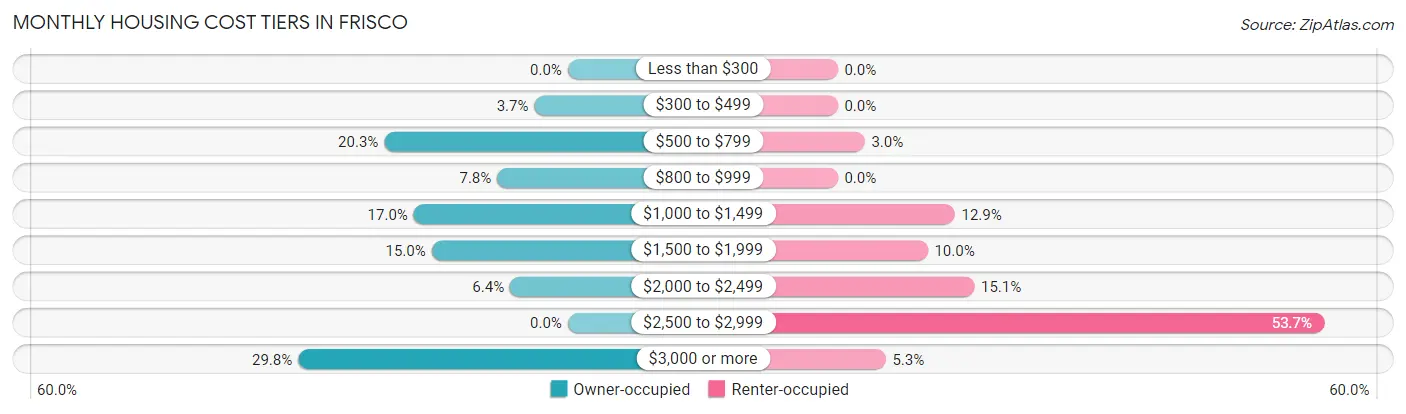
| Monthly Cost | Owner-occupied | Renter-occupied |
| Less than $300 | 0 (0.0%) | 0 (0.0%) |
| $300 to $499 | 26 (3.7%) | 0 (0.0%) |
| $500 to $799 | 143 (20.3%) | 18 (3.0%) |
| $800 to $999 | 55 (7.8%) | 0 (0.0%) |
| $1,000 to $1,499 | 120 (17.0%) | 78 (12.9%) |
| $1,500 to $1,999 | 106 (15.0%) | 60 (10.0%) |
| $2,000 to $2,499 | 45 (6.4%) | 91 (15.1%) |
| $2,500 to $2,999 | 0 (0.0%) | 324 (53.7%) |
| $3,000 or more | 210 (29.8%) | 32 (5.3%) |
| Total | 705 (100.0%) | 603 (100.0%) |
Physical Housing Characteristics in Frisco
Housing Structures in Frisco
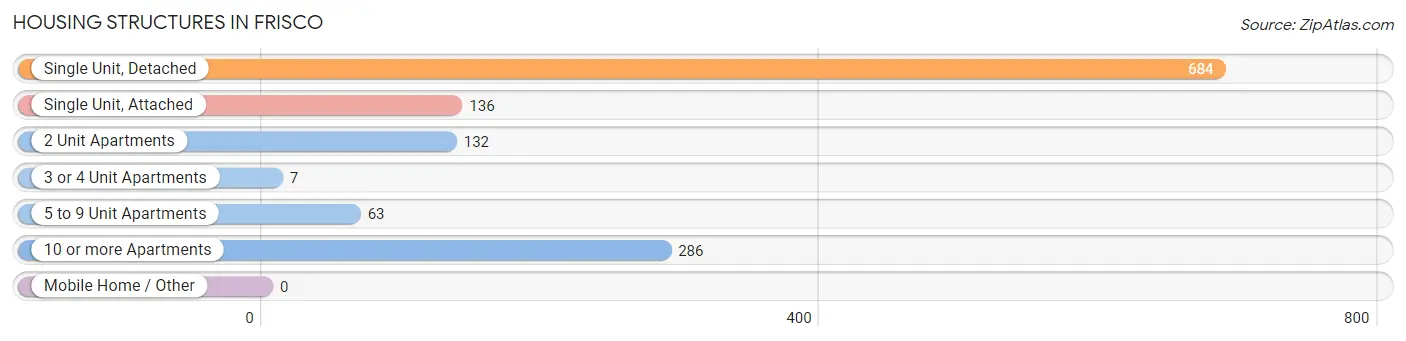
| Structure Type | # Housing Units | % Housing Units |
| Single Unit, Detached | 684 | 52.3% |
| Single Unit, Attached | 136 | 10.4% |
| 2 Unit Apartments | 132 | 10.1% |
| 3 or 4 Unit Apartments | 7 | 0.5% |
| 5 to 9 Unit Apartments | 63 | 4.8% |
| 10 or more Apartments | 286 | 21.9% |
| Mobile Home / Other | 0 | 0.0% |
| Total | 1,308 | 100.0% |
Housing Structures by Occupancy in Frisco
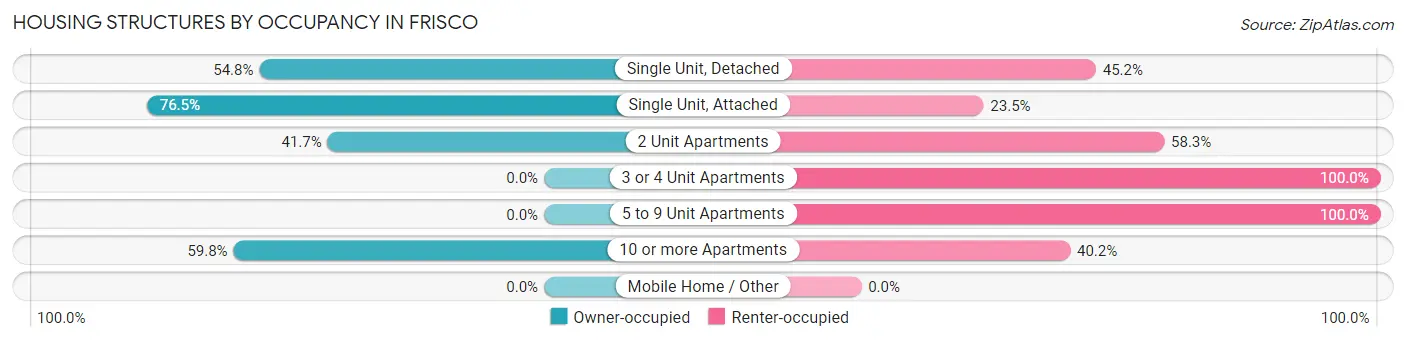
| Structure Type | Owner-occupied | Renter-occupied |
| Single Unit, Detached | 375 (54.8%) | 309 (45.2%) |
| Single Unit, Attached | 104 (76.5%) | 32 (23.5%) |
| 2 Unit Apartments | 55 (41.7%) | 77 (58.3%) |
| 3 or 4 Unit Apartments | 0 (0.0%) | 7 (100.0%) |
| 5 to 9 Unit Apartments | 0 (0.0%) | 63 (100.0%) |
| 10 or more Apartments | 171 (59.8%) | 115 (40.2%) |
| Mobile Home / Other | 0 (0.0%) | 0 (0.0%) |
| Total | 705 (53.9%) | 603 (46.1%) |
Housing Structures by Number of Rooms in Frisco
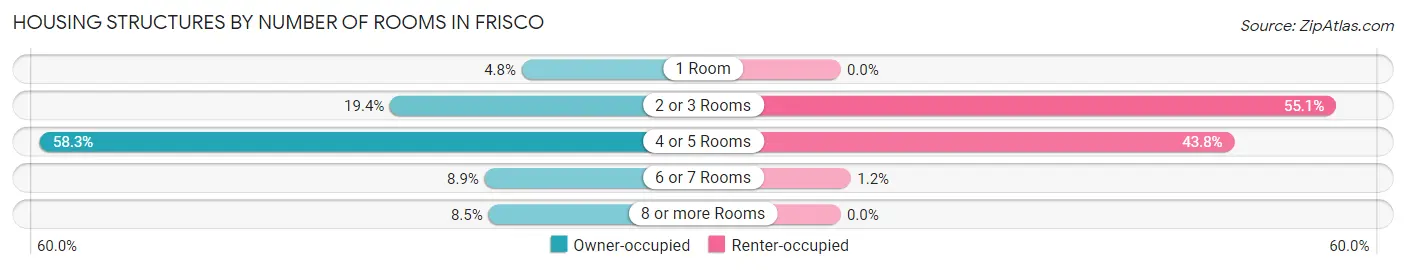
| Number of Rooms | Owner-occupied | Renter-occupied |
| 1 Room | 34 (4.8%) | 0 (0.0%) |
| 2 or 3 Rooms | 137 (19.4%) | 332 (55.1%) |
| 4 or 5 Rooms | 411 (58.3%) | 264 (43.8%) |
| 6 or 7 Rooms | 63 (8.9%) | 7 (1.2%) |
| 8 or more Rooms | 60 (8.5%) | 0 (0.0%) |
| Total | 705 (100.0%) | 603 (100.0%) |
Housing Structure by Heating Type in Frisco
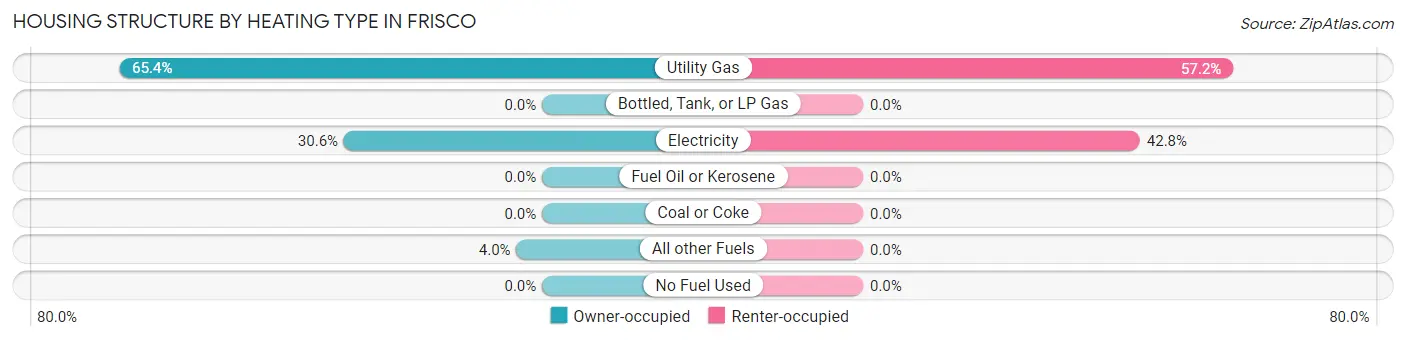
| Heating Type | Owner-occupied | Renter-occupied |
| Utility Gas | 461 (65.4%) | 345 (57.2%) |
| Bottled, Tank, or LP Gas | 0 (0.0%) | 0 (0.0%) |
| Electricity | 216 (30.6%) | 258 (42.8%) |
| Fuel Oil or Kerosene | 0 (0.0%) | 0 (0.0%) |
| Coal or Coke | 0 (0.0%) | 0 (0.0%) |
| All other Fuels | 28 (4.0%) | 0 (0.0%) |
| No Fuel Used | 0 (0.0%) | 0 (0.0%) |
| Total | 705 (100.0%) | 603 (100.0%) |
Household Vehicle Usage in Frisco
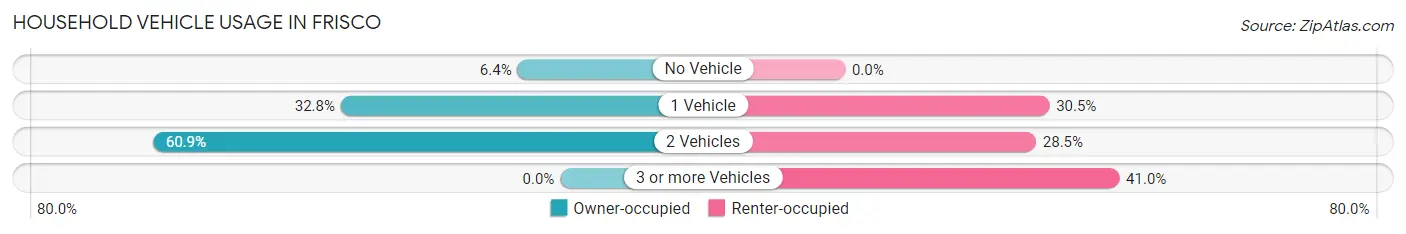
| Vehicles per Household | Owner-occupied | Renter-occupied |
| No Vehicle | 45 (6.4%) | 0 (0.0%) |
| 1 Vehicle | 231 (32.8%) | 184 (30.5%) |
| 2 Vehicles | 429 (60.9%) | 172 (28.5%) |
| 3 or more Vehicles | 0 (0.0%) | 247 (41.0%) |
| Total | 705 (100.0%) | 603 (100.0%) |
Real Estate & Mortgages in Frisco
Real Estate and Mortgage Overview in Frisco
| Characteristic | Without Mortgage | With Mortgage |
| Housing Units | 249 | 456 |
| Median Property Value | $745,100 | $667,900 |
| Median Household Income | $100,768 | $174 |
| Monthly Housing Costs | $613 | $210 |
| Real Estate Taxes | $2,690 | $0 |
Property Value by Mortgage Status in Frisco
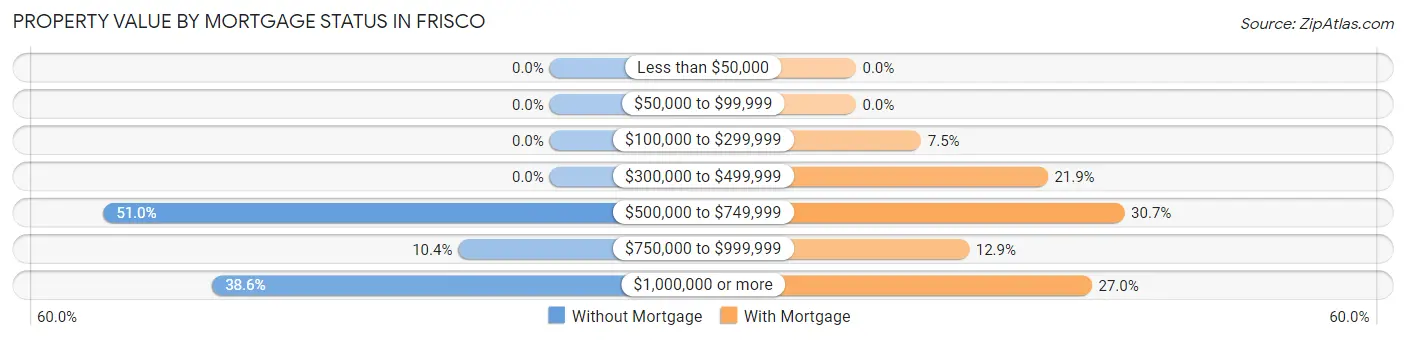
| Property Value | Without Mortgage | With Mortgage |
| Less than $50,000 | 0 (0.0%) | 0 (0.0%) |
| $50,000 to $99,999 | 0 (0.0%) | 0 (0.0%) |
| $100,000 to $299,999 | 0 (0.0%) | 34 (7.5%) |
| $300,000 to $499,999 | 0 (0.0%) | 100 (21.9%) |
| $500,000 to $749,999 | 127 (51.0%) | 140 (30.7%) |
| $750,000 to $999,999 | 26 (10.4%) | 59 (12.9%) |
| $1,000,000 or more | 96 (38.6%) | 123 (27.0%) |
| Total | 249 (100.0%) | 456 (100.0%) |
Household Income by Mortgage Status in Frisco
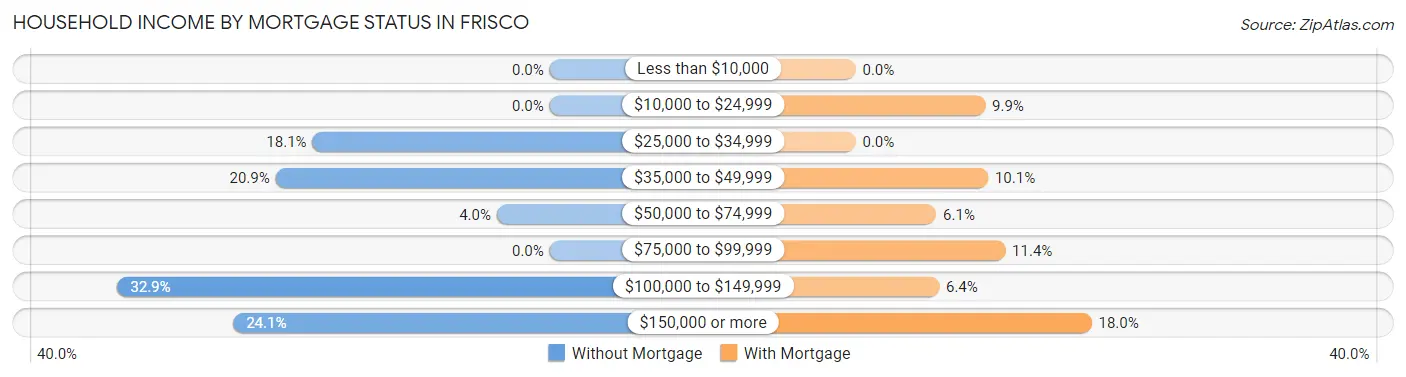
| Household Income | Without Mortgage | With Mortgage |
| Less than $10,000 | 0 (0.0%) | 0 (0.0%) |
| $10,000 to $24,999 | 0 (0.0%) | 45 (9.9%) |
| $25,000 to $34,999 | 45 (18.1%) | 0 (0.0%) |
| $35,000 to $49,999 | 52 (20.9%) | 46 (10.1%) |
| $50,000 to $74,999 | 10 (4.0%) | 28 (6.1%) |
| $75,000 to $99,999 | 0 (0.0%) | 52 (11.4%) |
| $100,000 to $149,999 | 82 (32.9%) | 29 (6.4%) |
| $150,000 or more | 60 (24.1%) | 82 (18.0%) |
| Total | 249 (100.0%) | 456 (100.0%) |
Property Value to Household Income Ratio in Frisco
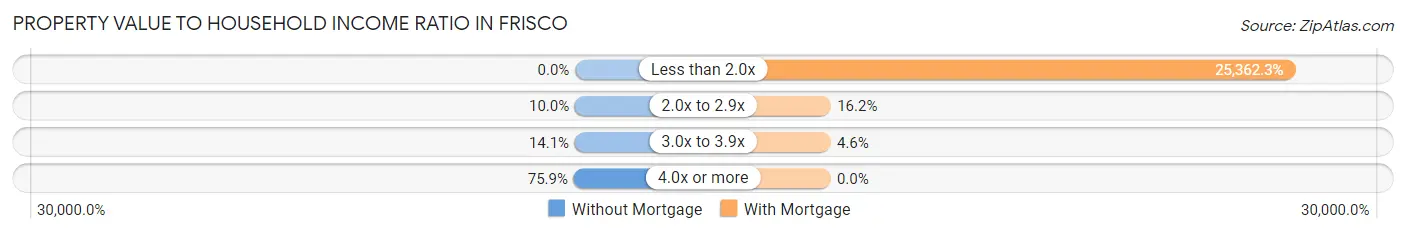
| Value-to-Income Ratio | Without Mortgage | With Mortgage |
| Less than 2.0x | 0 (0.0%) | 115,652 (25,362.3%) |
| 2.0x to 2.9x | 25 (10.0%) | 74 (16.2%) |
| 3.0x to 3.9x | 35 (14.1%) | 21 (4.6%) |
| 4.0x or more | 189 (75.9%) | 0 (0.0%) |
| Total | 249 (100.0%) | 456 (100.0%) |
Real Estate Taxes by Mortgage Status in Frisco
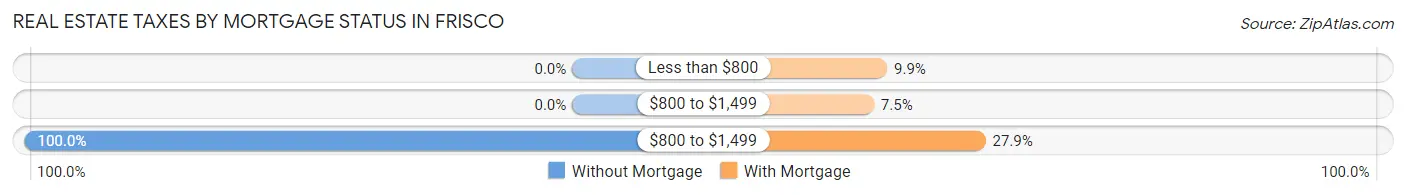
| Property Taxes | Without Mortgage | With Mortgage |
| Less than $800 | 0 (0.0%) | 45 (9.9%) |
| $800 to $1,499 | 0 (0.0%) | 34 (7.5%) |
| $800 to $1,499 | 249 (100.0%) | 127 (27.9%) |
| Total | 249 (100.0%) | 456 (100.0%) |
Health & Disability in Frisco
Health Insurance Coverage by Age in Frisco
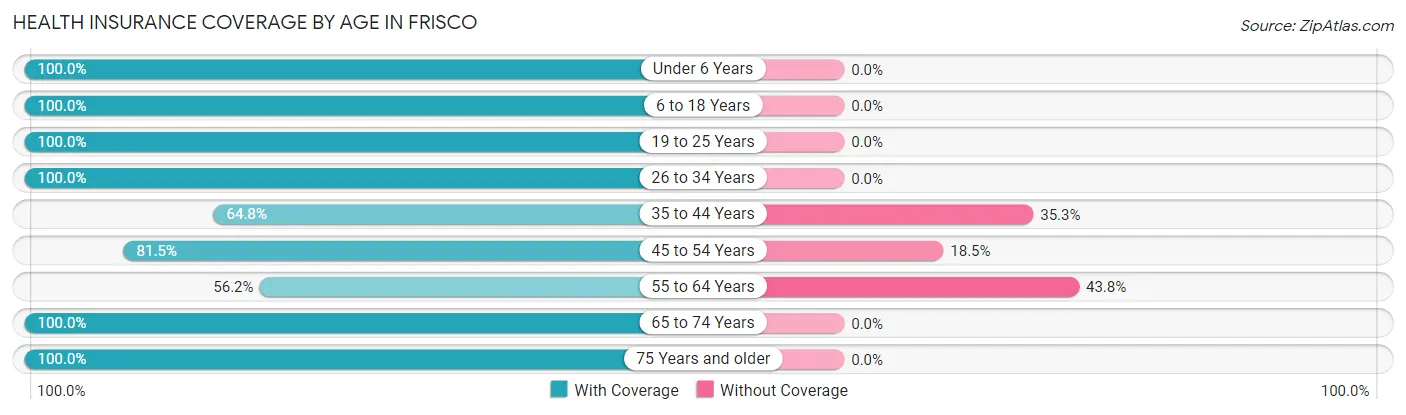
| Age Bracket | With Coverage | Without Coverage |
| Under 6 Years | 22 (100.0%) | 0 (0.0%) |
| 6 to 18 Years | 602 (100.0%) | 0 (0.0%) |
| 19 to 25 Years | 20 (100.0%) | 0 (0.0%) |
| 26 to 34 Years | 381 (100.0%) | 0 (0.0%) |
| 35 to 44 Years | 292 (64.7%) | 159 (35.2%) |
| 45 to 54 Years | 618 (81.5%) | 140 (18.5%) |
| 55 to 64 Years | 131 (56.2%) | 102 (43.8%) |
| 65 to 74 Years | 290 (100.0%) | 0 (0.0%) |
| 75 Years and older | 143 (100.0%) | 0 (0.0%) |
| Total | 2,499 (86.2%) | 401 (13.8%) |
Health Insurance Coverage by Citizenship Status in Frisco
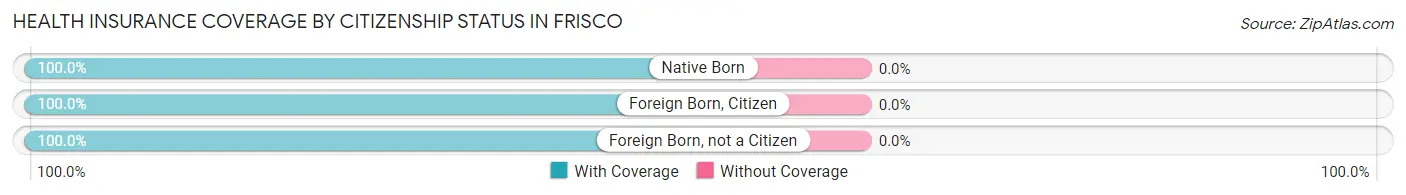
| Citizenship Status | With Coverage | Without Coverage |
| Native Born | 22 (100.0%) | 0 (0.0%) |
| Foreign Born, Citizen | 602 (100.0%) | 0 (0.0%) |
| Foreign Born, not a Citizen | 20 (100.0%) | 0 (0.0%) |
Health Insurance Coverage by Household Income in Frisco
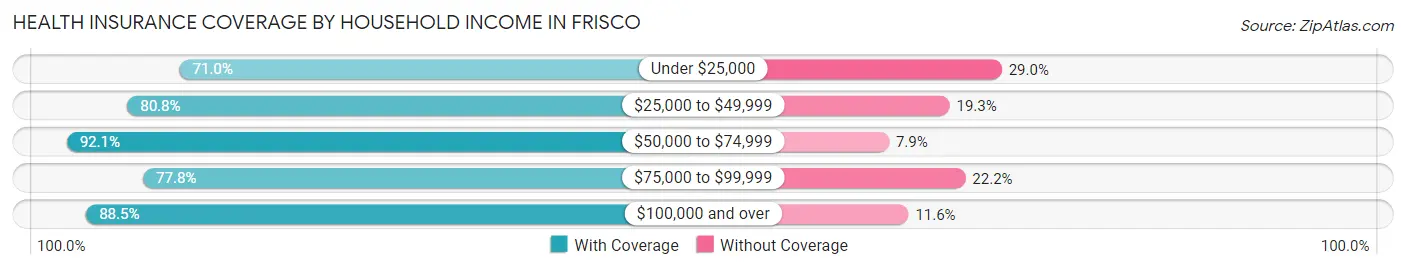
| Household Income | With Coverage | Without Coverage |
| Under $25,000 | 110 (71.0%) | 45 (29.0%) |
| $25,000 to $49,999 | 193 (80.7%) | 46 (19.3%) |
| $50,000 to $74,999 | 303 (92.1%) | 26 (7.9%) |
| $75,000 to $99,999 | 238 (77.8%) | 68 (22.2%) |
| $100,000 and over | 1,654 (88.4%) | 216 (11.6%) |
Public vs Private Health Insurance Coverage by Age in Frisco
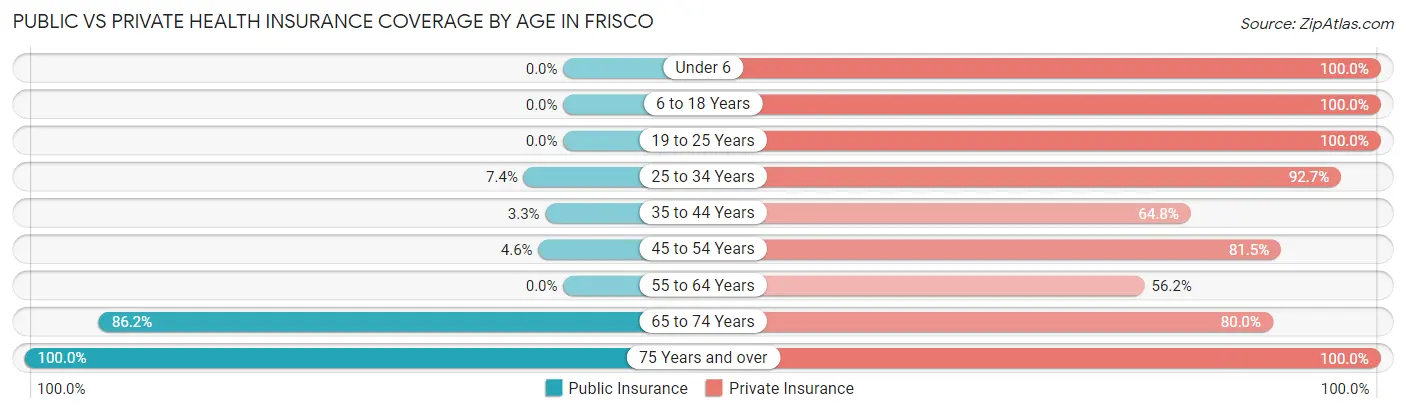
| Age Bracket | Public Insurance | Private Insurance |
| Under 6 | 0 (0.0%) | 22 (100.0%) |
| 6 to 18 Years | 0 (0.0%) | 602 (100.0%) |
| 19 to 25 Years | 0 (0.0%) | 20 (100.0%) |
| 25 to 34 Years | 28 (7.3%) | 353 (92.6%) |
| 35 to 44 Years | 15 (3.3%) | 292 (64.7%) |
| 45 to 54 Years | 35 (4.6%) | 618 (81.5%) |
| 55 to 64 Years | 0 (0.0%) | 131 (56.2%) |
| 65 to 74 Years | 250 (86.2%) | 232 (80.0%) |
| 75 Years and over | 143 (100.0%) | 143 (100.0%) |
| Total | 471 (16.2%) | 2,413 (83.2%) |
Disability Status by Sex by Age in Frisco
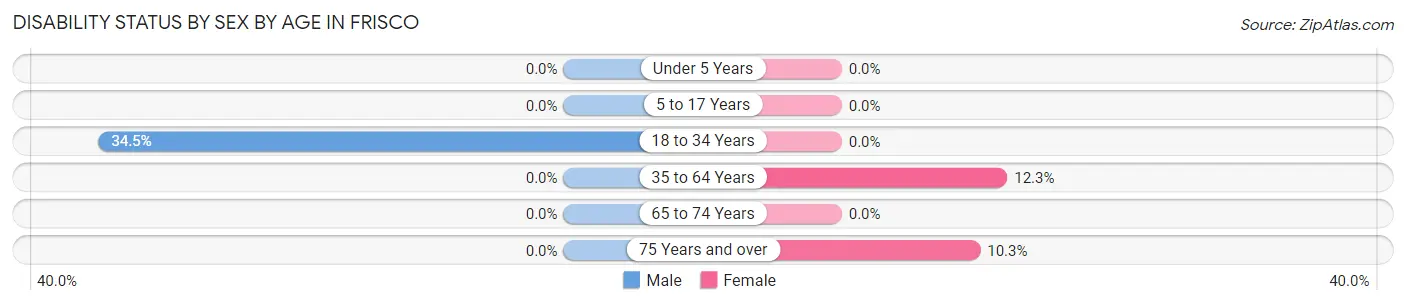
| Age Bracket | Male | Female |
| Under 5 Years | 0 (0.0%) | 0 (0.0%) |
| 5 to 17 Years | 0 (0.0%) | 0 (0.0%) |
| 18 to 34 Years | 68 (34.5%) | 0 (0.0%) |
| 35 to 64 Years | 0 (0.0%) | 80 (12.3%) |
| 65 to 74 Years | 0 (0.0%) | 0 (0.0%) |
| 75 Years and over | 0 (0.0%) | 11 (10.3%) |
Disability Class by Sex by Age in Frisco
Disability Class: Hearing Difficulty
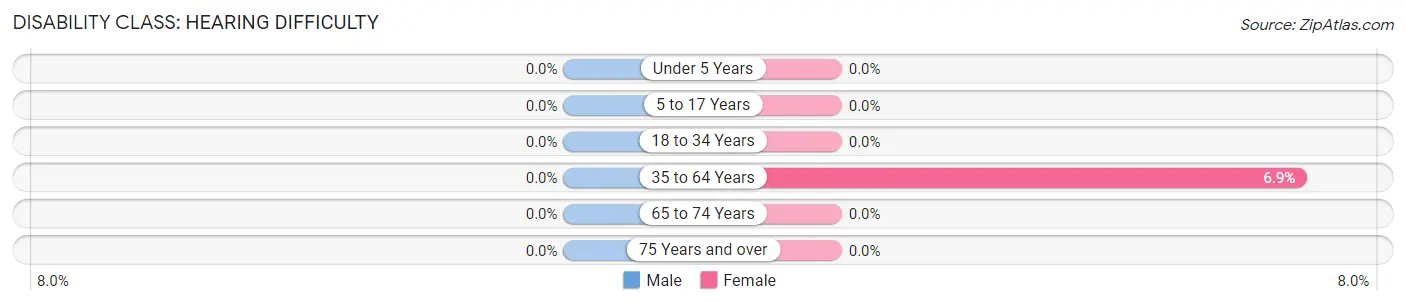
| Age Bracket | Male | Female |
| Under 5 Years | 0 (0.0%) | 0 (0.0%) |
| 5 to 17 Years | 0 (0.0%) | 0 (0.0%) |
| 18 to 34 Years | 0 (0.0%) | 0 (0.0%) |
| 35 to 64 Years | 0 (0.0%) | 45 (6.9%) |
| 65 to 74 Years | 0 (0.0%) | 0 (0.0%) |
| 75 Years and over | 0 (0.0%) | 0 (0.0%) |
Disability Class: Vision Difficulty
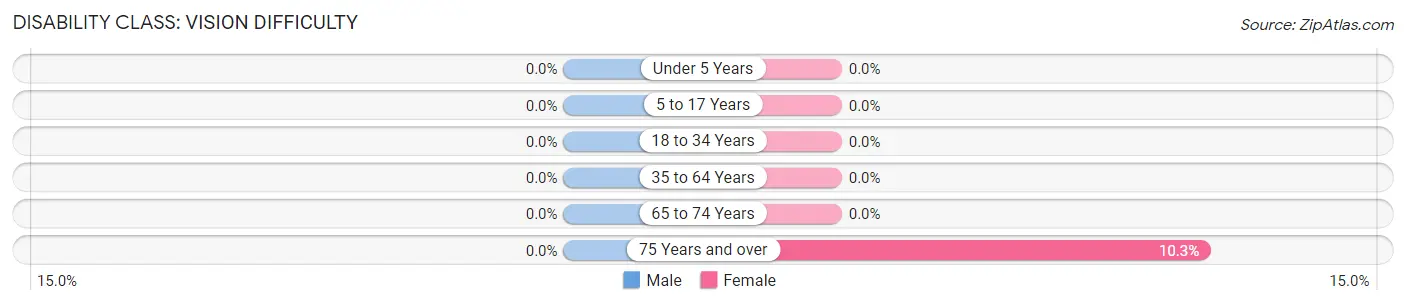
| Age Bracket | Male | Female |
| Under 5 Years | 0 (0.0%) | 0 (0.0%) |
| 5 to 17 Years | 0 (0.0%) | 0 (0.0%) |
| 18 to 34 Years | 0 (0.0%) | 0 (0.0%) |
| 35 to 64 Years | 0 (0.0%) | 0 (0.0%) |
| 65 to 74 Years | 0 (0.0%) | 0 (0.0%) |
| 75 Years and over | 0 (0.0%) | 11 (10.3%) |
Disability Class: Cognitive Difficulty
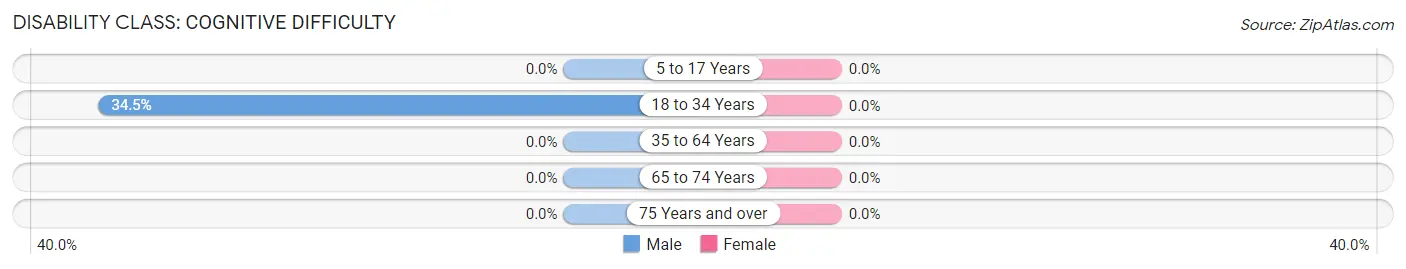
| Age Bracket | Male | Female |
| 5 to 17 Years | 0 (0.0%) | 0 (0.0%) |
| 18 to 34 Years | 68 (34.5%) | 0 (0.0%) |
| 35 to 64 Years | 0 (0.0%) | 0 (0.0%) |
| 65 to 74 Years | 0 (0.0%) | 0 (0.0%) |
| 75 Years and over | 0 (0.0%) | 0 (0.0%) |
Disability Class: Ambulatory Difficulty
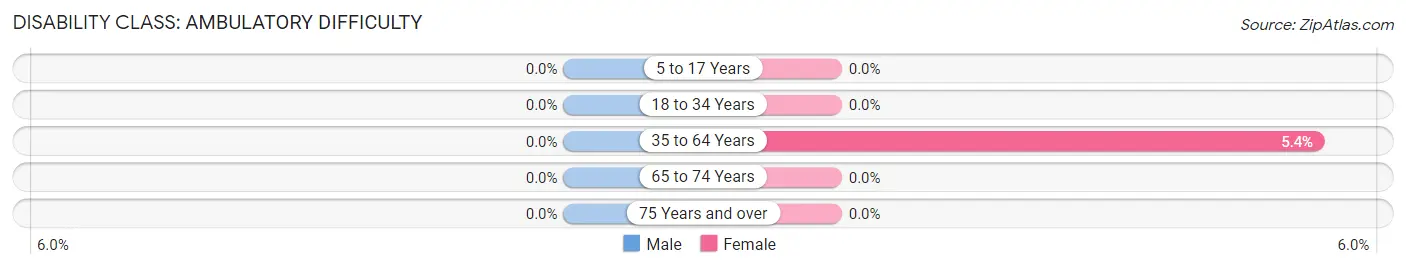
| Age Bracket | Male | Female |
| 5 to 17 Years | 0 (0.0%) | 0 (0.0%) |
| 18 to 34 Years | 0 (0.0%) | 0 (0.0%) |
| 35 to 64 Years | 0 (0.0%) | 35 (5.4%) |
| 65 to 74 Years | 0 (0.0%) | 0 (0.0%) |
| 75 Years and over | 0 (0.0%) | 0 (0.0%) |
Disability Class: Self-Care Difficulty
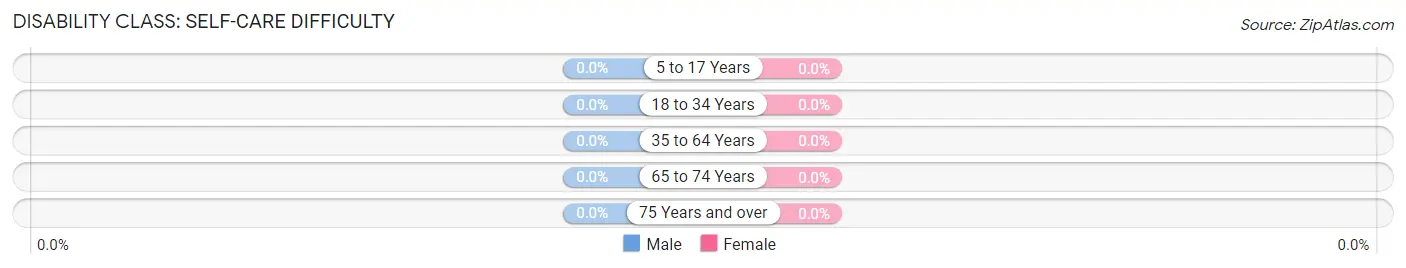
| Age Bracket | Male | Female |
| 5 to 17 Years | 0 (0.0%) | 0 (0.0%) |
| 18 to 34 Years | 0 (0.0%) | 0 (0.0%) |
| 35 to 64 Years | 0 (0.0%) | 0 (0.0%) |
| 65 to 74 Years | 0 (0.0%) | 0 (0.0%) |
| 75 Years and over | 0 (0.0%) | 0 (0.0%) |
Technology Access in Frisco
Computing Device Access in Frisco
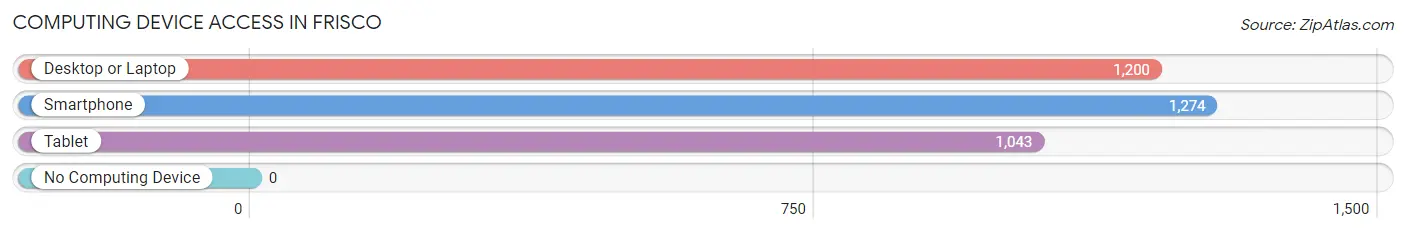
| Device Type | # Households | % Households |
| Desktop or Laptop | 1,200 | 91.7% |
| Smartphone | 1,274 | 97.4% |
| Tablet | 1,043 | 79.7% |
| No Computing Device | 0 | 0.0% |
| Total | 1,308 | 100.0% |
Internet Access in Frisco
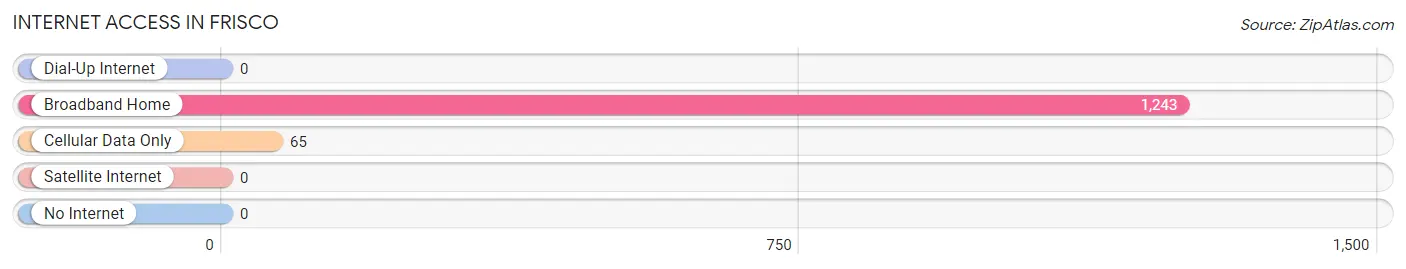
| Internet Type | # Households | % Households |
| Dial-Up Internet | 0 | 0.0% |
| Broadband Home | 1,243 | 95.0% |
| Cellular Data Only | 65 | 5.0% |
| Satellite Internet | 0 | 0.0% |
| No Internet | 0 | 0.0% |
| Total | 1,308 | 100.0% |
Frisco Summary
Frisco, Colorado is a small mountain town located in Summit County, Colorado. It is situated in the heart of the Rocky Mountains, just a few miles from the popular ski resort town of Breckenridge. Frisco is known for its outdoor recreation opportunities, its quaint downtown, and its proximity to the ski resorts of Summit County.
History
Frisco was founded in 1873 by miners who were searching for gold and silver in the area. The town was originally called “Frisco City”, but the name was changed to Frisco in 1875. The town was incorporated in 1880 and was home to a variety of businesses, including a sawmill, a blacksmith shop, and a general store.
In the early 1900s, Frisco began to attract tourists who were drawn to the area’s natural beauty and outdoor recreation opportunities. The town was also a popular stop for the Denver & Rio Grande Railroad, which ran through the area.
In the 1950s, Frisco began to experience a population boom as people moved to the area to take advantage of the ski resorts in Summit County. The town was officially incorporated in 1961 and has since become a popular destination for outdoor recreation and tourism.
Geography
Frisco is located in Summit County, Colorado, in the heart of the Rocky Mountains. The town is situated at an elevation of 9,097 feet and is surrounded by the White River National Forest. Frisco is located just a few miles from the popular ski resort town of Breckenridge and is close to several other ski resorts in Summit County.
The town is situated on the shores of Lake Dillon, a reservoir created by the Dillon Dam on the Blue River. The lake is a popular destination for fishing, boating, and other outdoor activities.
Economy
Frisco’s economy is largely driven by tourism and outdoor recreation. The town is home to several ski resorts, including Copper Mountain, Keystone, and Breckenridge, which attract visitors from around the world. The town is also home to a variety of restaurants, shops, and other businesses that cater to tourists.
Frisco is also home to several tech companies, including the software company, Vail Systems, and the data storage company, Iron Mountain. The town is also home to a variety of manufacturing companies, including the outdoor apparel company, Patagonia.
Demographics
As of the 2010 census, Frisco had a population of 2,683. The town has a median age of 36.7 and a median household income of $68,958. The town is predominantly white (90.2%), with small percentages of Hispanic (3.7%), Asian (2.2%), and African American (1.2%) residents.
Frisco is a popular destination for outdoor recreation and tourism, and the town’s population is expected to continue to grow in the coming years. The town is also home to a variety of businesses, including tech companies, manufacturing companies, and restaurants.
Common Questions
What is the Total Population of Frisco?
Total Population of Frisco is 2,900.
What is the Total Male Population of Frisco?
Total Male Population of Frisco is 1,402.
What is the Total Female Population of Frisco?
Total Female Population of Frisco is 1,498.
What is the Ratio of Males per 100 Females in Frisco?
There are 93.59 Males per 100 Females in Frisco.
What is the Ratio of Females per 100 Males in Frisco?
There are 106.85 Females per 100 Males in Frisco.
What is the Median Population Age in Frisco?
Median Population Age in Frisco is 43.8 Years.
What is the Average Family Size in Frisco
Average Family Size in Frisco is 2.8 People.
What is the Average Household Size in Frisco
Average Household Size in Frisco is 2.2 People.
What is Per Capita Income in Frisco?
Per Capita income in Frisco is $58,760.
What is the Median Family Income in Frisco?
Median Family Income in Frisco is $121,797.
What is the Median Household income in Frisco?
Median Household Income in Frisco is $101,140.
What is Income or Wage Gap in Frisco?
Income or Wage Gap in Frisco is 14.4%.
Women in Frisco earn 85.6 cents for every dollar earned by a man.
What is Inequality or Gini Index in Frisco?
Inequality or Gini Index in Frisco is 0.43.
How Large is the Labor Force in Frisco?
There are 1,929 People in the Labor Forcein in Frisco.
What is the Percentage of People in the Labor Force in Frisco?
74.0% of People are in the Labor Force in Frisco.
What is the Unemployment Rate in Frisco?
Unemployment Rate in Frisco is 1.5%.