Greenwood Village, CO
Greenwood Village Map
Greenwood Village Overview
15,537
TOTAL POPULATION
7,960
MALE POPULATION
7,577
FEMALE POPULATION
105.05
MALES / 100 FEMALES
95.19
FEMALES / 100 MALES
45.6
MEDIAN AGE
3.0
AVG FAMILY SIZE
2.4
AVG HOUSEHOLD SIZE
$106,171
PER CAPITA INCOME
$216,475
AVG FAMILY INCOME
$139,144
AVG HOUSEHOLD INCOME
45.4%
WAGE / INCOME GAP [ % ]
54.6¢/ $1
WAGE / INCOME GAP [ $ ]
0.55
INEQUALITY / GINI INDEX
8,233
LABOR FORCE [ PEOPLE ]
62.7%
PERCENT IN LABOR FORCE
3.1%
UNEMPLOYMENT RATE
Race in Greenwood Village
The most populous races in Greenwood Village are White / Caucasian (12,460 | 80.2%), Asian (2,130 | 13.7%), and Hispanic or Latino (980 | 6.3%).
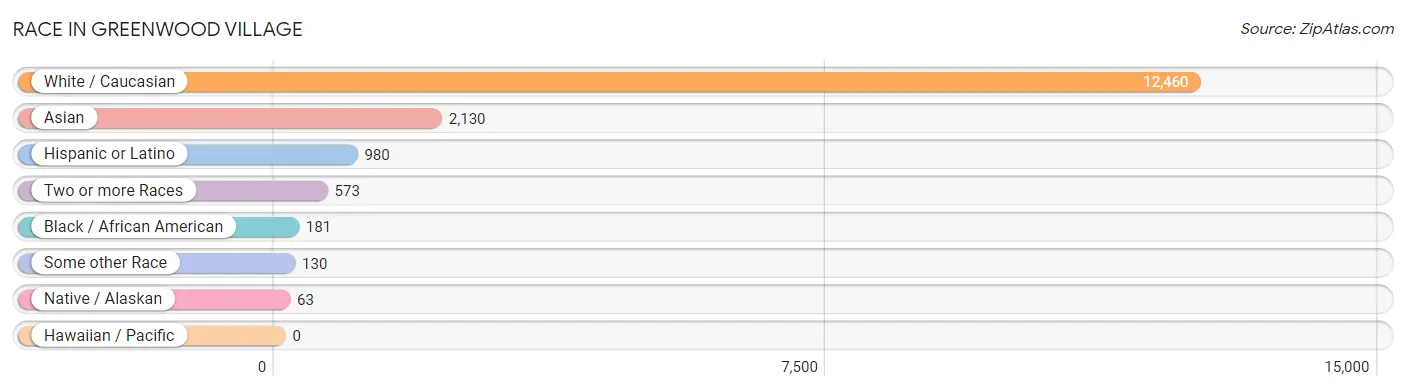
| Race | # Population | % Population |
| Asian | 2,130 | 13.7% |
| Black / African American | 181 | 1.2% |
| Hawaiian / Pacific | 0 | 0.0% |
| Hispanic or Latino | 980 | 6.3% |
| Native / Alaskan | 63 | 0.4% |
| White / Caucasian | 12,460 | 80.2% |
| Two or more Races | 573 | 3.7% |
| Some other Race | 130 | 0.8% |
| Total | 15,537 | 100.0% |
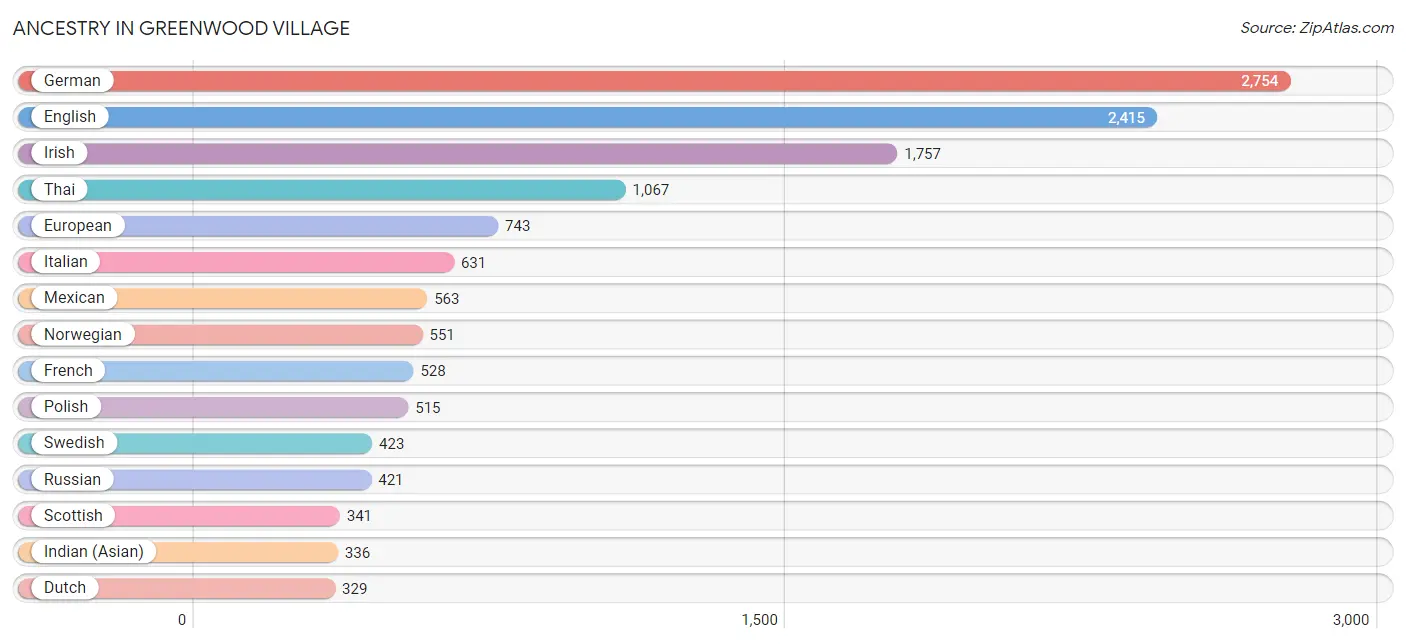
Ancestry in Greenwood Village
The most populous ancestries reported in Greenwood Village are German (2,754 | 17.7%), English (2,415 | 15.5%), Irish (1,757 | 11.3%), Thai (1,067 | 6.9%), and European (743 | 4.8%), together accounting for 56.2% of all Greenwood Village residents.
| Ancestry | # Population | % Population |
| African | 11 | 0.1% |
| American | 250 | 1.6% |
| Apache | 13 | 0.1% |
| Arab | 192 | 1.2% |
| Armenian | 18 | 0.1% |
| Australian | 6 | 0.0% |
| Austrian | 55 | 0.4% |
| Belgian | 158 | 1.0% |
| Bhutanese | 265 | 1.7% |
| Bolivian | 11 | 0.1% |
| Brazilian | 17 | 0.1% |
| British | 120 | 0.8% |
| British West Indian | 12 | 0.1% |
| Bulgarian | 14 | 0.1% |
| Burmese | 316 | 2.0% |
| Canadian | 39 | 0.3% |
| Central American | 45 | 0.3% |
| Cherokee | 13 | 0.1% |
| Chilean | 61 | 0.4% |
| Choctaw | 36 | 0.2% |
| Costa Rican | 11 | 0.1% |
| Croatian | 19 | 0.1% |
| Cuban | 43 | 0.3% |
| Czech | 90 | 0.6% |
| Danish | 148 | 0.9% |
| Dutch | 329 | 2.1% |
| Eastern European | 151 | 1.0% |
| Ecuadorian | 25 | 0.2% |
| Egyptian | 34 | 0.2% |
| English | 2,415 | 15.5% |
| Ethiopian | 52 | 0.3% |
| European | 743 | 4.8% |
| Filipino | 108 | 0.7% |
| Finnish | 32 | 0.2% |
| French | 528 | 3.4% |
| French Canadian | 105 | 0.7% |
| German | 2,754 | 17.7% |
| Greek | 130 | 0.8% |
| Hungarian | 95 | 0.6% |
| Indian (Asian) | 336 | 2.2% |
| Iranian | 43 | 0.3% |
| Irish | 1,757 | 11.3% |
| Israeli | 10 | 0.1% |
| Italian | 631 | 4.1% |
| Korean | 59 | 0.4% |
| Lebanese | 63 | 0.4% |
| Lithuanian | 7 | 0.1% |
| Maltese | 7 | 0.1% |
| Mexican | 563 | 3.6% |
| Mexican American Indian | 16 | 0.1% |
| Navajo | 5 | 0.0% |
| Nigerian | 23 | 0.2% |
| Northern European | 60 | 0.4% |
| Norwegian | 551 | 3.5% |
| Pakistani | 55 | 0.4% |
| Palestinian | 12 | 0.1% |
| Panamanian | 34 | 0.2% |
| Polish | 515 | 3.3% |
| Portuguese | 29 | 0.2% |
| Pueblo | 15 | 0.1% |
| Puerto Rican | 103 | 0.7% |
| Romanian | 109 | 0.7% |
| Russian | 421 | 2.7% |
| Samoan | 7 | 0.1% |
| Scandinavian | 84 | 0.5% |
| Scotch-Irish | 217 | 1.4% |
| Scottish | 341 | 2.2% |
| Sioux | 35 | 0.2% |
| Slovak | 59 | 0.4% |
| South African | 17 | 0.1% |
| South American | 97 | 0.6% |
| South American Indian | 11 | 0.1% |
| Spaniard | 36 | 0.2% |
| Spanish | 85 | 0.5% |
| Sri Lankan | 64 | 0.4% |
| Subsaharan African | 103 | 0.7% |
| Swedish | 423 | 2.7% |
| Swiss | 23 | 0.2% |
| Thai | 1,067 | 6.9% |
| Turkish | 30 | 0.2% |
| Ukrainian | 55 | 0.4% |
| Welsh | 68 | 0.4% |
| Yugoslavian | 30 | 0.2% | View All 83 Rows |
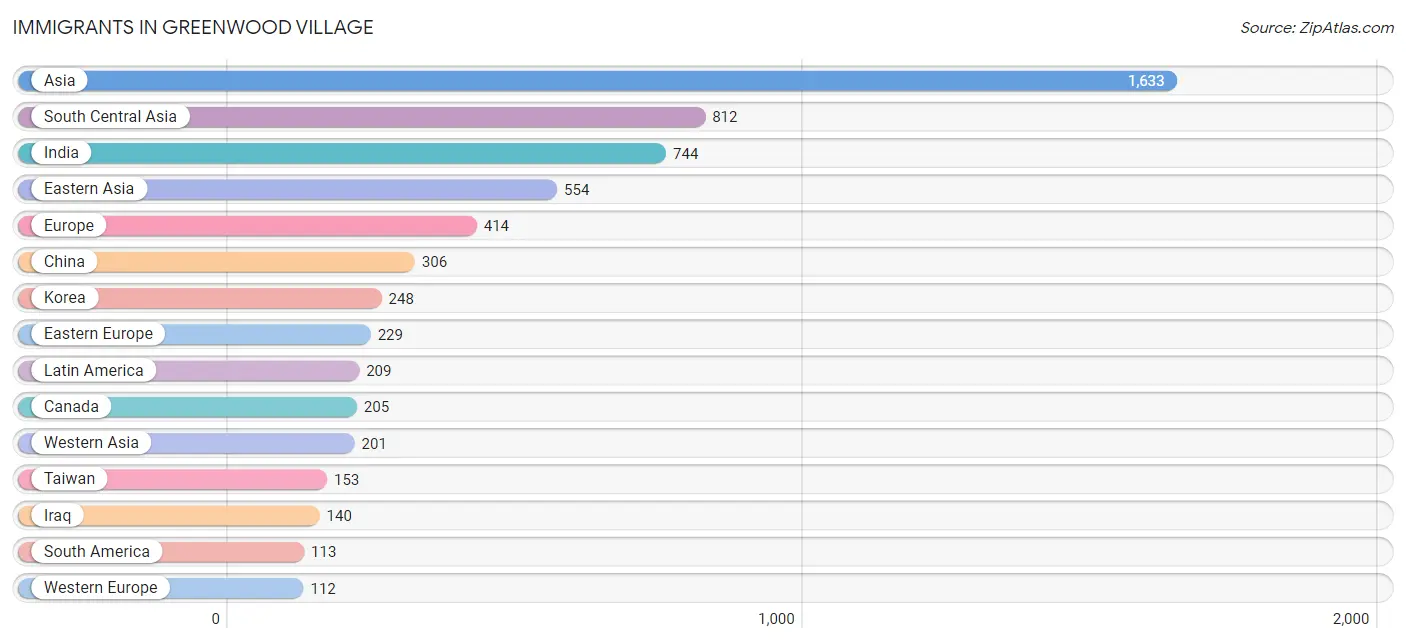
Immigrants in Greenwood Village
The most numerous immigrant groups reported in Greenwood Village came from Asia (1,633 | 10.5%), South Central Asia (812 | 5.2%), India (744 | 4.8%), Eastern Asia (554 | 3.6%), and Europe (414 | 2.7%), together accounting for 26.8% of all Greenwood Village residents.
| Immigration Origin | # Population | % Population |
| Africa | 86 | 0.5% |
| Asia | 1,633 | 10.5% |
| Australia | 13 | 0.1% |
| Austria | 4 | 0.0% |
| Belgium | 7 | 0.1% |
| Bolivia | 11 | 0.1% |
| Bosnia and Herzegovina | 22 | 0.1% |
| Brazil | 44 | 0.3% |
| Canada | 205 | 1.3% |
| Caribbean | 12 | 0.1% |
| Central America | 84 | 0.5% |
| Chile | 53 | 0.3% |
| China | 306 | 2.0% |
| Colombia | 5 | 0.0% |
| Denmark | 8 | 0.1% |
| Eastern Africa | 52 | 0.3% |
| Eastern Asia | 554 | 3.6% |
| Eastern Europe | 229 | 1.5% |
| England | 29 | 0.2% |
| Ethiopia | 52 | 0.3% |
| Europe | 414 | 2.7% |
| France | 46 | 0.3% |
| Germany | 11 | 0.1% |
| Grenada | 12 | 0.1% |
| Hong Kong | 2 | 0.0% |
| Hungary | 17 | 0.1% |
| India | 744 | 4.8% |
| Indonesia | 1 | 0.0% |
| Iran | 49 | 0.3% |
| Iraq | 140 | 0.9% |
| Israel | 15 | 0.1% |
| Kazakhstan | 19 | 0.1% |
| Korea | 248 | 1.6% |
| Kuwait | 9 | 0.1% |
| Latin America | 209 | 1.3% |
| Lebanon | 13 | 0.1% |
| Mexico | 84 | 0.5% |
| Moldova | 14 | 0.1% |
| Netherlands | 44 | 0.3% |
| Northern Europe | 58 | 0.4% |
| Oceania | 21 | 0.1% |
| Philippines | 14 | 0.1% |
| Poland | 7 | 0.1% |
| Portugal | 7 | 0.1% |
| Romania | 31 | 0.2% |
| Russia | 75 | 0.5% |
| Scotland | 6 | 0.0% |
| South Africa | 34 | 0.2% |
| South America | 113 | 0.7% |
| South Central Asia | 812 | 5.2% |
| South Eastern Asia | 54 | 0.4% |
| Southern Europe | 15 | 0.1% |
| Spain | 1 | 0.0% |
| Sweden | 5 | 0.0% |
| Taiwan | 153 | 1.0% |
| Thailand | 22 | 0.1% |
| Turkey | 24 | 0.2% |
| Ukraine | 28 | 0.2% |
| Vietnam | 17 | 0.1% |
| Western Asia | 201 | 1.3% |
| Western Europe | 112 | 0.7% | View All 61 Rows |
Sex and Age in Greenwood Village
Sex and Age in Greenwood Village
The most populous age groups in Greenwood Village are 50 to 54 Years (732 | 9.2%) for men and 55 to 59 Years (663 | 8.7%) for women.
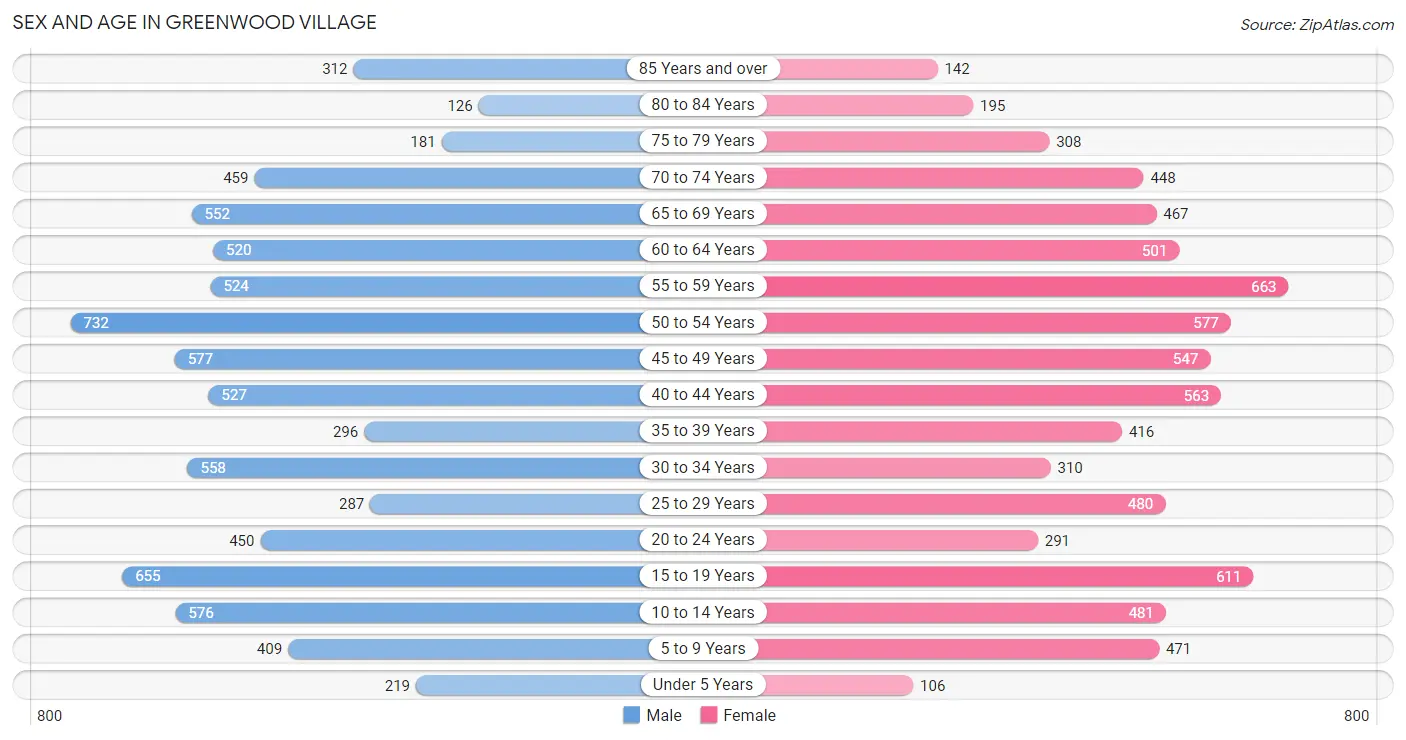
| Age Bracket | Male | Female |
| Under 5 Years | 219 (2.8%) | 106 (1.4%) |
| 5 to 9 Years | 409 (5.1%) | 471 (6.2%) |
| 10 to 14 Years | 576 (7.2%) | 481 (6.4%) |
| 15 to 19 Years | 655 (8.2%) | 611 (8.1%) |
| 20 to 24 Years | 450 (5.7%) | 291 (3.8%) |
| 25 to 29 Years | 287 (3.6%) | 480 (6.3%) |
| 30 to 34 Years | 558 (7.0%) | 310 (4.1%) |
| 35 to 39 Years | 296 (3.7%) | 416 (5.5%) |
| 40 to 44 Years | 527 (6.6%) | 563 (7.4%) |
| 45 to 49 Years | 577 (7.2%) | 547 (7.2%) |
| 50 to 54 Years | 732 (9.2%) | 577 (7.6%) |
| 55 to 59 Years | 524 (6.6%) | 663 (8.7%) |
| 60 to 64 Years | 520 (6.5%) | 501 (6.6%) |
| 65 to 69 Years | 552 (6.9%) | 467 (6.2%) |
| 70 to 74 Years | 459 (5.8%) | 448 (5.9%) |
| 75 to 79 Years | 181 (2.3%) | 308 (4.1%) |
| 80 to 84 Years | 126 (1.6%) | 195 (2.6%) |
| 85 Years and over | 312 (3.9%) | 142 (1.9%) |
| Total | 7,960 (100.0%) | 7,577 (100.0%) |
Families and Households in Greenwood Village
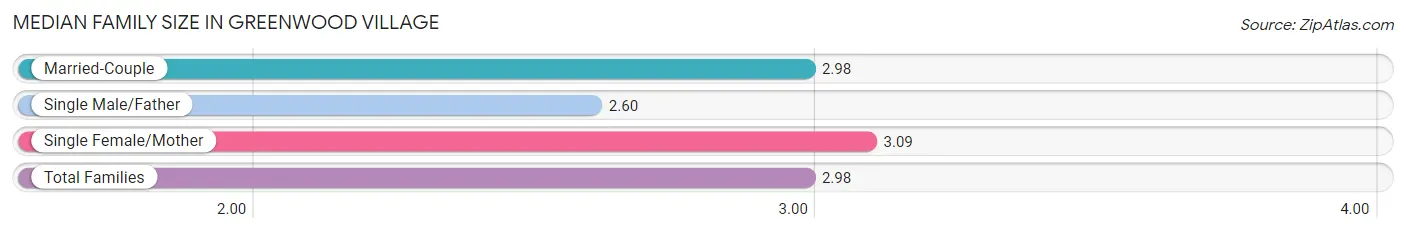
Median Family Size in Greenwood Village
The median family size in Greenwood Village is 2.98 persons per family, with single female/mother families (332 | 7.8%) accounting for the largest median family size of 3.09 persons per family. On the other hand, single male/father families (89 | 2.1%) represent the smallest median family size with 2.60 persons per family.
| Family Type | # Families | Family Size |
| Married-Couple | 3,853 (90.1%) | 2.98 |
| Single Male/Father | 89 (2.1%) | 2.60 |
| Single Female/Mother | 332 (7.8%) | 3.09 |
| Total Families | 4,274 (100.0%) | 2.98 |
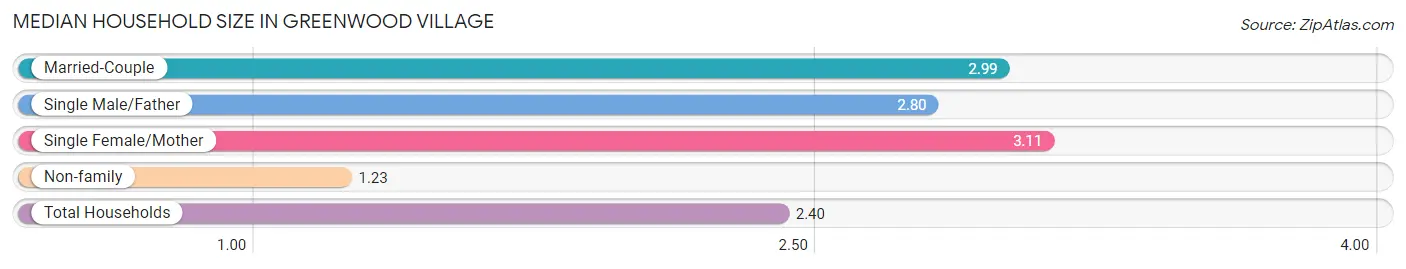
Median Household Size in Greenwood Village
The median household size in Greenwood Village is 2.40 persons per household, with single female/mother households (332 | 5.1%) accounting for the largest median household size of 3.11 persons per household. non-family households (2,171 | 33.7%) represent the smallest median household size with 1.23 persons per household.
| Household Type | # Households | Household Size |
| Married-Couple | 3,853 (59.8%) | 2.99 |
| Single Male/Father | 89 (1.4%) | 2.80 |
| Single Female/Mother | 332 (5.1%) | 3.11 |
| Non-family | 2,171 (33.7%) | 1.23 |
| Total Households | 6,445 (100.0%) | 2.40 |
Household Size by Marriage Status in Greenwood Village
Out of a total of 6,445 households in Greenwood Village, 4,274 (66.3%) are family households, while 2,171 (33.7%) are nonfamily households. The most numerous type of family households are 2-person households, comprising 2,125, and the most common type of nonfamily households are 1-person households, comprising 1,794.
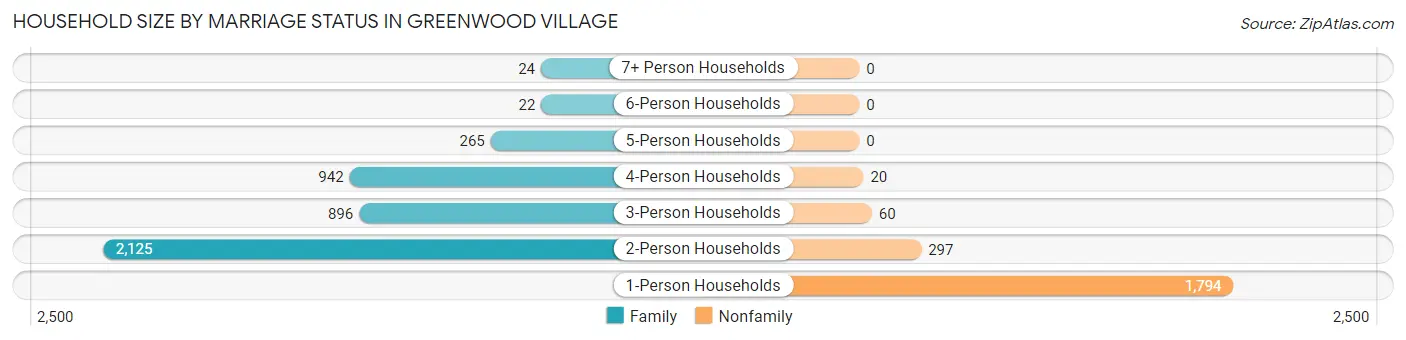
| Household Size | Family Households | Nonfamily Households |
| 1-Person Households | - | 1,794 (27.8%) |
| 2-Person Households | 2,125 (33.0%) | 297 (4.6%) |
| 3-Person Households | 896 (13.9%) | 60 (0.9%) |
| 4-Person Households | 942 (14.6%) | 20 (0.3%) |
| 5-Person Households | 265 (4.1%) | 0 (0.0%) |
| 6-Person Households | 22 (0.3%) | 0 (0.0%) |
| 7+ Person Households | 24 (0.4%) | 0 (0.0%) |
| Total | 4,274 (66.3%) | 2,171 (33.7%) |
Female Fertility in Greenwood Village
Fertility by Age in Greenwood Village
Average fertility rate in Greenwood Village is 27.0 births per 1,000 women. Women in the age bracket of 20 to 34 years have the highest fertility rate with 44.0 births per 1,000 women. Women in the age bracket of 20 to 34 years acount for 53.9% of all women with births.
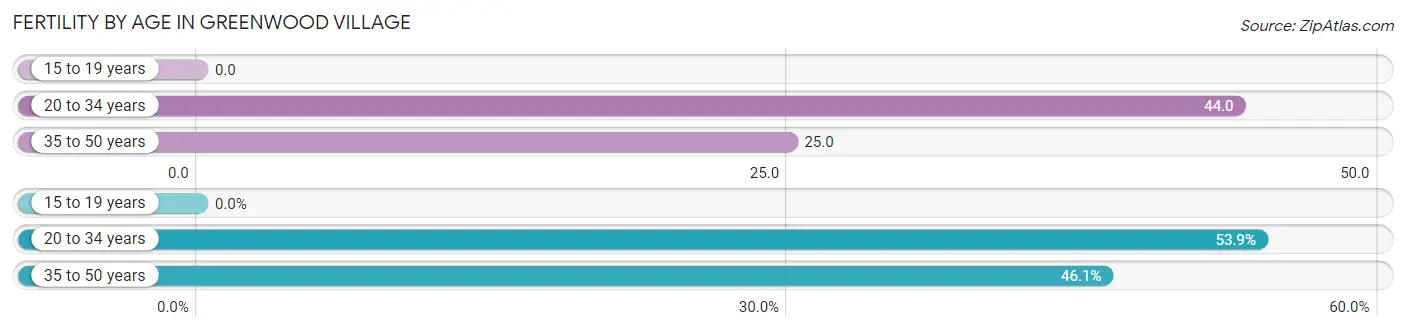
| Age Bracket | Women with Births | Births / 1,000 Women |
| 15 to 19 years | 0 (0.0%) | 0.0 |
| 20 to 34 years | 48 (53.9%) | 44.0 |
| 35 to 50 years | 41 (46.1%) | 25.0 |
| Total | 89 (100.0%) | 27.0 |
Fertility by Age by Marriage Status in Greenwood Village
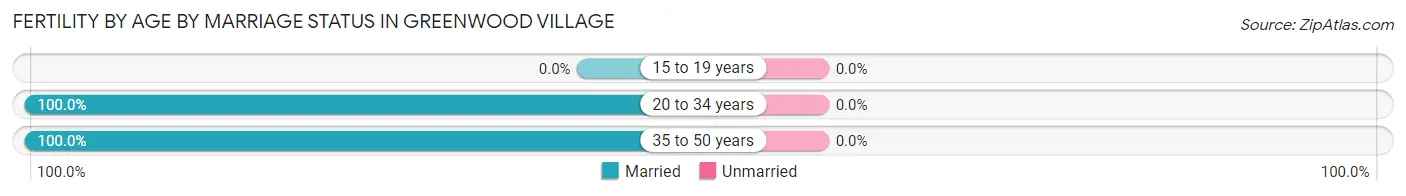
| Age Bracket | Married | Unmarried |
| 15 to 19 years | 0 (0.0%) | 0 (0.0%) |
| 20 to 34 years | 48 (100.0%) | 0 (0.0%) |
| 35 to 50 years | 41 (100.0%) | 0 (0.0%) |
| Total | 89 (100.0%) | 0 (0.0%) |
Fertility by Education in Greenwood Village
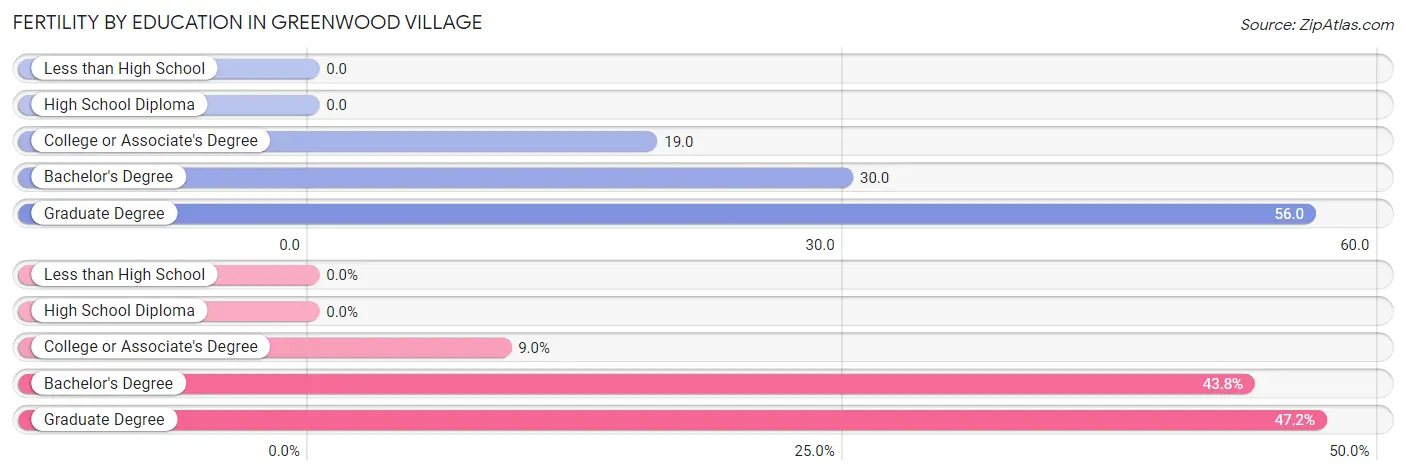
| Educational Attainment | Women with Births | Births / 1,000 Women |
| Less than High School | 0 (0.0%) | 0.0 |
| High School Diploma | 0 (0.0%) | 0.0 |
| College or Associate's Degree | 8 (9.0%) | 19.0 |
| Bachelor's Degree | 39 (43.8%) | 30.0 |
| Graduate Degree | 42 (47.2%) | 56.0 |
| Total | 89 (100.0%) | 27.0 |
Fertility by Education by Marriage Status in Greenwood Village
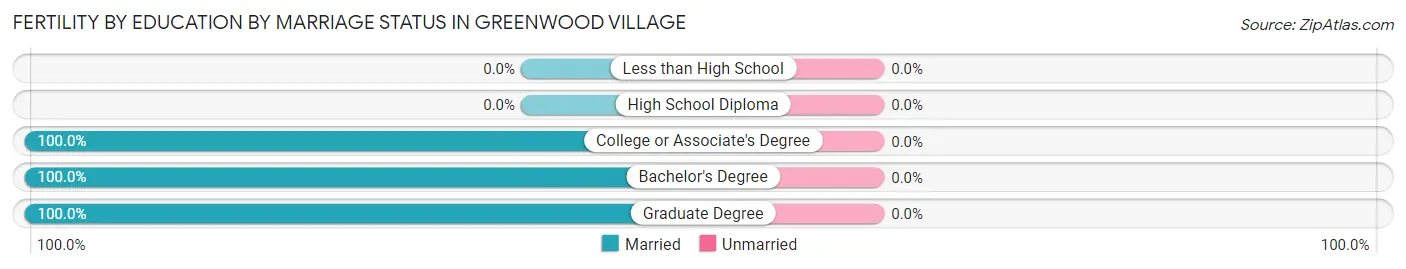
| Educational Attainment | Married | Unmarried |
| Less than High School | 0 (0.0%) | 0 (0.0%) |
| High School Diploma | 0 (0.0%) | 0 (0.0%) |
| College or Associate's Degree | 8 (100.0%) | 0 (0.0%) |
| Bachelor's Degree | 39 (100.0%) | 0 (0.0%) |
| Graduate Degree | 42 (100.0%) | 0 (0.0%) |
| Total | 89 (100.0%) | 0 (0.0%) |
Income in Greenwood Village
Income Overview in Greenwood Village
Per Capita Income in Greenwood Village is $106,171, while median incomes of families and households are $216,475 and $139,144 respectively.
| Characteristic | Number | Measure |
| Per Capita Income | 15,537 | $106,171 |
| Median Family Income | 4,274 | $216,475 |
| Mean Family Income | 4,274 | $328,679 |
| Median Household Income | 6,445 | $139,144 |
| Mean Household Income | 6,445 | $251,400 |
| Income Deficit | 4,274 | $0 |
| Wage / Income Gap (%) | 15,537 | 45.42% |
| Wage / Income Gap ($) | 15,537 | 54.58¢ per $1 |
| Gini / Inequality Index | 15,537 | 0.55 |
Earnings by Sex in Greenwood Village
Average Earnings in Greenwood Village are $69,409, $91,391 for men and $49,884 for women, a difference of 45.4%.
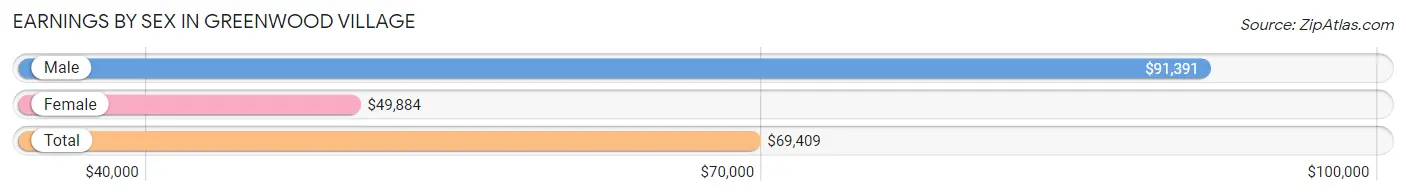
| Sex | Number | Average Earnings |
| Male | 5,149 (56.4%) | $91,391 |
| Female | 3,981 (43.6%) | $49,884 |
| Total | 9,130 (100.0%) | $69,409 |
Earnings by Sex by Income Bracket in Greenwood Village
The most common earnings brackets in Greenwood Village are $100,000+ for men (2,406 | 46.7%) and $100,000+ for women (976 | 24.5%).
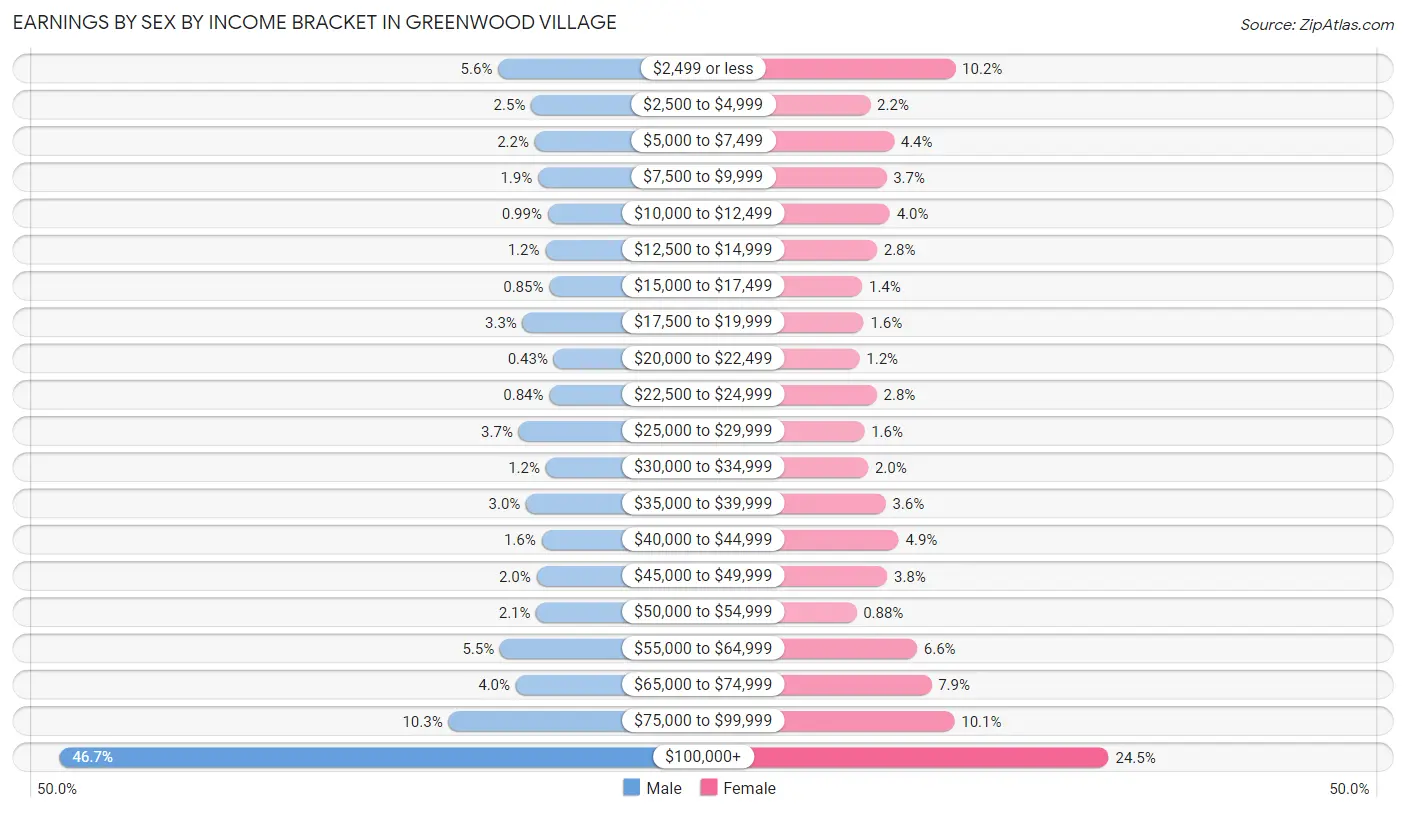
| Income | Male | Female |
| $2,499 or less | 290 (5.6%) | 404 (10.2%) |
| $2,500 to $4,999 | 131 (2.5%) | 87 (2.2%) |
| $5,000 to $7,499 | 114 (2.2%) | 175 (4.4%) |
| $7,500 to $9,999 | 98 (1.9%) | 147 (3.7%) |
| $10,000 to $12,499 | 51 (1.0%) | 160 (4.0%) |
| $12,500 to $14,999 | 63 (1.2%) | 112 (2.8%) |
| $15,000 to $17,499 | 44 (0.9%) | 57 (1.4%) |
| $17,500 to $19,999 | 172 (3.3%) | 62 (1.6%) |
| $20,000 to $22,499 | 22 (0.4%) | 47 (1.2%) |
| $22,500 to $24,999 | 43 (0.8%) | 111 (2.8%) |
| $25,000 to $29,999 | 191 (3.7%) | 65 (1.6%) |
| $30,000 to $34,999 | 61 (1.2%) | 79 (2.0%) |
| $35,000 to $39,999 | 155 (3.0%) | 144 (3.6%) |
| $40,000 to $44,999 | 81 (1.6%) | 193 (4.9%) |
| $45,000 to $49,999 | 105 (2.0%) | 150 (3.8%) |
| $50,000 to $54,999 | 106 (2.1%) | 35 (0.9%) |
| $55,000 to $64,999 | 281 (5.5%) | 261 (6.6%) |
| $65,000 to $74,999 | 205 (4.0%) | 315 (7.9%) |
| $75,000 to $99,999 | 530 (10.3%) | 401 (10.1%) |
| $100,000+ | 2,406 (46.7%) | 976 (24.5%) |
| Total | 5,149 (100.0%) | 3,981 (100.0%) |
Earnings by Sex by Educational Attainment in Greenwood Village
Average earnings in Greenwood Village are $107,000 for men and $62,853 for women, a difference of 41.3%. Men with an educational attainment of graduate degree enjoy the highest average annual earnings of $135,593, while those with high school diploma education earn the least with $43,214. Women with an educational attainment of graduate degree earn the most with the average annual earnings of $79,211, while those with high school diploma education have the smallest earnings of $36,161.
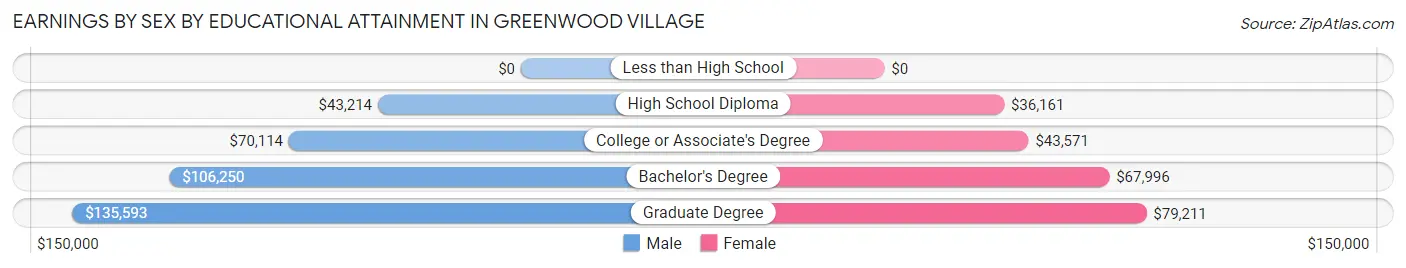
| Educational Attainment | Male Income | Female Income |
| Less than High School | - | - |
| High School Diploma | $43,214 | $36,161 |
| College or Associate's Degree | $70,114 | $43,571 |
| Bachelor's Degree | $106,250 | $67,996 |
| Graduate Degree | $135,593 | $79,211 |
| Total | $107,000 | $62,853 |
Family Income in Greenwood Village
Family Income Brackets in Greenwood Village
According to the Greenwood Village family income data, there are 2,261 families falling into the $200,000+ income range, which is the most common income bracket and makes up 52.9% of all families. Conversely, the less than $10,000 income bracket is the least frequent group with only 26 families (0.6%) belonging to this category.
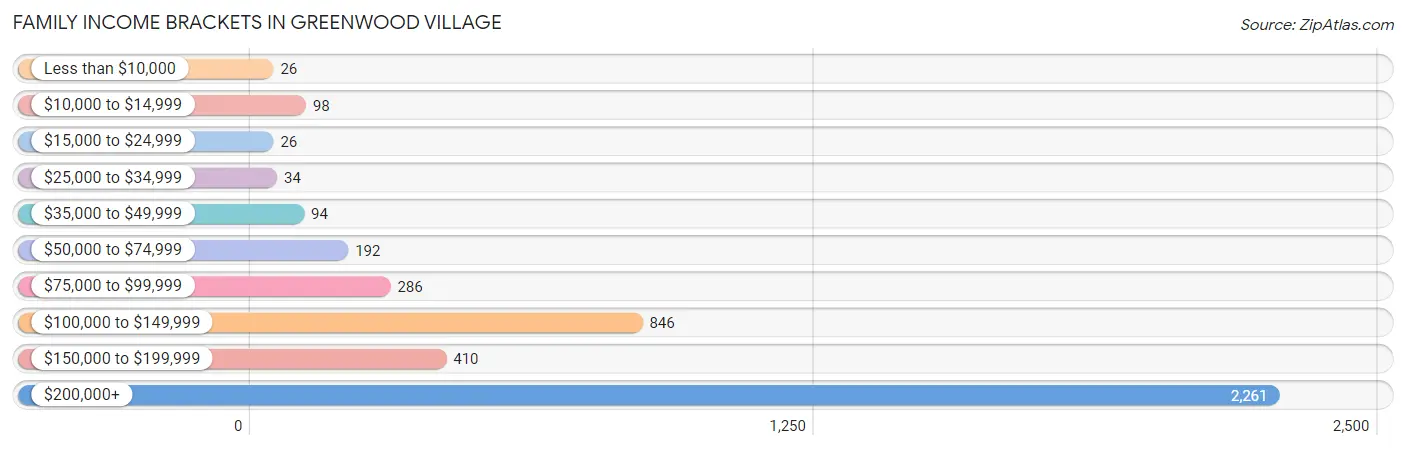
| Income Bracket | # Families | % Families |
| Less than $10,000 | 26 | 0.6% |
| $10,000 to $14,999 | 98 | 2.3% |
| $15,000 to $24,999 | 26 | 0.6% |
| $25,000 to $34,999 | 34 | 0.8% |
| $35,000 to $49,999 | 94 | 2.2% |
| $50,000 to $74,999 | 192 | 4.5% |
| $75,000 to $99,999 | 286 | 6.7% |
| $100,000 to $149,999 | 846 | 19.8% |
| $150,000 to $199,999 | 410 | 9.6% |
| $200,000+ | 2,261 | 52.9% |
Family Income by Famaliy Size in Greenwood Village
5-person families (265 | 6.2%) account for the highest median family income in Greenwood Village with $250,001 per family, while 2-person families (2,143 | 50.1%) have the highest median income of $95,430 per family member.
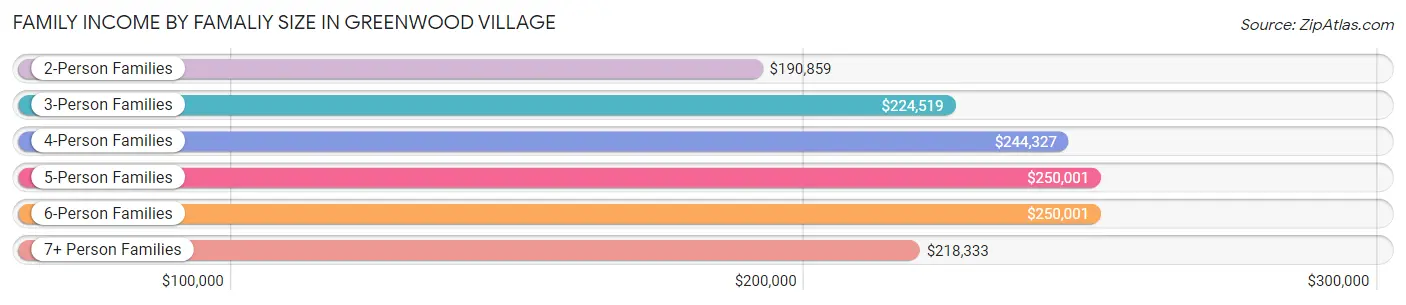
| Income Bracket | # Families | Median Income |
| 2-Person Families | 2,143 (50.1%) | $190,859 |
| 3-Person Families | 903 (21.1%) | $224,519 |
| 4-Person Families | 917 (21.5%) | $244,327 |
| 5-Person Families | 265 (6.2%) | $250,001 |
| 6-Person Families | 22 (0.5%) | $250,001 |
| 7+ Person Families | 24 (0.6%) | $218,333 |
| Total | 4,274 (100.0%) | $216,475 |
Family Income by Number of Earners in Greenwood Village
The median family income in Greenwood Village is $216,475, with families comprising 2 earners (1,792) having the highest median family income of $250,001, while families with no earners (685) have the lowest median family income of $115,250, accounting for 41.9% and 16.0% of families, respectively.
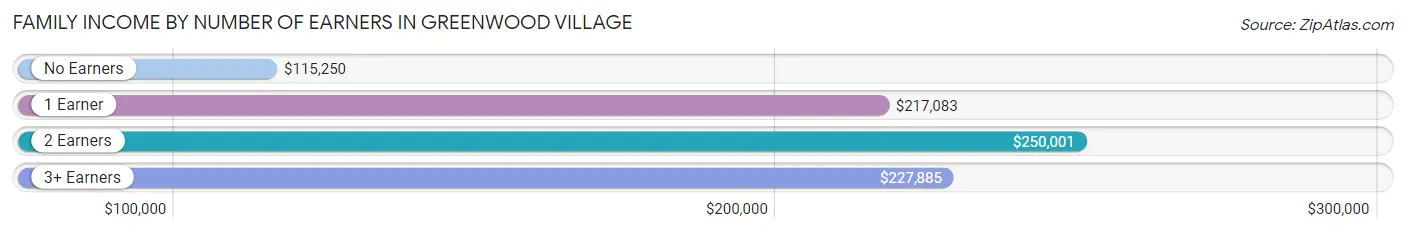
| Number of Earners | # Families | Median Income |
| No Earners | 685 (16.0%) | $115,250 |
| 1 Earner | 1,199 (28.1%) | $217,083 |
| 2 Earners | 1,792 (41.9%) | $250,001 |
| 3+ Earners | 598 (14.0%) | $227,885 |
| Total | 4,274 (100.0%) | $216,475 |
Household Income in Greenwood Village
Household Income Brackets in Greenwood Village
With 2,526 households falling in the category, the $200,000+ income range is the most frequent in Greenwood Village, accounting for 39.2% of all households. In contrast, only 122 households (1.9%) fall into the $15,000 to $24,999 income bracket, making it the least populous group.
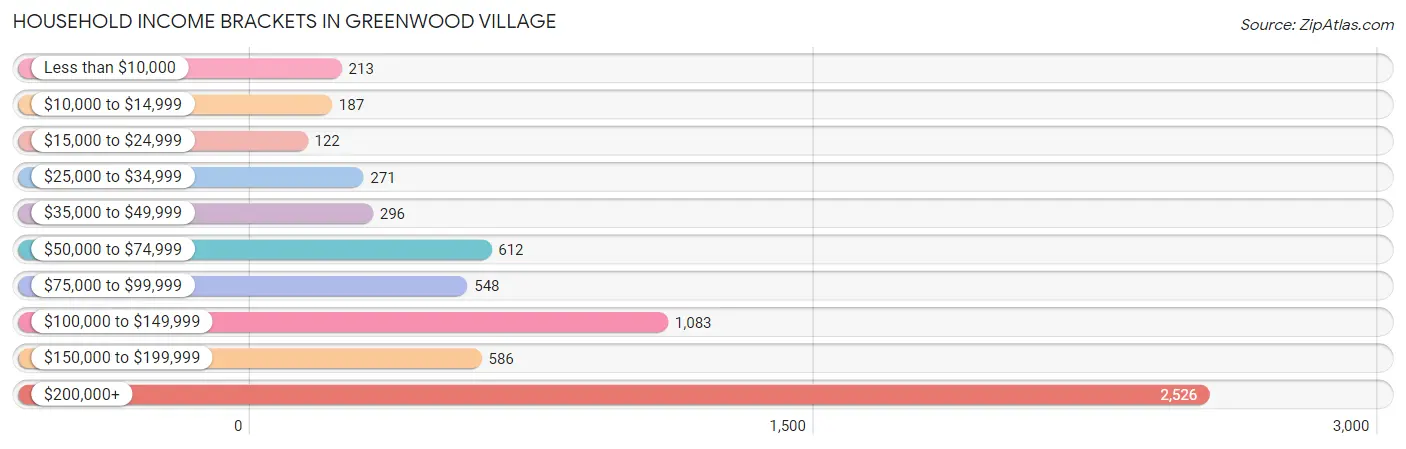
| Income Bracket | # Households | % Households |
| Less than $10,000 | 213 | 3.3% |
| $10,000 to $14,999 | 187 | 2.9% |
| $15,000 to $24,999 | 122 | 1.9% |
| $25,000 to $34,999 | 271 | 4.2% |
| $35,000 to $49,999 | 296 | 4.6% |
| $50,000 to $74,999 | 612 | 9.5% |
| $75,000 to $99,999 | 548 | 8.5% |
| $100,000 to $149,999 | 1,083 | 16.8% |
| $150,000 to $199,999 | 586 | 9.1% |
| $200,000+ | 2,526 | 39.2% |
Household Income by Householder Age in Greenwood Village
The median household income in Greenwood Village is $139,144, with the highest median household income of $196,071 found in the 45 to 64 years age bracket for the primary householder. A total of 2,618 households (40.6%) fall into this category. Meanwhile, the 15 to 24 years age bracket for the primary householder has the lowest median household income of $0, with 221 households (3.4%) in this group.
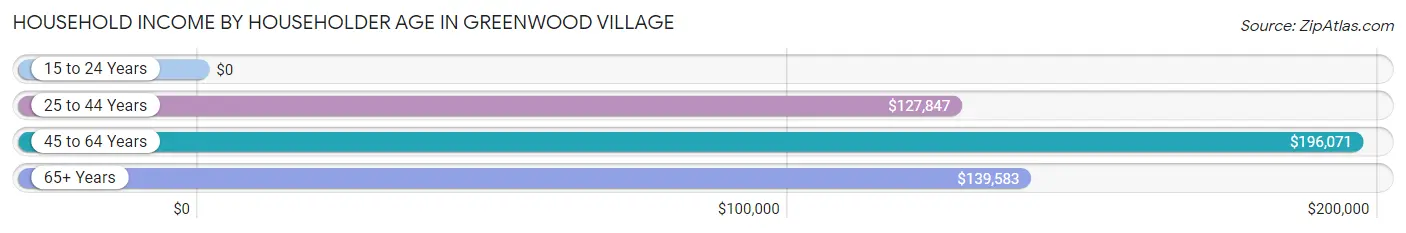
| Income Bracket | # Households | Median Income |
| 15 to 24 Years | 221 (3.4%) | $0 |
| 25 to 44 Years | 1,834 (28.5%) | $127,847 |
| 45 to 64 Years | 2,618 (40.6%) | $196,071 |
| 65+ Years | 1,772 (27.5%) | $139,583 |
| Total | 6,445 (100.0%) | $139,144 |
Poverty in Greenwood Village
Income Below Poverty by Sex and Age in Greenwood Village
With 6.0% poverty level for males and 5.0% for females among the residents of Greenwood Village, 18 to 24 year old males and 6 to 11 year old females are the most vulnerable to poverty, with 177 males (25.3%) and 96 females (20.7%) in their respective age groups living below the poverty level.
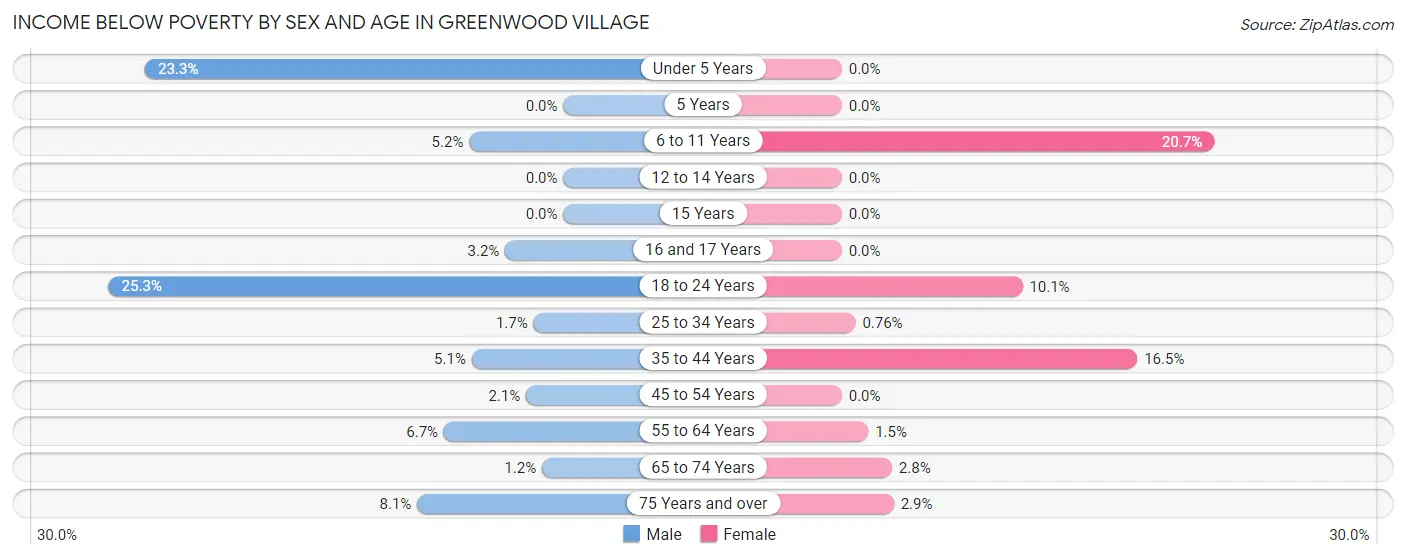
| Age Bracket | Male | Female |
| Under 5 Years | 51 (23.3%) | 0 (0.0%) |
| 5 Years | 0 (0.0%) | 0 (0.0%) |
| 6 to 11 Years | 28 (5.2%) | 96 (20.7%) |
| 12 to 14 Years | 0 (0.0%) | 0 (0.0%) |
| 15 Years | 0 (0.0%) | 0 (0.0%) |
| 16 and 17 Years | 11 (3.2%) | 0 (0.0%) |
| 18 to 24 Years | 177 (25.3%) | 51 (10.1%) |
| 25 to 34 Years | 14 (1.7%) | 6 (0.8%) |
| 35 to 44 Years | 42 (5.1%) | 161 (16.5%) |
| 45 to 54 Years | 27 (2.1%) | 0 (0.0%) |
| 55 to 64 Years | 69 (6.7%) | 17 (1.5%) |
| 65 to 74 Years | 12 (1.2%) | 25 (2.8%) |
| 75 Years and over | 49 (8.1%) | 18 (2.9%) |
| Total | 480 (6.0%) | 374 (5.0%) |
Income Above Poverty by Sex and Age in Greenwood Village
According to the poverty statistics in Greenwood Village, males aged 5 years and females aged under 5 years are the age groups that are most secure financially, with 100.0% of males and 100.0% of females in these age groups living above the poverty line.
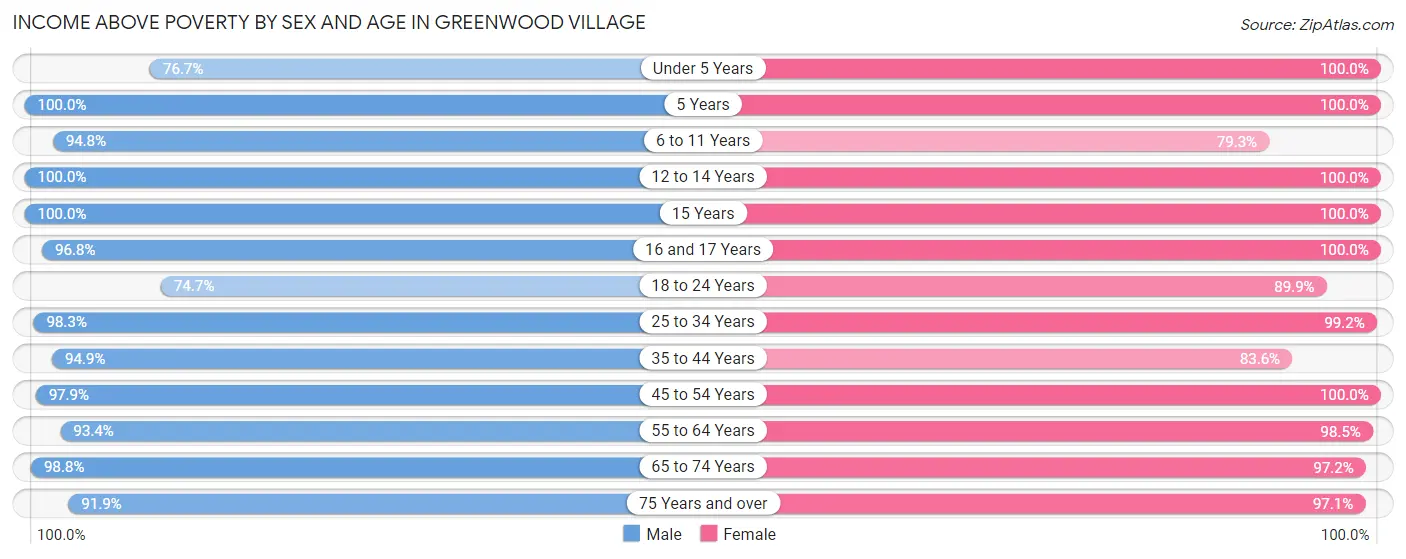
| Age Bracket | Male | Female |
| Under 5 Years | 168 (76.7%) | 106 (100.0%) |
| 5 Years | 38 (100.0%) | 181 (100.0%) |
| 6 to 11 Years | 506 (94.8%) | 367 (79.3%) |
| 12 to 14 Years | 413 (100.0%) | 296 (100.0%) |
| 15 Years | 66 (100.0%) | 78 (100.0%) |
| 16 and 17 Years | 329 (96.8%) | 317 (100.0%) |
| 18 to 24 Years | 522 (74.7%) | 456 (89.9%) |
| 25 to 34 Years | 831 (98.3%) | 784 (99.2%) |
| 35 to 44 Years | 781 (94.9%) | 818 (83.6%) |
| 45 to 54 Years | 1,279 (97.9%) | 1,124 (100.0%) |
| 55 to 64 Years | 969 (93.3%) | 1,139 (98.5%) |
| 65 to 74 Years | 999 (98.8%) | 871 (97.2%) |
| 75 Years and over | 553 (91.9%) | 604 (97.1%) |
| Total | 7,454 (94.0%) | 7,141 (95.0%) |
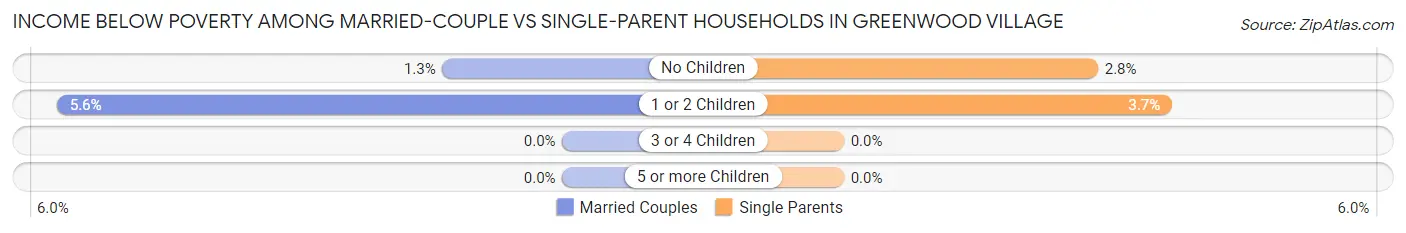
Income Below Poverty Among Married-Couple Families in Greenwood Village
The poverty statistics for married-couple families in Greenwood Village show that 2.8% or 108 of the total 3,853 families live below the poverty line. Families with 1 or 2 children have the highest poverty rate of 5.6%, comprising of 77 families. On the other hand, families with 3 or 4 children have the lowest poverty rate of 0.0%, which includes 0 families.
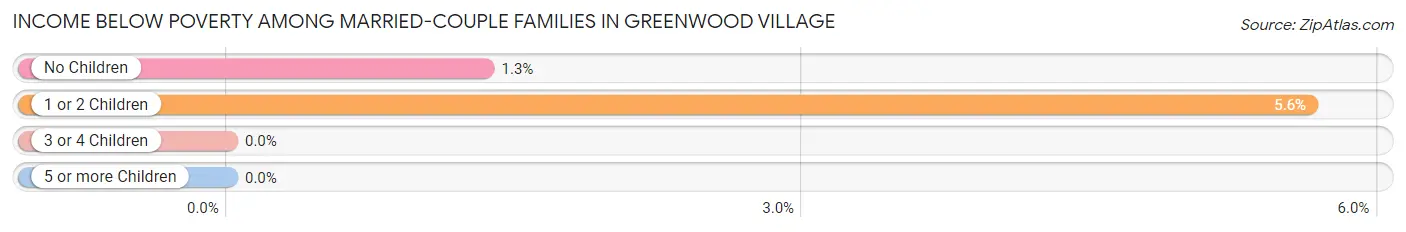
| Children | Above Poverty | Below Poverty |
| No Children | 2,280 (98.7%) | 31 (1.3%) |
| 1 or 2 Children | 1,289 (94.4%) | 77 (5.6%) |
| 3 or 4 Children | 166 (100.0%) | 0 (0.0%) |
| 5 or more Children | 10 (100.0%) | 0 (0.0%) |
| Total | 3,745 (97.2%) | 108 (2.8%) |
Income Below Poverty Among Single-Parent Households in Greenwood Village
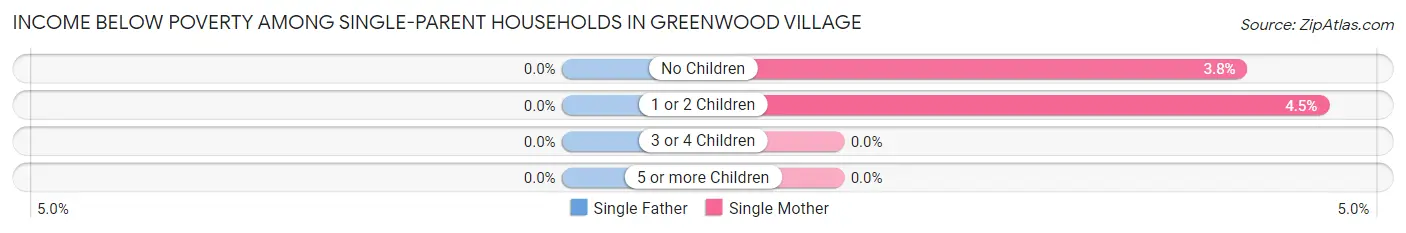
| Children | Single Father | Single Mother |
| No Children | 0 (0.0%) | 5 (3.8%) |
| 1 or 2 Children | 0 (0.0%) | 9 (4.5%) |
| 3 or 4 Children | 0 (0.0%) | 0 (0.0%) |
| 5 or more Children | 0 (0.0%) | 0 (0.0%) |
| Total | 0 (0.0%) | 14 (4.2%) |
Income Below Poverty Among Married-Couple vs Single-Parent Households in Greenwood Village
The poverty data for Greenwood Village shows that 108 of the married-couple family households (2.8%) and 14 of the single-parent households (3.3%) are living below the poverty level. Within the married-couple family households, those with 1 or 2 children have the highest poverty rate, with 77 households (5.6%) falling below the poverty line. Among the single-parent households, those with 1 or 2 children have the highest poverty rate, with 9 household (3.7%) living below poverty.
| Children | Married-Couple Families | Single-Parent Households |
| No Children | 31 (1.3%) | 5 (2.8%) |
| 1 or 2 Children | 77 (5.6%) | 9 (3.7%) |
| 3 or 4 Children | 0 (0.0%) | 0 (0.0%) |
| 5 or more Children | 0 (0.0%) | 0 (0.0%) |
| Total | 108 (2.8%) | 14 (3.3%) |
Employment Characteristics in Greenwood Village
Employment by Class of Employer in Greenwood Village
Among the 7,876 employed individuals in Greenwood Village, private company employees (5,318 | 67.5%), self-employed (incorporated) (868 | 11.0%), and self-employed (not incorporated) (512 | 6.5%) make up the most common classes of employment.
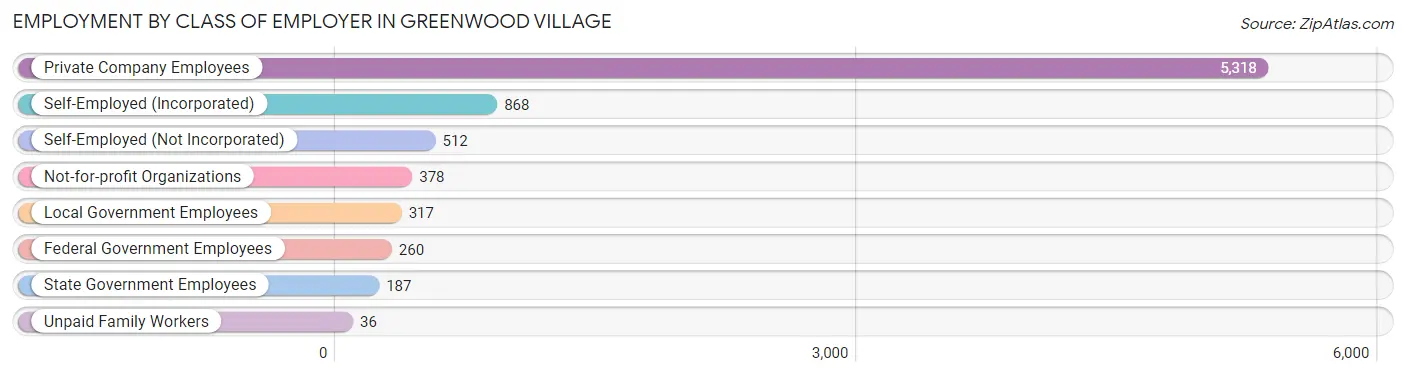
| Employer Class | # Employees | % Employees |
| Private Company Employees | 5,318 | 67.5% |
| Self-Employed (Incorporated) | 868 | 11.0% |
| Self-Employed (Not Incorporated) | 512 | 6.5% |
| Not-for-profit Organizations | 378 | 4.8% |
| Local Government Employees | 317 | 4.0% |
| State Government Employees | 187 | 2.4% |
| Federal Government Employees | 260 | 3.3% |
| Unpaid Family Workers | 36 | 0.5% |
| Total | 7,876 | 100.0% |
Employment Status by Age in Greenwood Village
According to the labor force statistics for Greenwood Village, out of the total population over 16 years of age (13,131), 62.7% or 8,233 individuals are in the labor force, with 3.1% or 255 of them unemployed. The age group with the highest labor force participation rate is 25 to 29 years, with 91.8% or 704 individuals in the labor force. Within the labor force, the 20 to 24 years age range has the highest percentage of unemployed individuals, with 8.6% or 49 of them being unemployed.
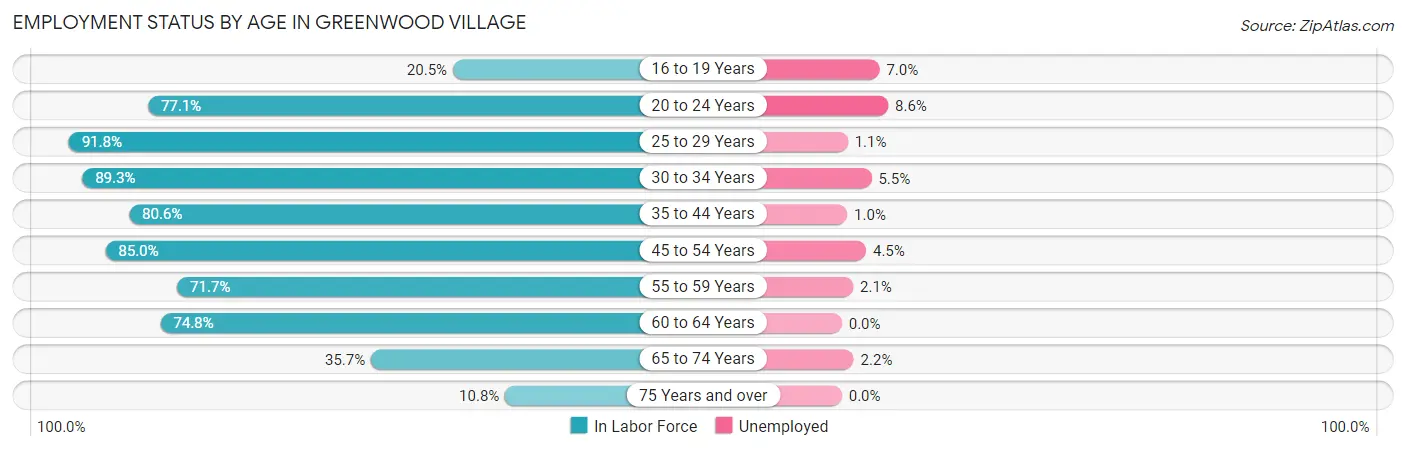
| Age Bracket | In Labor Force | Unemployed |
| 16 to 19 Years | 230 (20.5%) | 16 (7.0%) |
| 20 to 24 Years | 571 (77.1%) | 49 (8.6%) |
| 25 to 29 Years | 704 (91.8%) | 8 (1.1%) |
| 30 to 34 Years | 775 (89.3%) | 43 (5.5%) |
| 35 to 44 Years | 1,452 (80.6%) | 15 (1.0%) |
| 45 to 54 Years | 2,068 (85.0%) | 93 (4.5%) |
| 55 to 59 Years | 851 (71.7%) | 18 (2.1%) |
| 60 to 64 Years | 764 (74.8%) | 0 (0.0%) |
| 65 to 74 Years | 688 (35.7%) | 15 (2.2%) |
| 75 Years and over | 137 (10.8%) | 0 (0.0%) |
| Total | 8,233 (62.7%) | 255 (3.1%) |
Employment Status by Educational Attainment in Greenwood Village
According to labor force statistics for Greenwood Village, 81.9% of individuals (6,616) out of the total population between 25 and 64 years of age (8,078) are in the labor force, with 2.7% or 179 of them being unemployed. The group with the highest labor force participation rate are those with the educational attainment of bachelor's degree or higher, with 82.7% or 5,352 individuals in the labor force. Within the labor force, individuals with college / associate degree education have the highest percentage of unemployment, with 5.4% or 46 of them being unemployed.
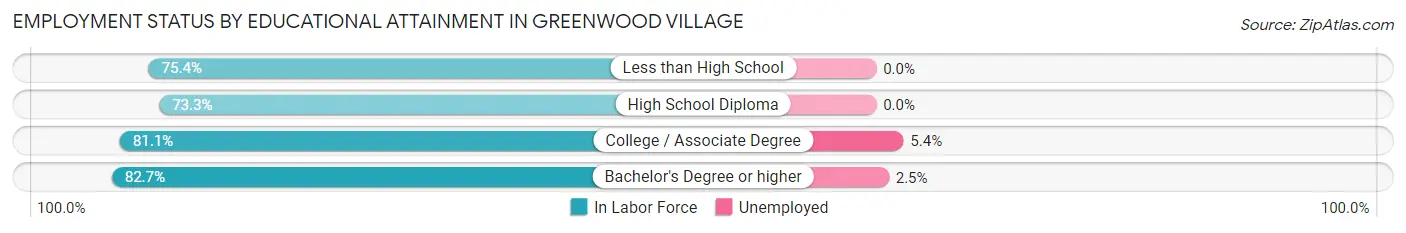
| Educational Attainment | In Labor Force | Unemployed |
| Less than High School | 43 (75.4%) | 0 (0.0%) |
| High School Diploma | 371 (73.3%) | 0 (0.0%) |
| College / Associate Degree | 847 (81.1%) | 56 (5.4%) |
| Bachelor's Degree or higher | 5,352 (82.7%) | 162 (2.5%) |
| Total | 6,616 (81.9%) | 218 (2.7%) |
Employment Occupations by Sex in Greenwood Village
Management, Business, Science and Arts Occupations
The most common Management, Business, Science and Arts occupations in Greenwood Village are Management (2,017 | 25.3%), Computers, Engineering & Science (988 | 12.4%), Community & Social Service (975 | 12.2%), Business & Financial (895 | 11.2%), and Computers & Mathematics (588 | 7.4%).
Management, Business, Science and Arts Occupations by Sex
Within the Management, Business, Science and Arts occupations in Greenwood Village, the most male-oriented occupations are Architecture & Engineering (76.8%), Legal Services & Support (73.0%), and Computers, Engineering & Science (67.5%), while the most female-oriented occupations are Education, Arts & Media (82.5%), Education Instruction & Library (62.2%), and Health Diagnosing & Treating (61.3%).
| Occupation | Male | Female |
| Management | 1,295 (64.2%) | 722 (35.8%) |
| Business & Financial | 503 (56.2%) | 392 (43.8%) |
| Computers, Engineering & Science | 667 (67.5%) | 321 (32.5%) |
| Computers & Mathematics | 396 (67.3%) | 192 (32.7%) |
| Architecture & Engineering | 195 (76.8%) | 59 (23.2%) |
| Life, Physical & Social Science | 76 (52.0%) | 70 (47.9%) |
| Community & Social Service | 467 (47.9%) | 508 (52.1%) |
| Education, Arts & Media | 20 (17.5%) | 94 (82.5%) |
| Legal Services & Support | 227 (73.0%) | 84 (27.0%) |
| Education Instruction & Library | 127 (37.8%) | 209 (62.2%) |
| Arts, Media & Entertainment | 93 (43.5%) | 121 (56.5%) |
| Health Diagnosing & Treating | 207 (38.7%) | 328 (61.3%) |
| Health Technologists | 194 (40.0%) | 291 (60.0%) |
| Total (Category) | 3,139 (58.0%) | 2,271 (42.0%) |
| Total (Overall) | 4,604 (57.7%) | 3,377 (42.3%) |
Services Occupations
The most common Services occupations in Greenwood Village are Food Preparation & Serving (348 | 4.4%), Cleaning & Maintenance (87 | 1.1%), Personal Care & Service (60 | 0.7%), Security & Protection (57 | 0.7%), and Firefighting & Prevention (50 | 0.6%).
Services Occupations by Sex
Within the Services occupations in Greenwood Village, the most male-oriented occupations are Law Enforcement (100.0%), Cleaning & Maintenance (100.0%), and Security & Protection (82.5%), while the most female-oriented occupations are Healthcare Support (100.0%), Personal Care & Service (88.3%), and Food Preparation & Serving (76.1%).
| Occupation | Male | Female |
| Healthcare Support | 0 (0.0%) | 49 (100.0%) |
| Security & Protection | 47 (82.5%) | 10 (17.5%) |
| Firefighting & Prevention | 40 (80.0%) | 10 (20.0%) |
| Law Enforcement | 7 (100.0%) | 0 (0.0%) |
| Food Preparation & Serving | 83 (23.8%) | 265 (76.1%) |
| Cleaning & Maintenance | 87 (100.0%) | 0 (0.0%) |
| Personal Care & Service | 7 (11.7%) | 53 (88.3%) |
| Total (Category) | 224 (37.3%) | 377 (62.7%) |
| Total (Overall) | 4,604 (57.7%) | 3,377 (42.3%) |
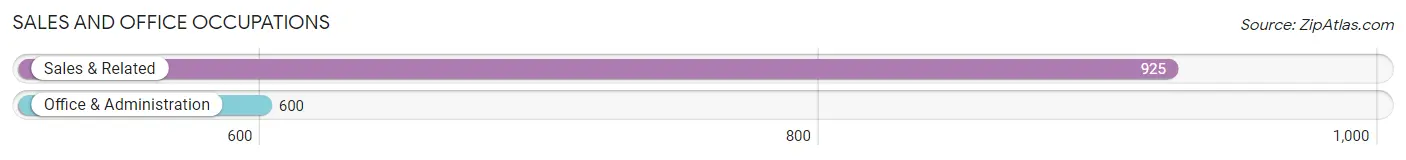
Sales and Office Occupations
The most common Sales and Office occupations in Greenwood Village are Sales & Related (925 | 11.6%), and Office & Administration (600 | 7.5%).
Sales and Office Occupations by Sex
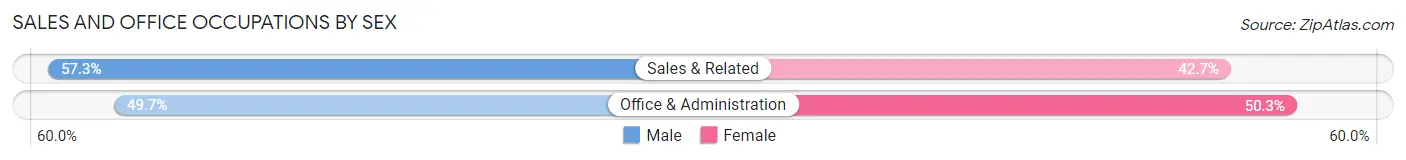
| Occupation | Male | Female |
| Sales & Related | 530 (57.3%) | 395 (42.7%) |
| Office & Administration | 298 (49.7%) | 302 (50.3%) |
| Total (Category) | 828 (54.3%) | 697 (45.7%) |
| Total (Overall) | 4,604 (57.7%) | 3,377 (42.3%) |
Natural Resources, Construction and Maintenance Occupations
The most common Natural Resources, Construction and Maintenance occupations in Greenwood Village are Construction & Extraction (111 | 1.4%), and Installation, Maintenance & Repair (35 | 0.4%).

Natural Resources, Construction and Maintenance Occupations by Sex
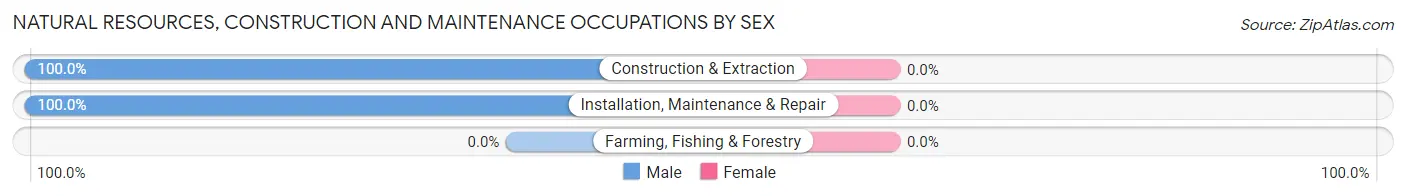
| Occupation | Male | Female |
| Farming, Fishing & Forestry | 0 (0.0%) | 0 (0.0%) |
| Construction & Extraction | 111 (100.0%) | 0 (0.0%) |
| Installation, Maintenance & Repair | 35 (100.0%) | 0 (0.0%) |
| Total (Category) | 146 (100.0%) | 0 (0.0%) |
| Total (Overall) | 4,604 (57.7%) | 3,377 (42.3%) |
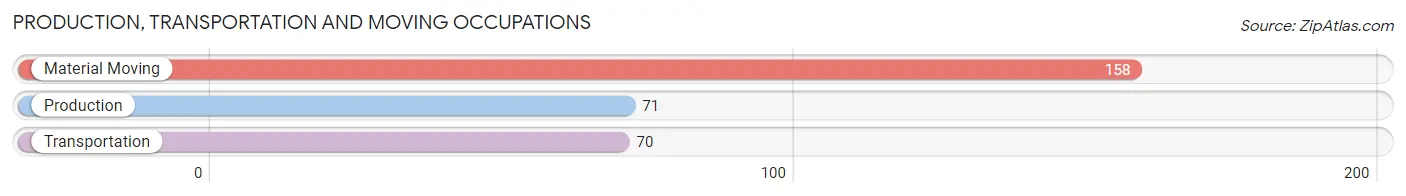
Production, Transportation and Moving Occupations
The most common Production, Transportation and Moving occupations in Greenwood Village are Material Moving (158 | 2.0%), Production (71 | 0.9%), and Transportation (70 | 0.9%).
Production, Transportation and Moving Occupations by Sex
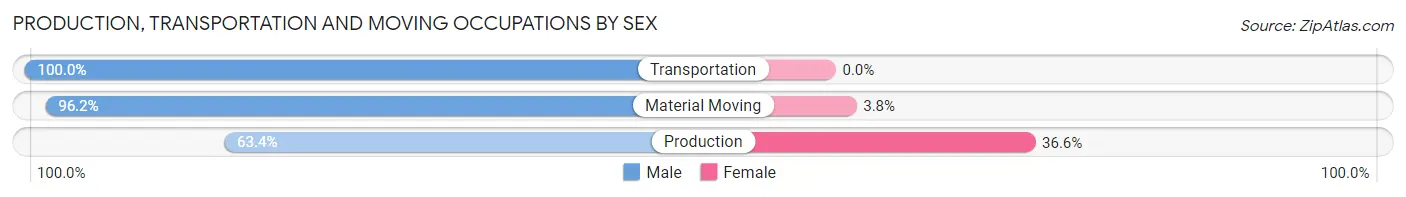
| Occupation | Male | Female |
| Production | 45 (63.4%) | 26 (36.6%) |
| Transportation | 70 (100.0%) | 0 (0.0%) |
| Material Moving | 152 (96.2%) | 6 (3.8%) |
| Total (Category) | 267 (89.3%) | 32 (10.7%) |
| Total (Overall) | 4,604 (57.7%) | 3,377 (42.3%) |
Employment Industries by Sex in Greenwood Village
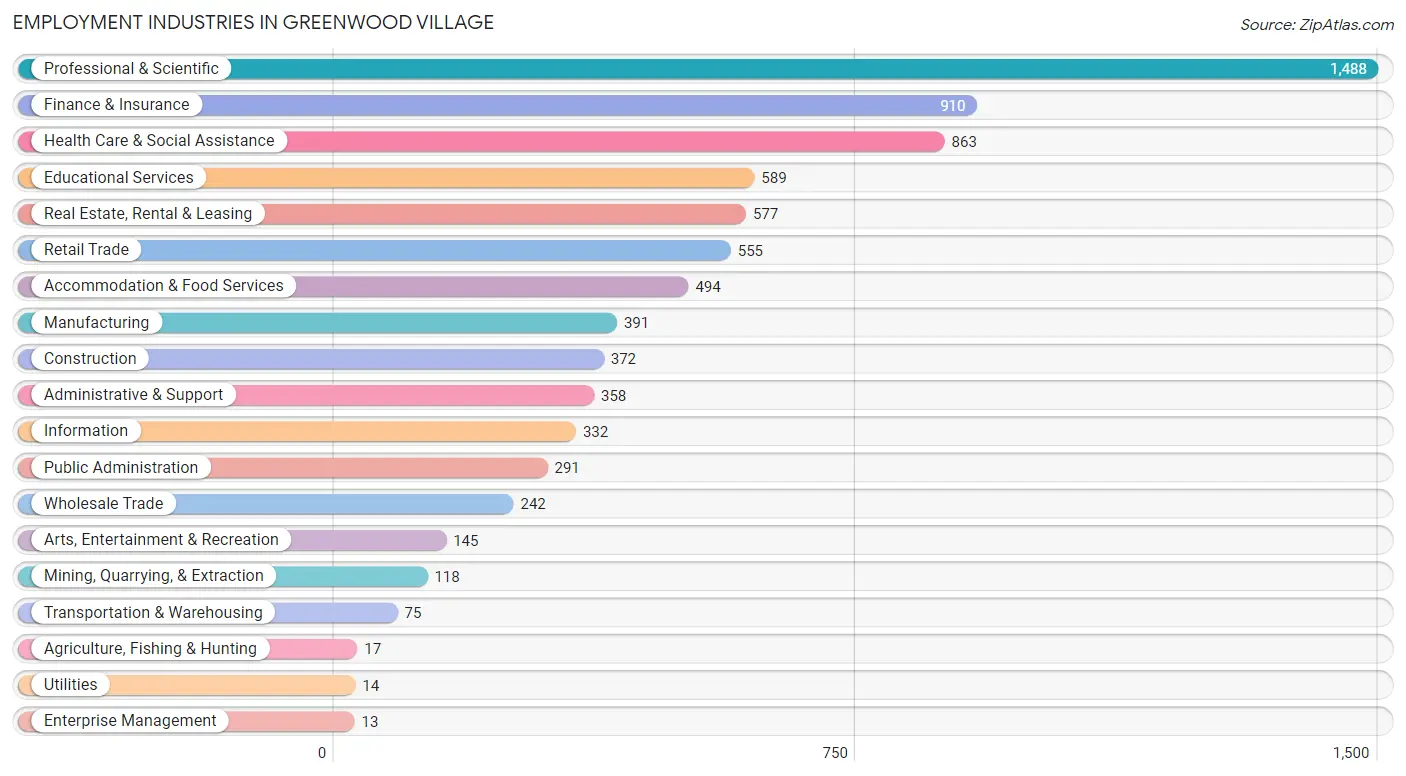
Employment Industries in Greenwood Village
The major employment industries in Greenwood Village include Professional & Scientific (1,488 | 18.6%), Finance & Insurance (910 | 11.4%), Health Care & Social Assistance (863 | 10.8%), Educational Services (589 | 7.4%), and Real Estate, Rental & Leasing (577 | 7.2%).
Employment Industries by Sex in Greenwood Village
The Greenwood Village industries that see more men than women are Mining, Quarrying, & Extraction (100.0%), Manufacturing (83.4%), and Public Administration (83.2%), whereas the industries that tend to have a higher number of women are Health Care & Social Assistance (70.9%), Educational Services (67.6%), and Accommodation & Food Services (58.9%).
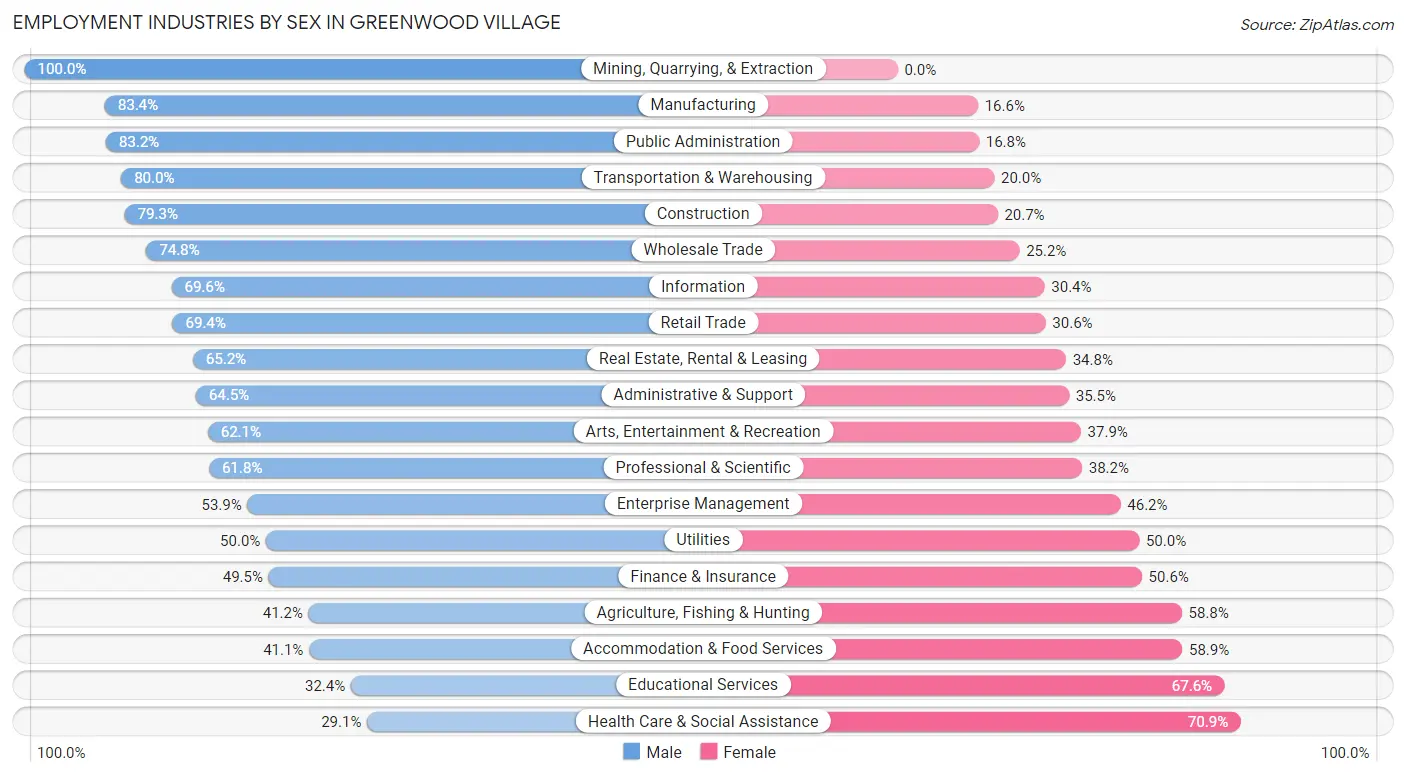
| Industry | Male | Female |
| Agriculture, Fishing & Hunting | 7 (41.2%) | 10 (58.8%) |
| Mining, Quarrying, & Extraction | 118 (100.0%) | 0 (0.0%) |
| Construction | 295 (79.3%) | 77 (20.7%) |
| Manufacturing | 326 (83.4%) | 65 (16.6%) |
| Wholesale Trade | 181 (74.8%) | 61 (25.2%) |
| Retail Trade | 385 (69.4%) | 170 (30.6%) |
| Transportation & Warehousing | 60 (80.0%) | 15 (20.0%) |
| Utilities | 7 (50.0%) | 7 (50.0%) |
| Information | 231 (69.6%) | 101 (30.4%) |
| Finance & Insurance | 450 (49.4%) | 460 (50.5%) |
| Real Estate, Rental & Leasing | 376 (65.2%) | 201 (34.8%) |
| Professional & Scientific | 920 (61.8%) | 568 (38.2%) |
| Enterprise Management | 7 (53.8%) | 6 (46.2%) |
| Administrative & Support | 231 (64.5%) | 127 (35.5%) |
| Educational Services | 191 (32.4%) | 398 (67.6%) |
| Health Care & Social Assistance | 251 (29.1%) | 612 (70.9%) |
| Arts, Entertainment & Recreation | 90 (62.1%) | 55 (37.9%) |
| Accommodation & Food Services | 203 (41.1%) | 291 (58.9%) |
| Public Administration | 242 (83.2%) | 49 (16.8%) |
| Total | 4,604 (57.7%) | 3,377 (42.3%) |
Education in Greenwood Village
School Enrollment in Greenwood Village
The most common levels of schooling among the 3,854 students in Greenwood Village are high school (1,042 | 27.0%), middle school (792 | 20.5%), and college / undergraduate (726 | 18.8%).
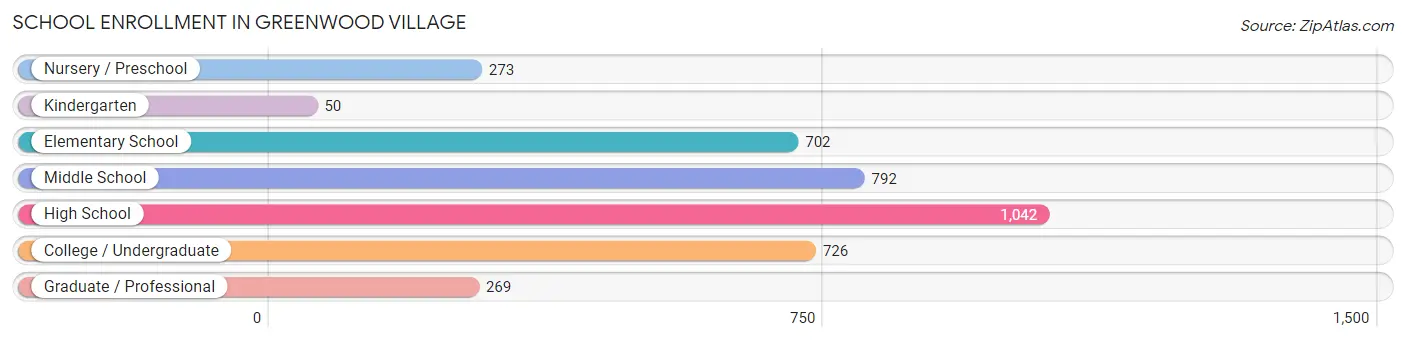
| School Level | # Students | % Students |
| Nursery / Preschool | 273 | 7.1% |
| Kindergarten | 50 | 1.3% |
| Elementary School | 702 | 18.2% |
| Middle School | 792 | 20.5% |
| High School | 1,042 | 27.0% |
| College / Undergraduate | 726 | 18.8% |
| Graduate / Professional | 269 | 7.0% |
| Total | 3,854 | 100.0% |
School Enrollment by Age by Funding Source in Greenwood Village
Out of a total of 3,854 students who are enrolled in schools in Greenwood Village, 1,060 (27.5%) attend a private institution, while the remaining 2,794 (72.5%) are enrolled in public schools. The age group of 18 to 19 year olds has the highest likelihood of being enrolled in private schools, with 212 (56.4% in the age bracket) enrolled. Conversely, the age group of 35 years and over has the lowest likelihood of being enrolled in a private school, with 183 (93.4% in the age bracket) attending a public institution.
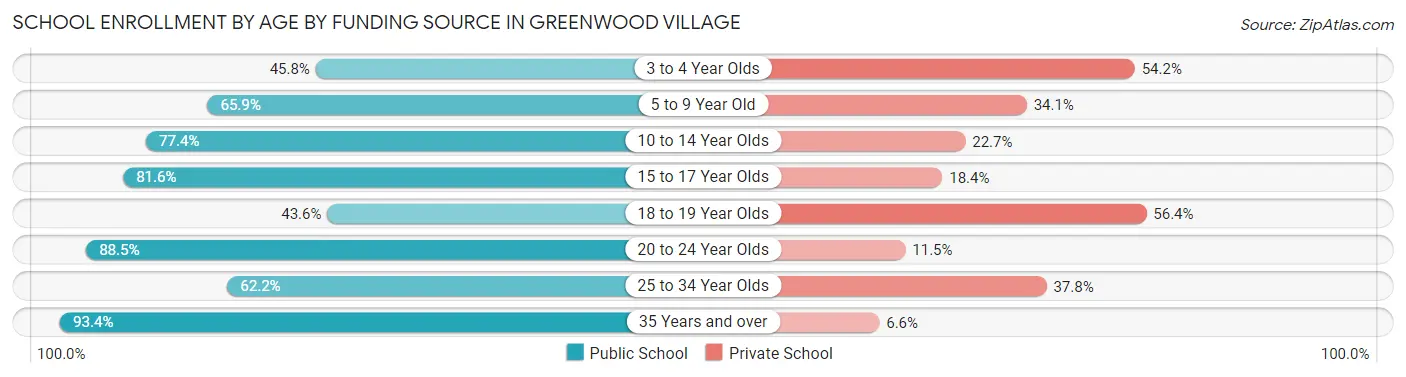
| Age Bracket | Public School | Private School |
| 3 to 4 Year Olds | 38 (45.8%) | 45 (54.2%) |
| 5 to 9 Year Old | 580 (65.9%) | 300 (34.1%) |
| 10 to 14 Year Olds | 782 (77.3%) | 229 (22.7%) |
| 15 to 17 Year Olds | 600 (81.6%) | 135 (18.4%) |
| 18 to 19 Year Olds | 164 (43.6%) | 212 (56.4%) |
| 20 to 24 Year Olds | 308 (88.5%) | 40 (11.5%) |
| 25 to 34 Year Olds | 140 (62.2%) | 85 (37.8%) |
| 35 Years and over | 183 (93.4%) | 13 (6.6%) |
| Total | 2,794 (72.5%) | 1,060 (27.5%) |
Educational Attainment by Field of Study in Greenwood Village
Business (2,519 | 26.0%), engineering (916 | 9.5%), social sciences (803 | 8.3%), bio, nature & agricultural (740 | 7.6%), and science & technology (678 | 7.0%) are the most common fields of study among 9,695 individuals in Greenwood Village who have obtained a bachelor's degree or higher.
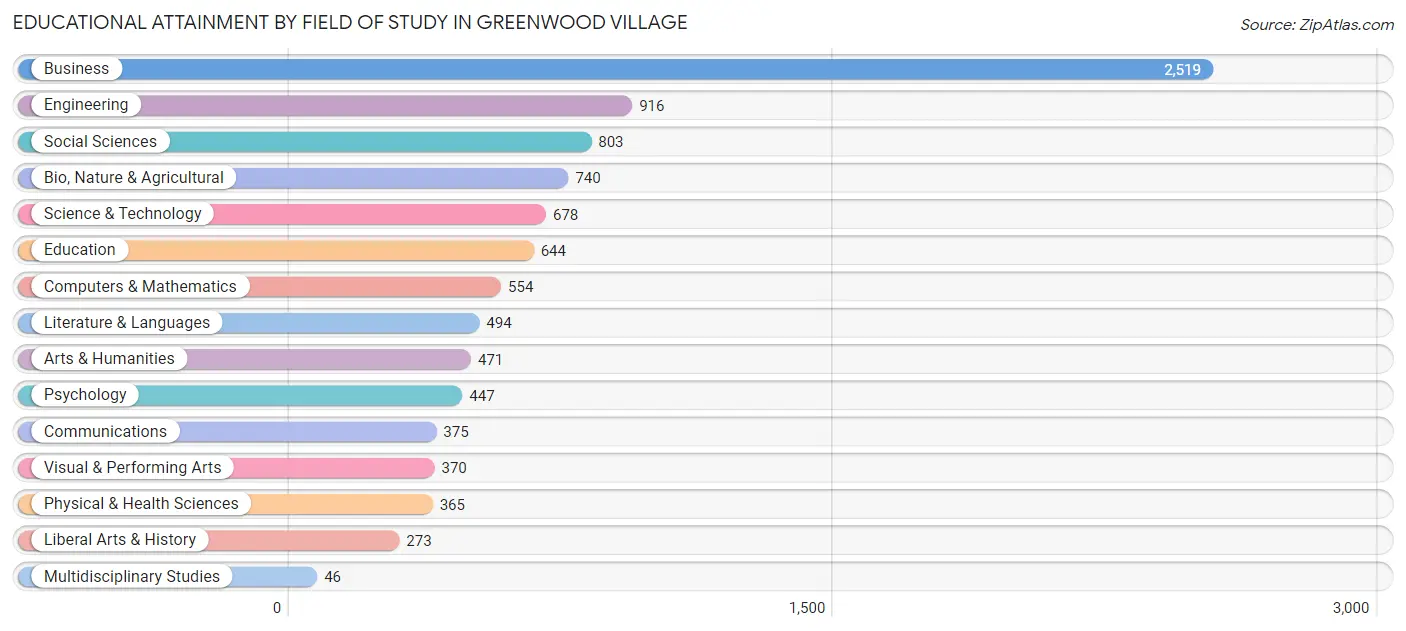
| Field of Study | # Graduates | % Graduates |
| Computers & Mathematics | 554 | 5.7% |
| Bio, Nature & Agricultural | 740 | 7.6% |
| Physical & Health Sciences | 365 | 3.8% |
| Psychology | 447 | 4.6% |
| Social Sciences | 803 | 8.3% |
| Engineering | 916 | 9.5% |
| Multidisciplinary Studies | 46 | 0.5% |
| Science & Technology | 678 | 7.0% |
| Business | 2,519 | 26.0% |
| Education | 644 | 6.6% |
| Literature & Languages | 494 | 5.1% |
| Liberal Arts & History | 273 | 2.8% |
| Visual & Performing Arts | 370 | 3.8% |
| Communications | 375 | 3.9% |
| Arts & Humanities | 471 | 4.9% |
| Total | 9,695 | 100.0% |
Transportation & Commute in Greenwood Village
Vehicle Availability by Sex in Greenwood Village
The most prevalent vehicle ownership categories in Greenwood Village are males with 2 vehicles (1,816, accounting for 39.6%) and females with 2 vehicles (1,148, making up 55.2%).
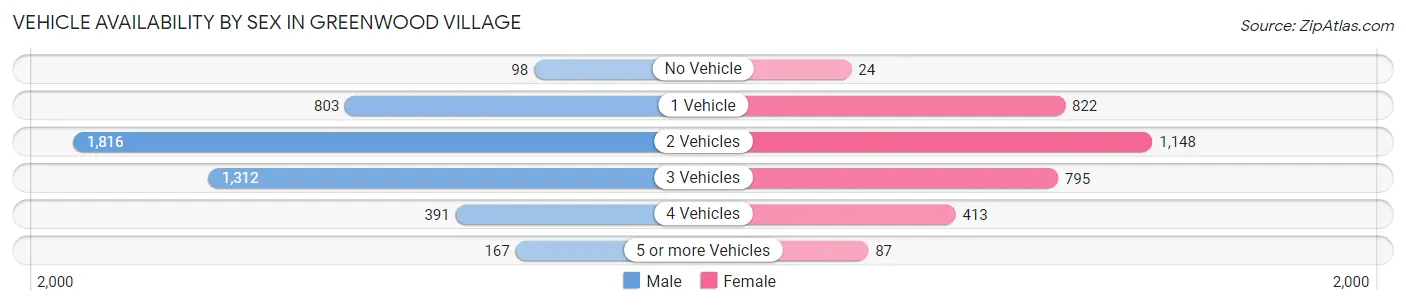
| Vehicles Available | Male | Female |
| No Vehicle | 98 (2.1%) | 24 (0.7%) |
| 1 Vehicle | 803 (17.5%) | 822 (25.0%) |
| 2 Vehicles | 1,816 (39.6%) | 1,148 (34.9%) |
| 3 Vehicles | 1,312 (28.6%) | 795 (24.2%) |
| 4 Vehicles | 391 (8.5%) | 413 (12.6%) |
| 5 or more Vehicles | 167 (3.6%) | 87 (2.6%) |
| Total | 4,587 (100.0%) | 3,289 (100.0%) |
Commute Time in Greenwood Village
The most frequently occuring commute durations in Greenwood Village are 15 to 19 minutes (1,253 commuters, 21.9%), 20 to 24 minutes (864 commuters, 15.1%), and 5 to 9 minutes (831 commuters, 14.5%).
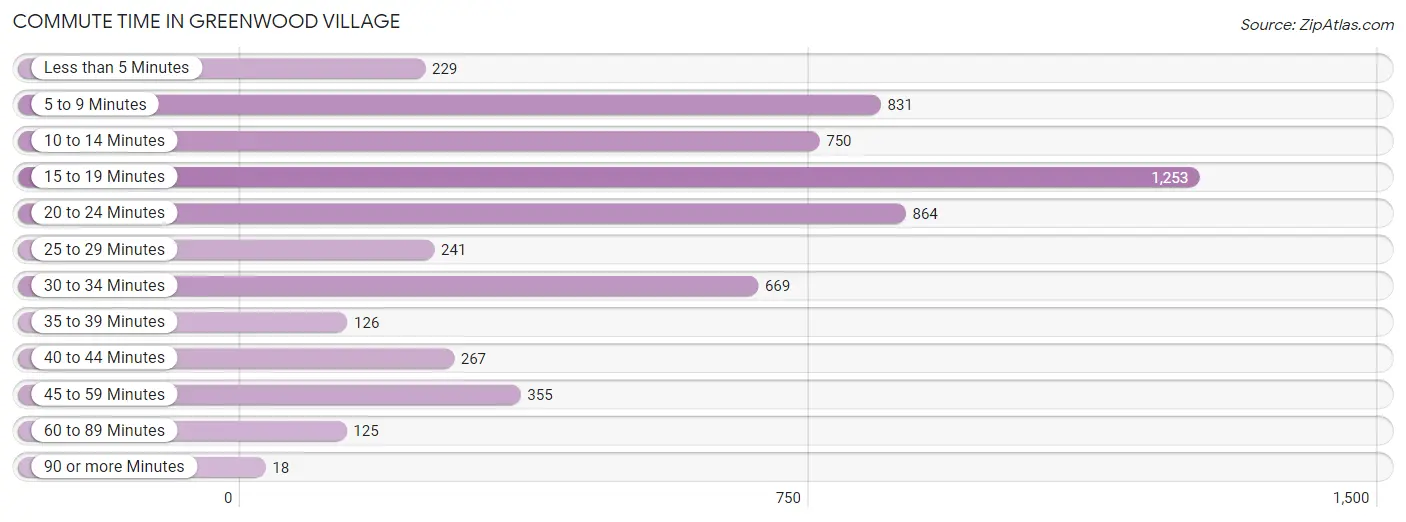
| Commute Time | # Commuters | % Commuters |
| Less than 5 Minutes | 229 | 4.0% |
| 5 to 9 Minutes | 831 | 14.5% |
| 10 to 14 Minutes | 750 | 13.1% |
| 15 to 19 Minutes | 1,253 | 21.9% |
| 20 to 24 Minutes | 864 | 15.1% |
| 25 to 29 Minutes | 241 | 4.2% |
| 30 to 34 Minutes | 669 | 11.7% |
| 35 to 39 Minutes | 126 | 2.2% |
| 40 to 44 Minutes | 267 | 4.7% |
| 45 to 59 Minutes | 355 | 6.2% |
| 60 to 89 Minutes | 125 | 2.2% |
| 90 or more Minutes | 18 | 0.3% |
Commute Time by Sex in Greenwood Village
The most common commute times in Greenwood Village are 15 to 19 minutes (604 commuters, 17.2%) for males and 15 to 19 minutes (649 commuters, 29.3%) for females.
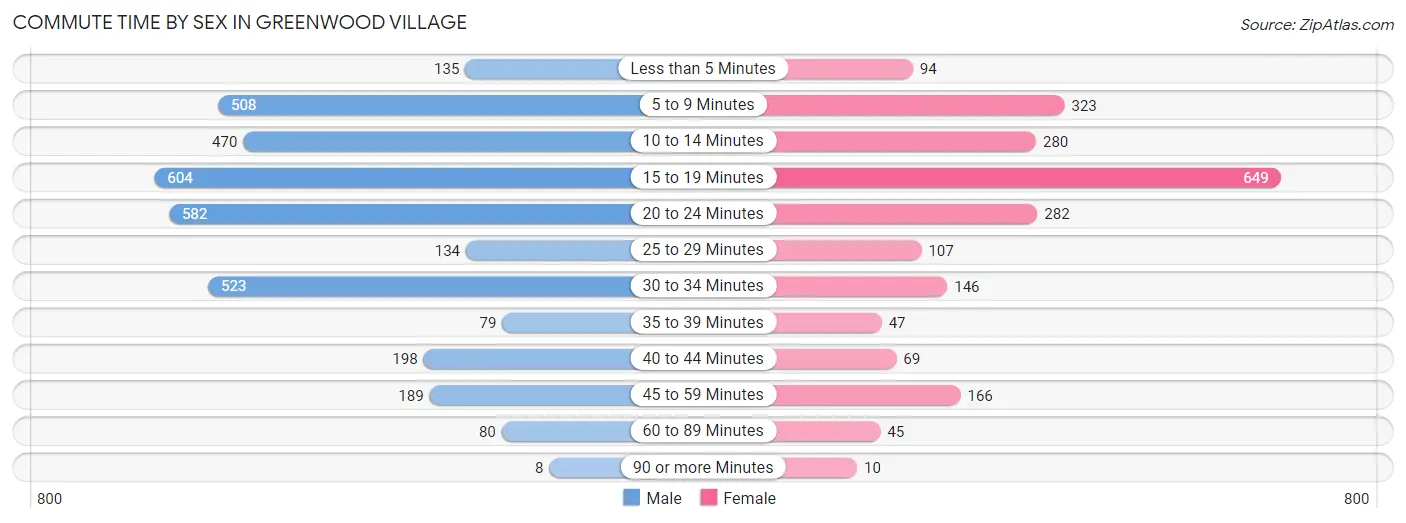
| Commute Time | Male | Female |
| Less than 5 Minutes | 135 (3.8%) | 94 (4.2%) |
| 5 to 9 Minutes | 508 (14.5%) | 323 (14.6%) |
| 10 to 14 Minutes | 470 (13.4%) | 280 (12.6%) |
| 15 to 19 Minutes | 604 (17.2%) | 649 (29.3%) |
| 20 to 24 Minutes | 582 (16.6%) | 282 (12.7%) |
| 25 to 29 Minutes | 134 (3.8%) | 107 (4.8%) |
| 30 to 34 Minutes | 523 (14.9%) | 146 (6.6%) |
| 35 to 39 Minutes | 79 (2.2%) | 47 (2.1%) |
| 40 to 44 Minutes | 198 (5.6%) | 69 (3.1%) |
| 45 to 59 Minutes | 189 (5.4%) | 166 (7.5%) |
| 60 to 89 Minutes | 80 (2.3%) | 45 (2.0%) |
| 90 or more Minutes | 8 (0.2%) | 10 (0.4%) |
Time of Departure to Work by Sex in Greenwood Village
The most frequent times of departure to work in Greenwood Village are 8:00 AM to 8:29 AM (658, 18.8%) for males and 8:00 AM to 8:29 AM (446, 20.1%) for females.
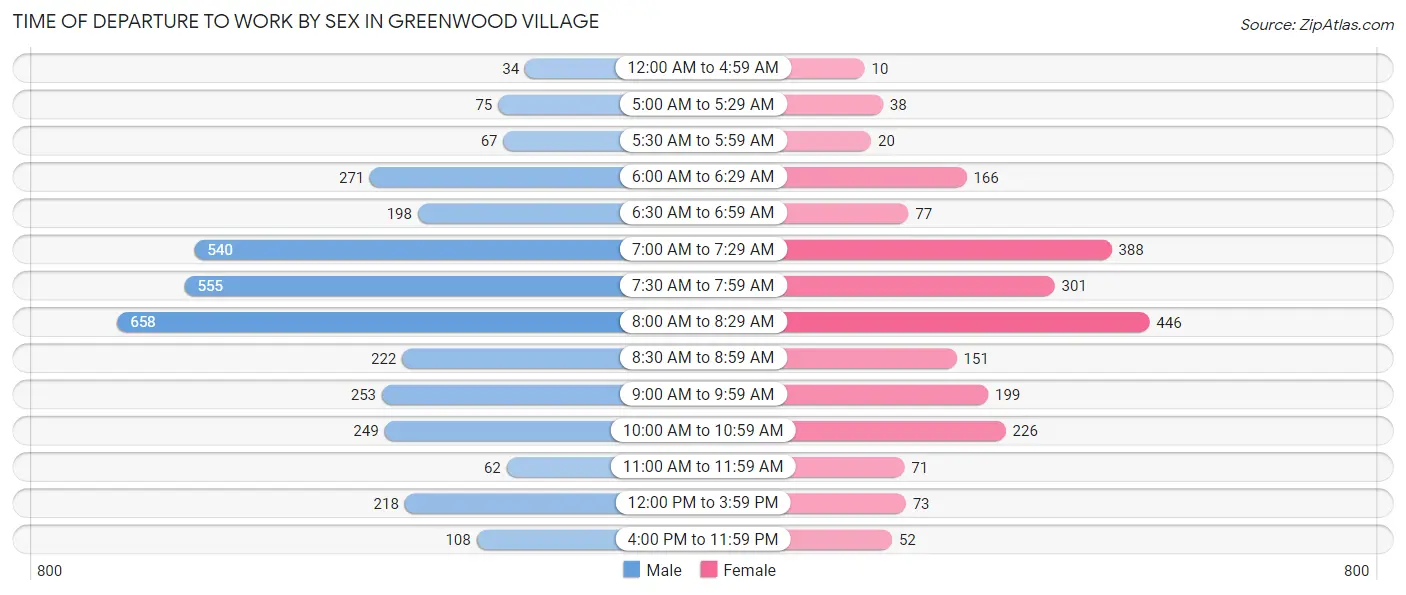
| Time of Departure | Male | Female |
| 12:00 AM to 4:59 AM | 34 (1.0%) | 10 (0.4%) |
| 5:00 AM to 5:29 AM | 75 (2.1%) | 38 (1.7%) |
| 5:30 AM to 5:59 AM | 67 (1.9%) | 20 (0.9%) |
| 6:00 AM to 6:29 AM | 271 (7.7%) | 166 (7.5%) |
| 6:30 AM to 6:59 AM | 198 (5.6%) | 77 (3.5%) |
| 7:00 AM to 7:29 AM | 540 (15.4%) | 388 (17.5%) |
| 7:30 AM to 7:59 AM | 555 (15.8%) | 301 (13.6%) |
| 8:00 AM to 8:29 AM | 658 (18.8%) | 446 (20.1%) |
| 8:30 AM to 8:59 AM | 222 (6.3%) | 151 (6.8%) |
| 9:00 AM to 9:59 AM | 253 (7.2%) | 199 (9.0%) |
| 10:00 AM to 10:59 AM | 249 (7.1%) | 226 (10.2%) |
| 11:00 AM to 11:59 AM | 62 (1.8%) | 71 (3.2%) |
| 12:00 PM to 3:59 PM | 218 (6.2%) | 73 (3.3%) |
| 4:00 PM to 11:59 PM | 108 (3.1%) | 52 (2.3%) |
| Total | 3,510 (100.0%) | 2,218 (100.0%) |
Housing Occupancy in Greenwood Village
Occupancy by Ownership in Greenwood Village
Of the total 6,445 dwellings in Greenwood Village, owner-occupied units account for 4,188 (65.0%), while renter-occupied units make up 2,257 (35.0%).
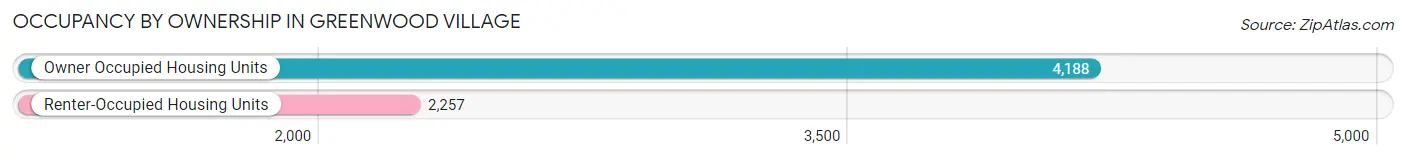
| Occupancy | # Housing Units | % Housing Units |
| Owner Occupied Housing Units | 4,188 | 65.0% |
| Renter-Occupied Housing Units | 2,257 | 35.0% |
| Total Occupied Housing Units | 6,445 | 100.0% |
Occupancy by Household Size in Greenwood Village
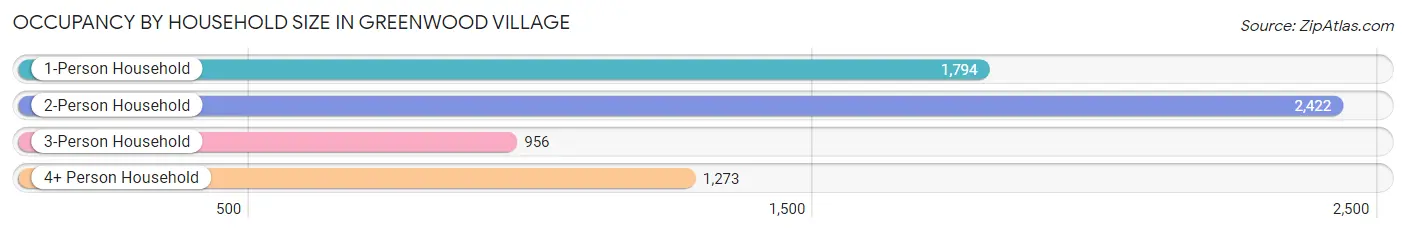
| Household Size | # Housing Units | % Housing Units |
| 1-Person Household | 1,794 | 27.8% |
| 2-Person Household | 2,422 | 37.6% |
| 3-Person Household | 956 | 14.8% |
| 4+ Person Household | 1,273 | 19.8% |
| Total Housing Units | 6,445 | 100.0% |
Occupancy by Ownership by Household Size in Greenwood Village
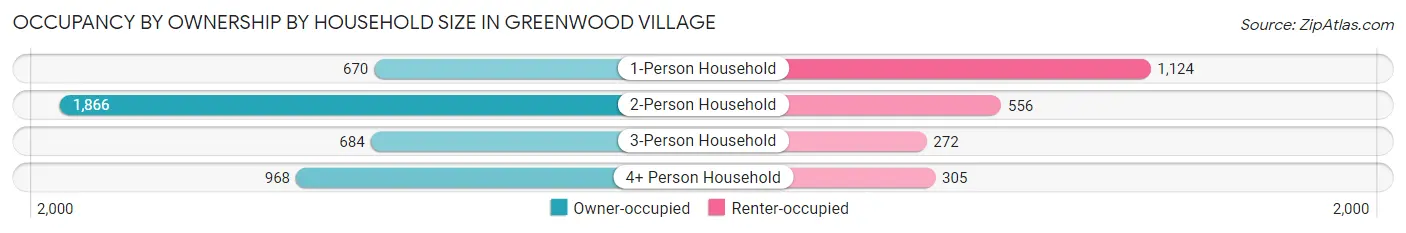
| Household Size | Owner-occupied | Renter-occupied |
| 1-Person Household | 670 (37.3%) | 1,124 (62.6%) |
| 2-Person Household | 1,866 (77.0%) | 556 (23.0%) |
| 3-Person Household | 684 (71.6%) | 272 (28.4%) |
| 4+ Person Household | 968 (76.0%) | 305 (24.0%) |
| Total Housing Units | 4,188 (65.0%) | 2,257 (35.0%) |
Occupancy by Educational Attainment in Greenwood Village
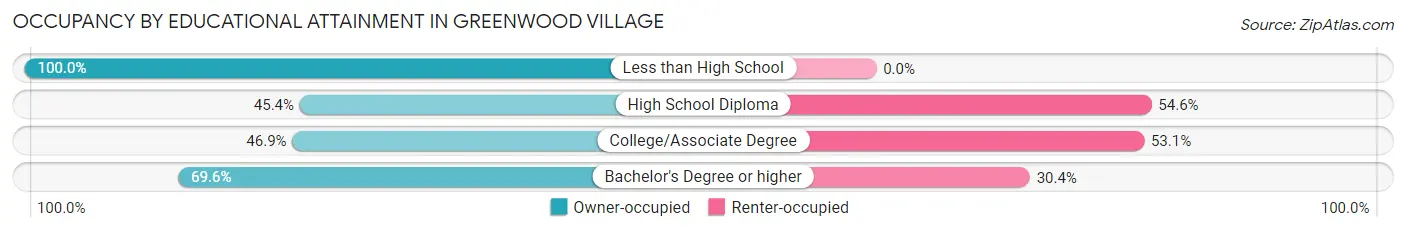
| Household Size | Owner-occupied | Renter-occupied |
| Less than High School | 23 (100.0%) | 0 (0.0%) |
| High School Diploma | 184 (45.4%) | 221 (54.6%) |
| College/Associate Degree | 423 (46.9%) | 479 (53.1%) |
| Bachelor's Degree or higher | 3,558 (69.6%) | 1,557 (30.4%) |
Occupancy by Age of Householder in Greenwood Village
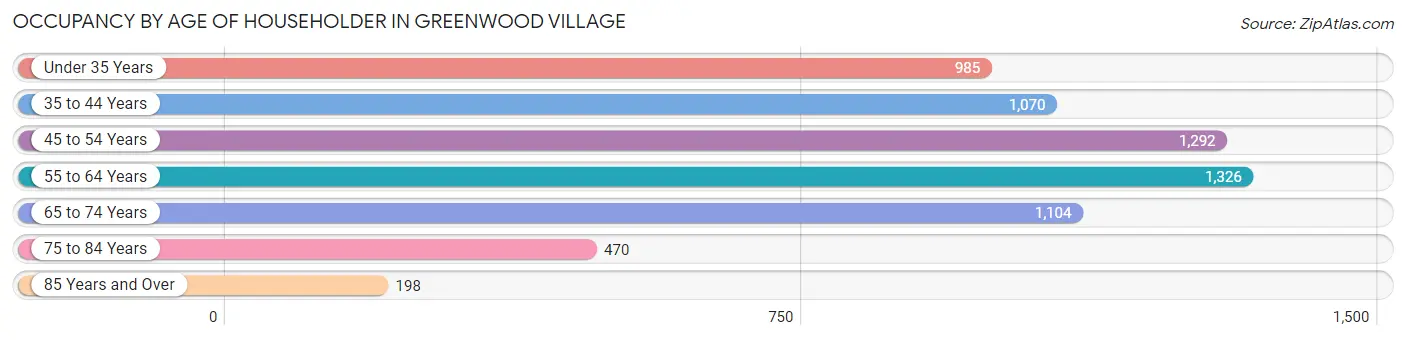
| Age Bracket | # Households | % Households |
| Under 35 Years | 985 | 15.3% |
| 35 to 44 Years | 1,070 | 16.6% |
| 45 to 54 Years | 1,292 | 20.1% |
| 55 to 64 Years | 1,326 | 20.6% |
| 65 to 74 Years | 1,104 | 17.1% |
| 75 to 84 Years | 470 | 7.3% |
| 85 Years and Over | 198 | 3.1% |
| Total | 6,445 | 100.0% |
Housing Finances in Greenwood Village
Median Income by Occupancy in Greenwood Village
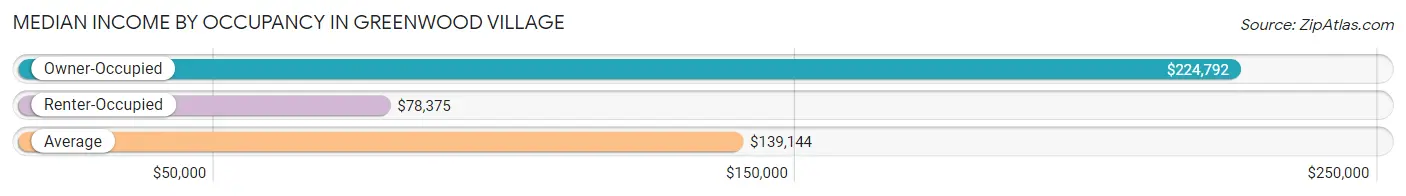
| Occupancy Type | # Households | Median Income |
| Owner-Occupied | 4,188 (65.0%) | $224,792 |
| Renter-Occupied | 2,257 (35.0%) | $78,375 |
| Average | 6,445 (100.0%) | $139,144 |
Occupancy by Householder Income Bracket in Greenwood Village
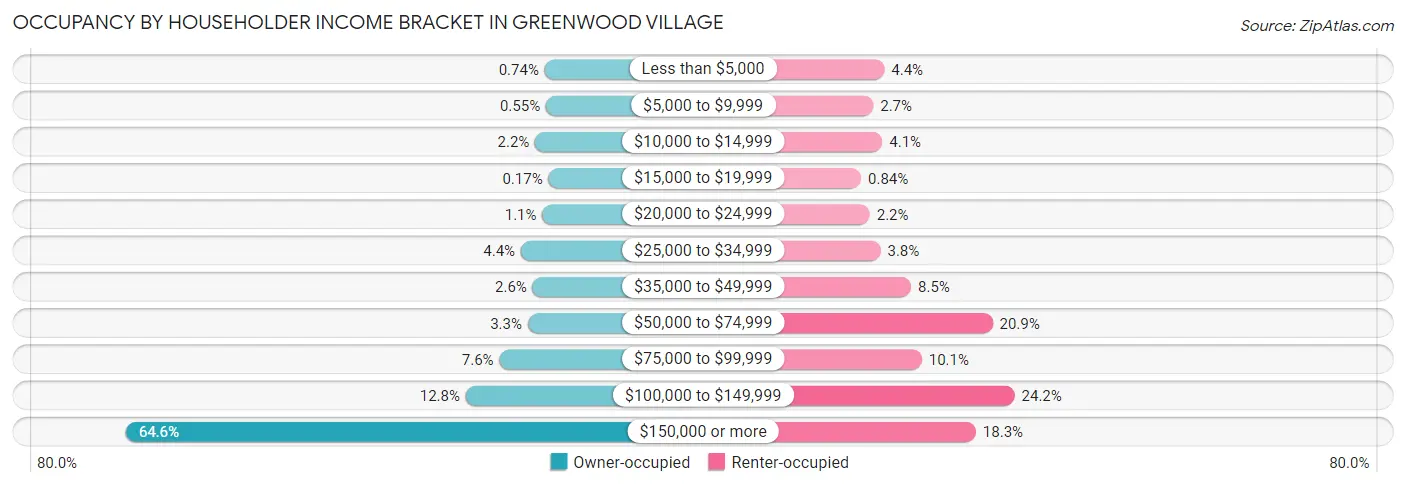
| Income Bracket | Owner-occupied | Renter-occupied |
| Less than $5,000 | 31 (0.7%) | 99 (4.4%) |
| $5,000 to $9,999 | 23 (0.5%) | 61 (2.7%) |
| $10,000 to $14,999 | 92 (2.2%) | 92 (4.1%) |
| $15,000 to $19,999 | 7 (0.2%) | 19 (0.8%) |
| $20,000 to $24,999 | 46 (1.1%) | 49 (2.2%) |
| $25,000 to $34,999 | 183 (4.4%) | 86 (3.8%) |
| $35,000 to $49,999 | 108 (2.6%) | 191 (8.5%) |
| $50,000 to $74,999 | 139 (3.3%) | 471 (20.9%) |
| $75,000 to $99,999 | 320 (7.6%) | 228 (10.1%) |
| $100,000 to $149,999 | 535 (12.8%) | 547 (24.2%) |
| $150,000 or more | 2,704 (64.6%) | 414 (18.3%) |
| Total | 4,188 (100.0%) | 2,257 (100.0%) |
Monthly Housing Cost Tiers in Greenwood Village
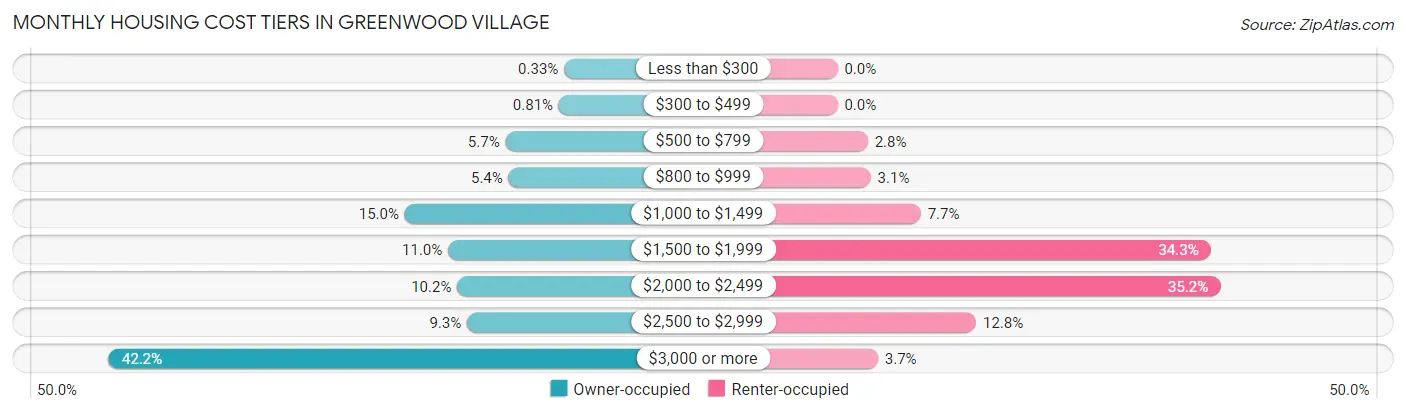
| Monthly Cost | Owner-occupied | Renter-occupied |
| Less than $300 | 14 (0.3%) | 0 (0.0%) |
| $300 to $499 | 34 (0.8%) | 0 (0.0%) |
| $500 to $799 | 240 (5.7%) | 63 (2.8%) |
| $800 to $999 | 228 (5.4%) | 69 (3.1%) |
| $1,000 to $1,499 | 628 (15.0%) | 173 (7.7%) |
| $1,500 to $1,999 | 461 (11.0%) | 775 (34.3%) |
| $2,000 to $2,499 | 426 (10.2%) | 795 (35.2%) |
| $2,500 to $2,999 | 388 (9.3%) | 288 (12.8%) |
| $3,000 or more | 1,769 (42.2%) | 84 (3.7%) |
| Total | 4,188 (100.0%) | 2,257 (100.0%) |
Physical Housing Characteristics in Greenwood Village
Housing Structures in Greenwood Village
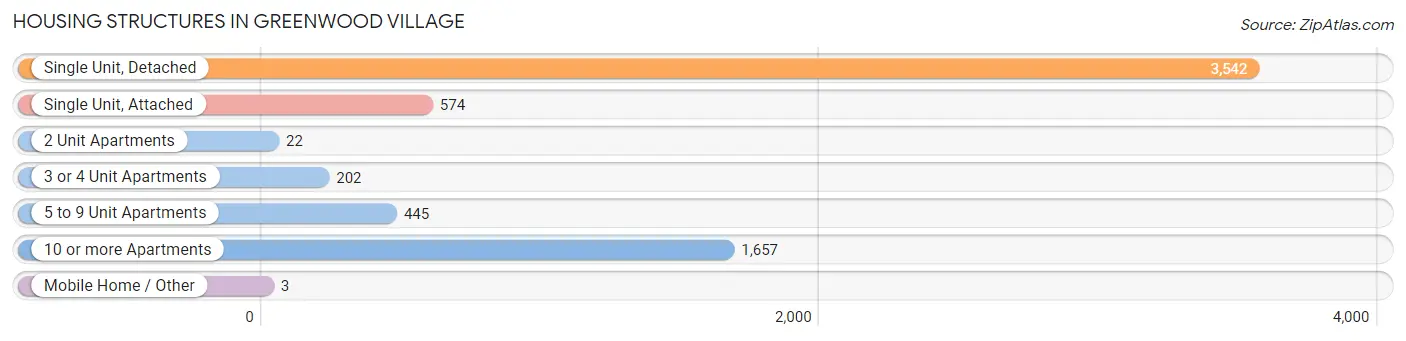
| Structure Type | # Housing Units | % Housing Units |
| Single Unit, Detached | 3,542 | 55.0% |
| Single Unit, Attached | 574 | 8.9% |
| 2 Unit Apartments | 22 | 0.3% |
| 3 or 4 Unit Apartments | 202 | 3.1% |
| 5 to 9 Unit Apartments | 445 | 6.9% |
| 10 or more Apartments | 1,657 | 25.7% |
| Mobile Home / Other | 3 | 0.1% |
| Total | 6,445 | 100.0% |
Housing Structures by Occupancy in Greenwood Village
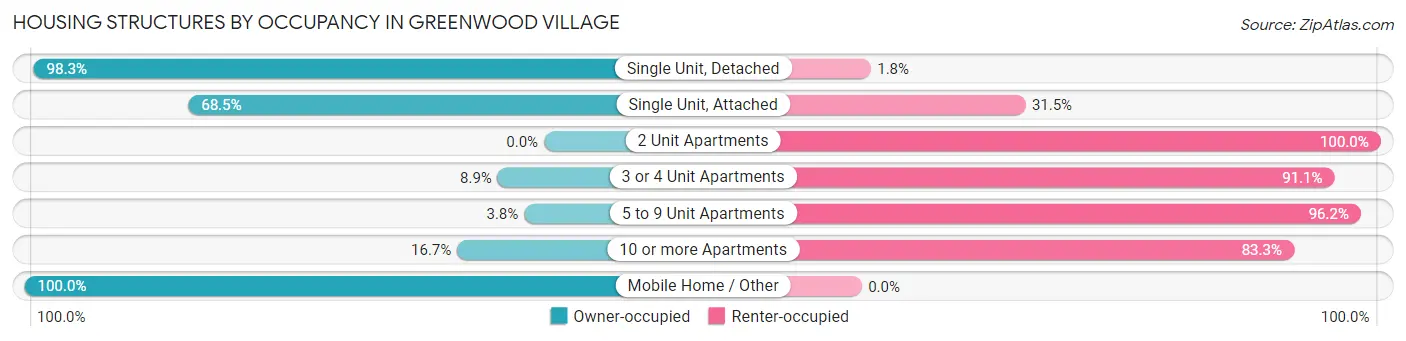
| Structure Type | Owner-occupied | Renter-occupied |
| Single Unit, Detached | 3,480 (98.3%) | 62 (1.8%) |
| Single Unit, Attached | 393 (68.5%) | 181 (31.5%) |
| 2 Unit Apartments | 0 (0.0%) | 22 (100.0%) |
| 3 or 4 Unit Apartments | 18 (8.9%) | 184 (91.1%) |
| 5 to 9 Unit Apartments | 17 (3.8%) | 428 (96.2%) |
| 10 or more Apartments | 277 (16.7%) | 1,380 (83.3%) |
| Mobile Home / Other | 3 (100.0%) | 0 (0.0%) |
| Total | 4,188 (65.0%) | 2,257 (35.0%) |
Housing Structures by Number of Rooms in Greenwood Village
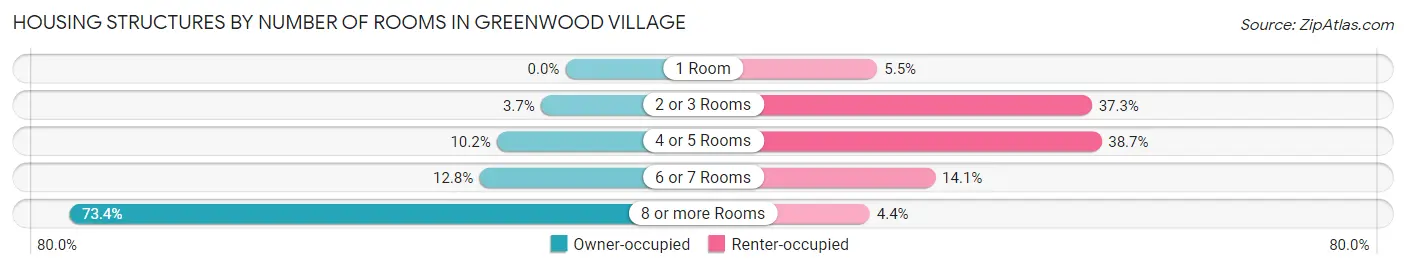
| Number of Rooms | Owner-occupied | Renter-occupied |
| 1 Room | 0 (0.0%) | 125 (5.5%) |
| 2 or 3 Rooms | 153 (3.6%) | 841 (37.3%) |
| 4 or 5 Rooms | 426 (10.2%) | 873 (38.7%) |
| 6 or 7 Rooms | 534 (12.8%) | 318 (14.1%) |
| 8 or more Rooms | 3,075 (73.4%) | 100 (4.4%) |
| Total | 4,188 (100.0%) | 2,257 (100.0%) |
Housing Structure by Heating Type in Greenwood Village
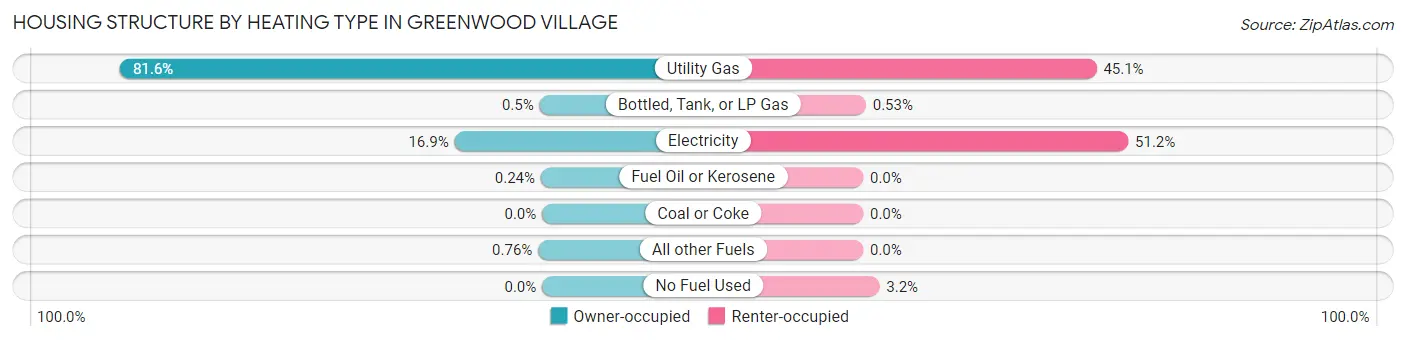
| Heating Type | Owner-occupied | Renter-occupied |
| Utility Gas | 3,416 (81.6%) | 1,018 (45.1%) |
| Bottled, Tank, or LP Gas | 21 (0.5%) | 12 (0.5%) |
| Electricity | 709 (16.9%) | 1,156 (51.2%) |
| Fuel Oil or Kerosene | 10 (0.2%) | 0 (0.0%) |
| Coal or Coke | 0 (0.0%) | 0 (0.0%) |
| All other Fuels | 32 (0.8%) | 0 (0.0%) |
| No Fuel Used | 0 (0.0%) | 71 (3.2%) |
| Total | 4,188 (100.0%) | 2,257 (100.0%) |
Household Vehicle Usage in Greenwood Village
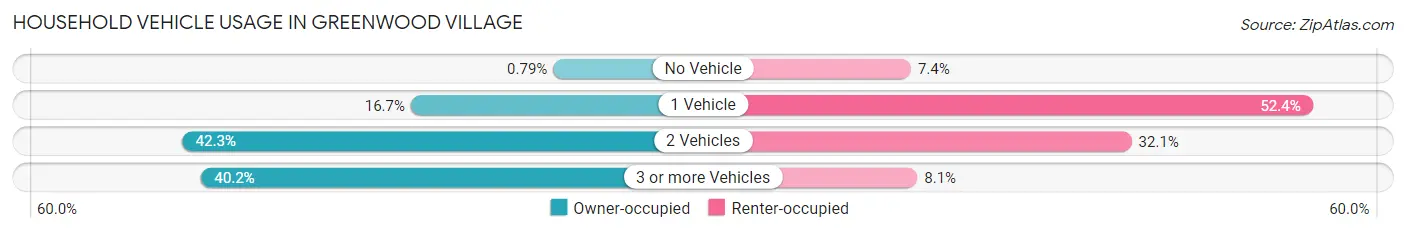
| Vehicles per Household | Owner-occupied | Renter-occupied |
| No Vehicle | 33 (0.8%) | 167 (7.4%) |
| 1 Vehicle | 701 (16.7%) | 1,182 (52.4%) |
| 2 Vehicles | 1,771 (42.3%) | 725 (32.1%) |
| 3 or more Vehicles | 1,683 (40.2%) | 183 (8.1%) |
| Total | 4,188 (100.0%) | 2,257 (100.0%) |
Real Estate & Mortgages in Greenwood Village
Real Estate and Mortgage Overview in Greenwood Village
| Characteristic | Without Mortgage | With Mortgage |
| Housing Units | 1,634 | 2,554 |
| Median Property Value | $1,150,600 | $1,131,700 |
| Median Household Income | $160,500 | $1,860 |
| Monthly Housing Costs | $1,276 | $1,665 |
| Real Estate Taxes | $6,366 | $17 |
Property Value by Mortgage Status in Greenwood Village
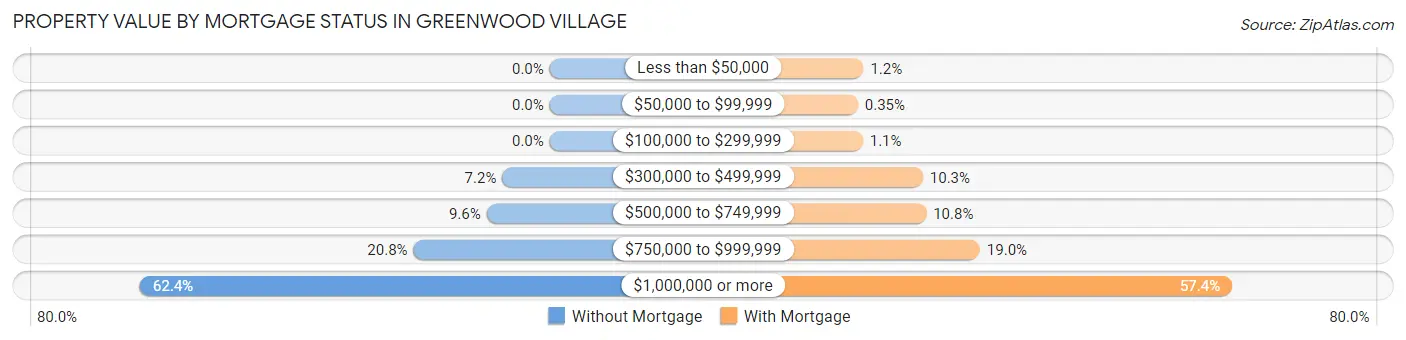
| Property Value | Without Mortgage | With Mortgage |
| Less than $50,000 | 0 (0.0%) | 31 (1.2%) |
| $50,000 to $99,999 | 0 (0.0%) | 9 (0.4%) |
| $100,000 to $299,999 | 0 (0.0%) | 28 (1.1%) |
| $300,000 to $499,999 | 118 (7.2%) | 262 (10.3%) |
| $500,000 to $749,999 | 157 (9.6%) | 275 (10.8%) |
| $750,000 to $999,999 | 339 (20.7%) | 484 (19.0%) |
| $1,000,000 or more | 1,020 (62.4%) | 1,465 (57.4%) |
| Total | 1,634 (100.0%) | 2,554 (100.0%) |
Household Income by Mortgage Status in Greenwood Village
| Household Income | Without Mortgage | With Mortgage |
| Less than $10,000 | 36 (2.2%) | 35 (1.4%) |
| $10,000 to $24,999 | 33 (2.0%) | 18 (0.7%) |
| $25,000 to $34,999 | 140 (8.6%) | 112 (4.4%) |
| $35,000 to $49,999 | 60 (3.7%) | 43 (1.7%) |
| $50,000 to $74,999 | 78 (4.8%) | 48 (1.9%) |
| $75,000 to $99,999 | 213 (13.0%) | 61 (2.4%) |
| $100,000 to $149,999 | 230 (14.1%) | 107 (4.2%) |
| $150,000 or more | 844 (51.6%) | 305 (11.9%) |
| Total | 1,634 (100.0%) | 2,554 (100.0%) |
Property Value to Household Income Ratio in Greenwood Village
| Value-to-Income Ratio | Without Mortgage | With Mortgage |
| Less than 2.0x | 168 (10.3%) | 250,001 (9,788.6%) |
| 2.0x to 2.9x | 117 (7.2%) | 419 (16.4%) |
| 3.0x to 3.9x | 161 (9.9%) | 405 (15.9%) |
| 4.0x or more | 1,173 (71.8%) | 430 (16.8%) |
| Total | 1,634 (100.0%) | 2,554 (100.0%) |
Real Estate Taxes by Mortgage Status in Greenwood Village
| Property Taxes | Without Mortgage | With Mortgage |
| Less than $800 | 0 (0.0%) | 4 (0.2%) |
| $800 to $1,499 | 8 (0.5%) | 45 (1.8%) |
| $800 to $1,499 | 1,622 (99.3%) | 97 (3.8%) |
| Total | 1,634 (100.0%) | 2,554 (100.0%) |
Health & Disability in Greenwood Village
Health Insurance Coverage by Age in Greenwood Village
| Age Bracket | With Coverage | Without Coverage |
| Under 6 Years | 544 (100.0%) | 0 (0.0%) |
| 6 to 18 Years | 2,621 (98.7%) | 36 (1.3%) |
| 19 to 25 Years | 1,110 (91.4%) | 104 (8.6%) |
| 26 to 34 Years | 1,443 (96.9%) | 46 (3.1%) |
| 35 to 44 Years | 1,694 (94.0%) | 108 (6.0%) |
| 45 to 54 Years | 2,344 (96.5%) | 86 (3.5%) |
| 55 to 64 Years | 2,177 (99.2%) | 17 (0.8%) |
| 65 to 74 Years | 1,907 (100.0%) | 0 (0.0%) |
| 75 Years and older | 1,224 (100.0%) | 0 (0.0%) |
| Total | 15,064 (97.4%) | 397 (2.6%) |
Health Insurance Coverage by Citizenship Status in Greenwood Village
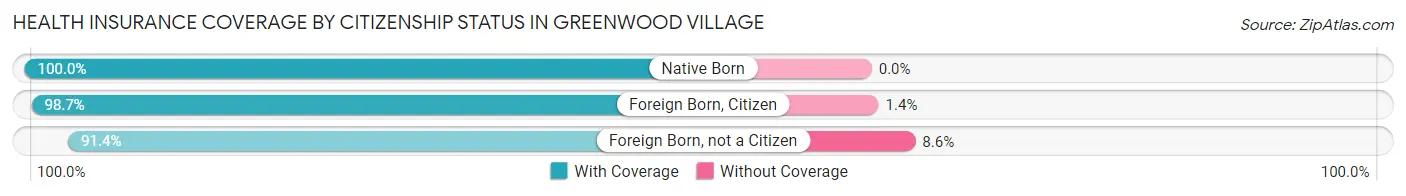
| Citizenship Status | With Coverage | Without Coverage |
| Native Born | 544 (100.0%) | 0 (0.0%) |
| Foreign Born, Citizen | 2,621 (98.7%) | 36 (1.3%) |
| Foreign Born, not a Citizen | 1,110 (91.4%) | 104 (8.6%) |
Health Insurance Coverage by Household Income in Greenwood Village
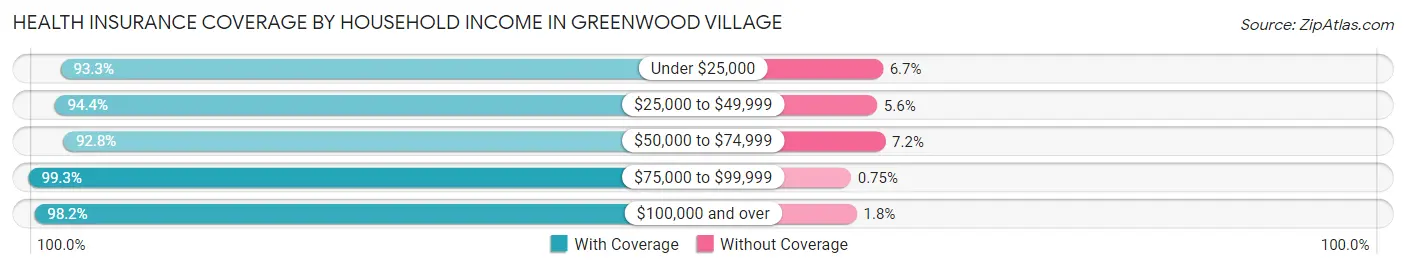
| Household Income | With Coverage | Without Coverage |
| Under $25,000 | 790 (93.3%) | 57 (6.7%) |
| $25,000 to $49,999 | 787 (94.4%) | 47 (5.6%) |
| $50,000 to $74,999 | 904 (92.8%) | 70 (7.2%) |
| $75,000 to $99,999 | 1,053 (99.3%) | 8 (0.7%) |
| $100,000 and over | 11,526 (98.2%) | 215 (1.8%) |
Public vs Private Health Insurance Coverage by Age in Greenwood Village
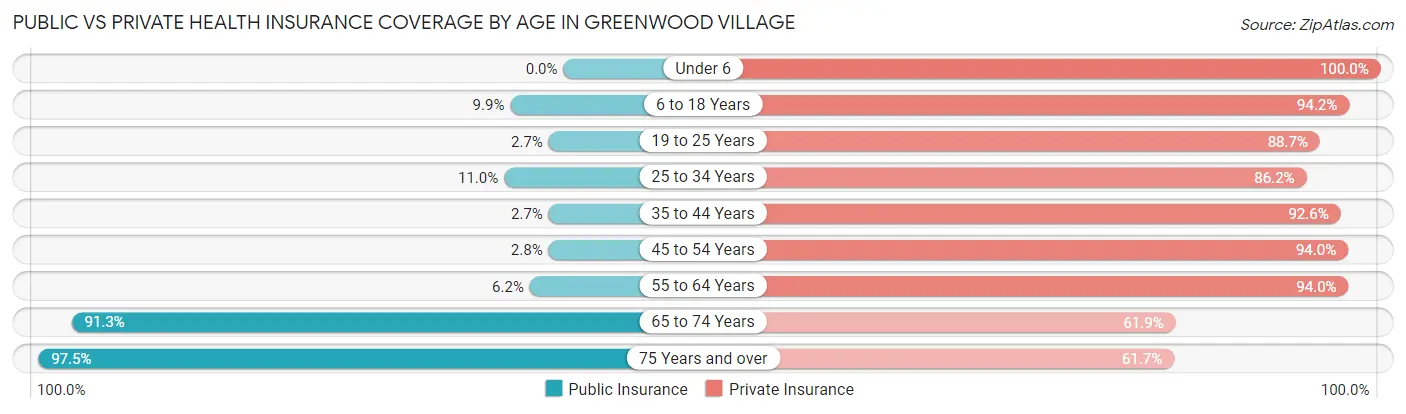
| Age Bracket | Public Insurance | Private Insurance |
| Under 6 | 0 (0.0%) | 544 (100.0%) |
| 6 to 18 Years | 262 (9.9%) | 2,502 (94.2%) |
| 19 to 25 Years | 33 (2.7%) | 1,077 (88.7%) |
| 25 to 34 Years | 164 (11.0%) | 1,284 (86.2%) |
| 35 to 44 Years | 49 (2.7%) | 1,668 (92.6%) |
| 45 to 54 Years | 67 (2.8%) | 2,283 (94.0%) |
| 55 to 64 Years | 137 (6.2%) | 2,063 (94.0%) |
| 65 to 74 Years | 1,741 (91.3%) | 1,181 (61.9%) |
| 75 Years and over | 1,193 (97.5%) | 755 (61.7%) |
| Total | 3,646 (23.6%) | 13,357 (86.4%) |
Disability Status by Sex by Age in Greenwood Village
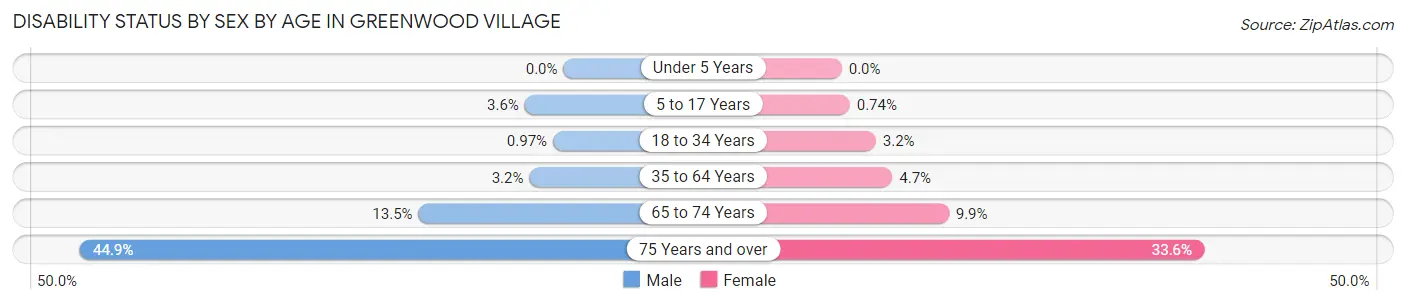
| Age Bracket | Male | Female |
| Under 5 Years | 0 (0.0%) | 0 (0.0%) |
| 5 to 17 Years | 50 (3.6%) | 10 (0.7%) |
| 18 to 34 Years | 15 (1.0%) | 41 (3.2%) |
| 35 to 64 Years | 100 (3.2%) | 153 (4.7%) |
| 65 to 74 Years | 136 (13.5%) | 89 (9.9%) |
| 75 Years and over | 270 (44.9%) | 209 (33.6%) |
Disability Class by Sex by Age in Greenwood Village
Disability Class: Hearing Difficulty
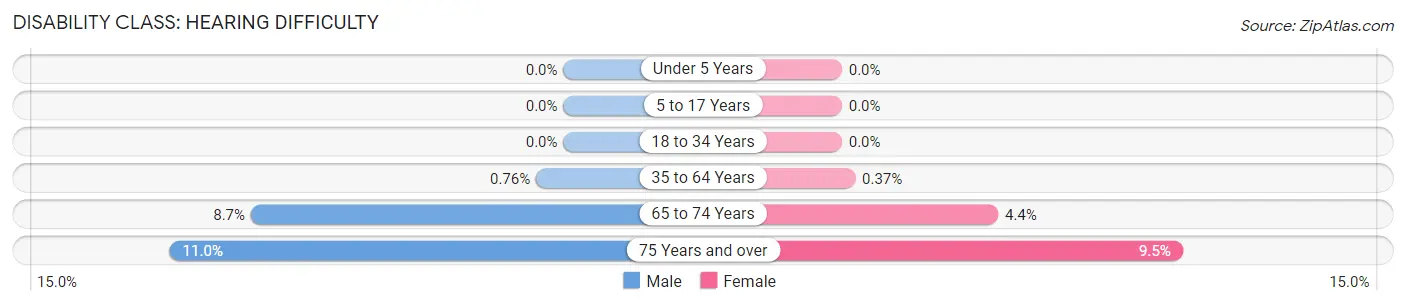
| Age Bracket | Male | Female |
| Under 5 Years | 0 (0.0%) | 0 (0.0%) |
| 5 to 17 Years | 0 (0.0%) | 0 (0.0%) |
| 18 to 34 Years | 0 (0.0%) | 0 (0.0%) |
| 35 to 64 Years | 24 (0.8%) | 12 (0.4%) |
| 65 to 74 Years | 88 (8.7%) | 39 (4.3%) |
| 75 Years and over | 66 (11.0%) | 59 (9.5%) |
Disability Class: Vision Difficulty
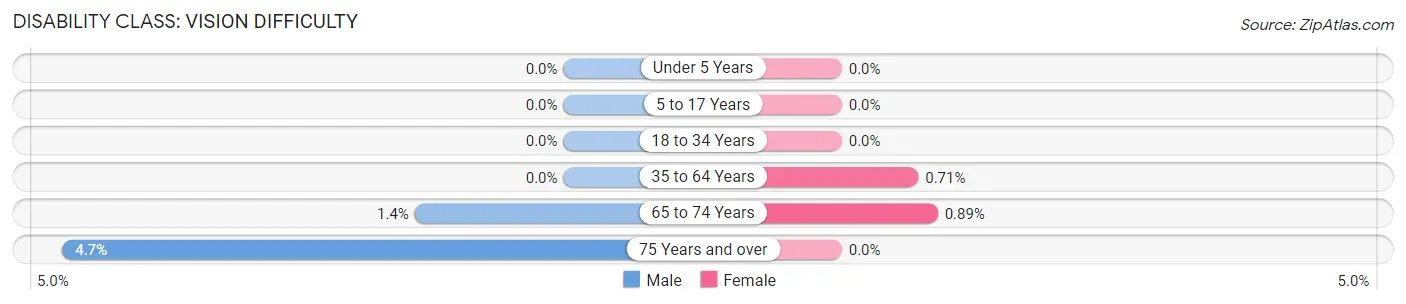
| Age Bracket | Male | Female |
| Under 5 Years | 0 (0.0%) | 0 (0.0%) |
| 5 to 17 Years | 0 (0.0%) | 0 (0.0%) |
| 18 to 34 Years | 0 (0.0%) | 0 (0.0%) |
| 35 to 64 Years | 0 (0.0%) | 23 (0.7%) |
| 65 to 74 Years | 14 (1.4%) | 8 (0.9%) |
| 75 Years and over | 28 (4.6%) | 0 (0.0%) |
Disability Class: Cognitive Difficulty
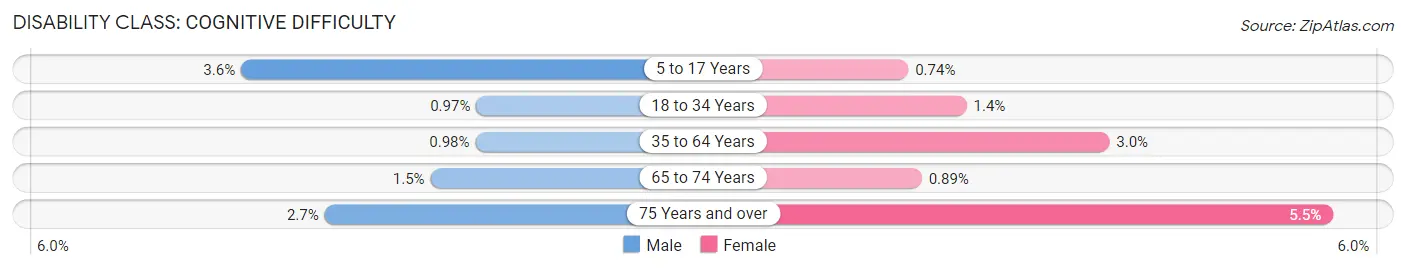
| Age Bracket | Male | Female |
| 5 to 17 Years | 50 (3.6%) | 10 (0.7%) |
| 18 to 34 Years | 15 (1.0%) | 18 (1.4%) |
| 35 to 64 Years | 31 (1.0%) | 97 (3.0%) |
| 65 to 74 Years | 15 (1.5%) | 8 (0.9%) |
| 75 Years and over | 16 (2.7%) | 34 (5.5%) |
Disability Class: Ambulatory Difficulty
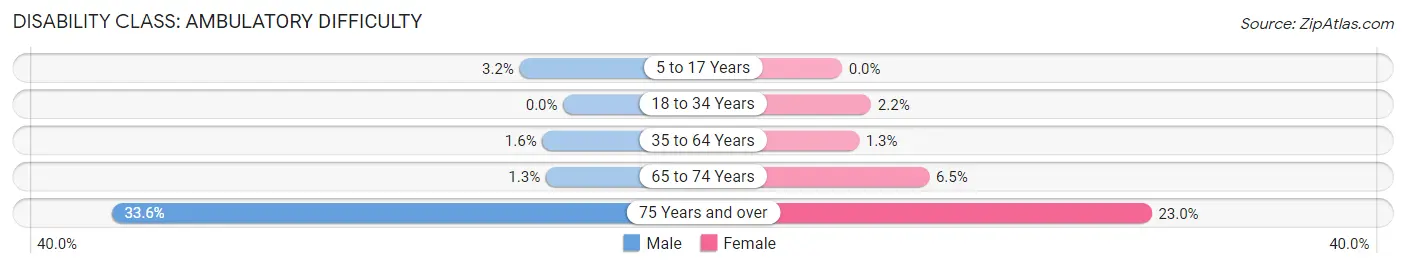
| Age Bracket | Male | Female |
| 5 to 17 Years | 45 (3.2%) | 0 (0.0%) |
| 18 to 34 Years | 0 (0.0%) | 28 (2.2%) |
| 35 to 64 Years | 49 (1.5%) | 41 (1.3%) |
| 65 to 74 Years | 13 (1.3%) | 58 (6.5%) |
| 75 Years and over | 202 (33.6%) | 143 (23.0%) |
Disability Class: Self-Care Difficulty
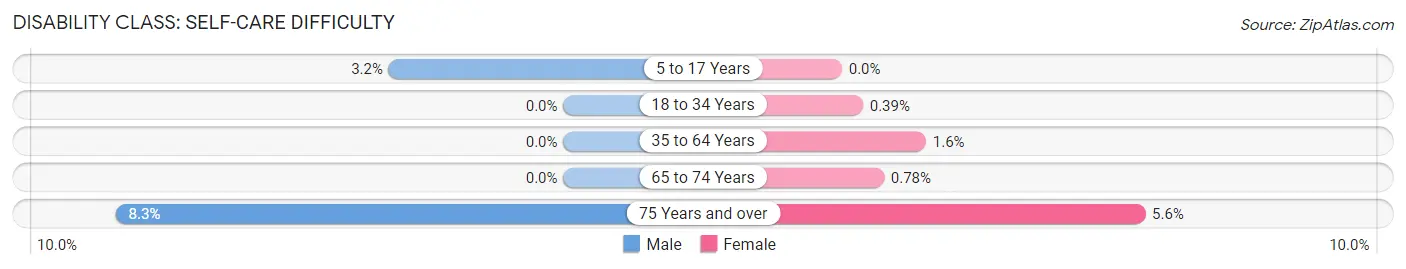
| Age Bracket | Male | Female |
| 5 to 17 Years | 45 (3.2%) | 0 (0.0%) |
| 18 to 34 Years | 0 (0.0%) | 5 (0.4%) |
| 35 to 64 Years | 0 (0.0%) | 51 (1.6%) |
| 65 to 74 Years | 0 (0.0%) | 7 (0.8%) |
| 75 Years and over | 50 (8.3%) | 35 (5.6%) |
Technology Access in Greenwood Village
Computing Device Access in Greenwood Village
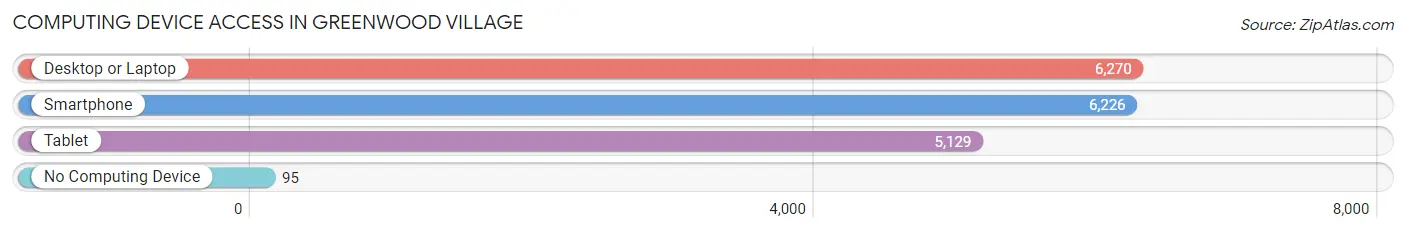
| Device Type | # Households | % Households |
| Desktop or Laptop | 6,270 | 97.3% |
| Smartphone | 6,226 | 96.6% |
| Tablet | 5,129 | 79.6% |
| No Computing Device | 95 | 1.5% |
| Total | 6,445 | 100.0% |
Internet Access in Greenwood Village
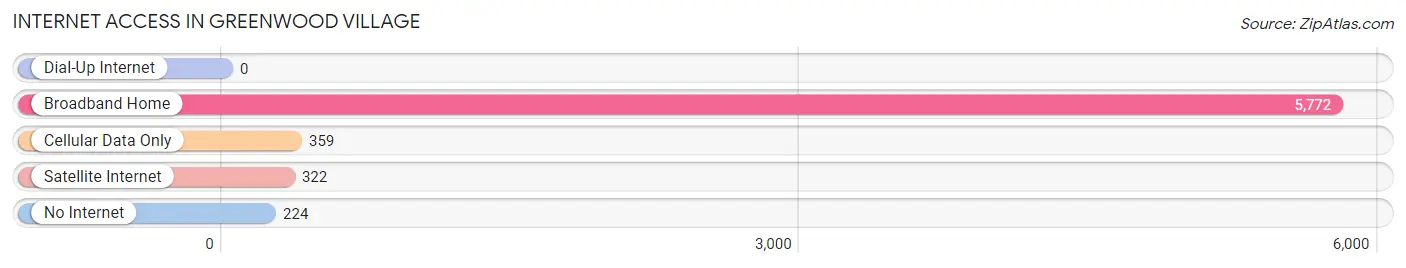
| Internet Type | # Households | % Households |
| Dial-Up Internet | 0 | 0.0% |
| Broadband Home | 5,772 | 89.6% |
| Cellular Data Only | 359 | 5.6% |
| Satellite Internet | 322 | 5.0% |
| No Internet | 224 | 3.5% |
| Total | 6,445 | 100.0% |
Greenwood Village Summary
Greenwood Village is a city located in Arapahoe County, Colorado, United States. It is a suburb of Denver and is located in the Denver-Aurora-Lakewood Metropolitan Statistical Area. As of the 2010 census, the city had a population of 13,925.
Geography
Greenwood Village is located at 39°37'17" North, 104°54'45" West (39.6214, -104.9125). It is situated at an elevation of 5,358 feet (1,633 m).
The city is located in the South Platte River Valley, just east of the Front Range of the Rocky Mountains. It is bordered by the cities of Centennial to the north, Englewood to the west, Cherry Hills Village to the south, and unincorporated Arapahoe County to the east.
Climate
Greenwood Village has a semi-arid climate, with hot summers and cold winters. The average annual temperature is 52.2°F (11.2°C). The average annual precipitation is 16.7 inches (424 mm).
Demographics
As of the 2010 census, there were 13,925 people, 5,717 households, and 3,845 families residing in the city. The population density was 2,845.3 people per square mile (1,098.7/km2). There were 6,093 housing units at an average density of 1,269.3 per square mile (489.2/km2). The racial makeup of the city was 87.2% White, 2.2% African American, 0.2% Native American, 6.7% Asian, 0.1% Pacific Islander, 1.3% from other races, and 2.3% from two or more races. Hispanic or Latino of any race were 5.2% of the population.
Economy
Greenwood Village is home to several major businesses, including the headquarters of Dish Network, Arrow Electronics, and the Denver Broncos. The city is also home to several shopping centers, including the Streets at SouthGlenn, the Landmark Shopping Center, and the Greenwood Plaza.
Education
Greenwood Village is served by the Cherry Creek School District. The city is home to several public schools, including Cherry Creek High School, West Middle School, and Greenwood Elementary School.
Transportation
Greenwood Village is served by the Regional Transportation District (RTD), which operates several bus routes in the city. The city is also served by the Denver International Airport, which is located approximately 25 miles (40 km) away.
Conclusion
Greenwood Village is a city located in Arapahoe County, Colorado, United States. It is a suburb of Denver and is located in the Denver-Aurora-Lakewood Metropolitan Statistical Area. As of the 2010 census, the city had a population of 13,925. The city is located in the South Platte River Valley, just east of the Front Range of the Rocky Mountains. It has a semi-arid climate, with hot summers and cold winters. The population is predominantly White, with a significant Asian population. The city is home to several major businesses, including the headquarters of Dish Network, Arrow Electronics, and the Denver Broncos. It is served by the Regional Transportation District (RTD) and the Denver International Airport. The city is served by the Cherry Creek School District, which operates several public schools in the city.
Common Questions
What is the Total Population of Greenwood Village?
Total Population of Greenwood Village is 15,537.
What is the Total Male Population of Greenwood Village?
Total Male Population of Greenwood Village is 7,960.
What is the Total Female Population of Greenwood Village?
Total Female Population of Greenwood Village is 7,577.
What is the Ratio of Males per 100 Females in Greenwood Village?
There are 105.05 Males per 100 Females in Greenwood Village.
What is the Ratio of Females per 100 Males in Greenwood Village?
There are 95.19 Females per 100 Males in Greenwood Village.
What is the Median Population Age in Greenwood Village?
Median Population Age in Greenwood Village is 45.6 Years.
What is the Average Family Size in Greenwood Village
Average Family Size in Greenwood Village is 3.0 People.
What is the Average Household Size in Greenwood Village
Average Household Size in Greenwood Village is 2.4 People.
What is Per Capita Income in Greenwood Village?
Per Capita income in Greenwood Village is $106,171.
What is the Median Family Income in Greenwood Village?
Median Family Income in Greenwood Village is $216,475.
What is the Median Household income in Greenwood Village?
Median Household Income in Greenwood Village is $139,144.
What is Income or Wage Gap in Greenwood Village?
Income or Wage Gap in Greenwood Village is 45.4%.
Women in Greenwood Village earn 54.6 cents for every dollar earned by a man.
What is Inequality or Gini Index in Greenwood Village?
Inequality or Gini Index in Greenwood Village is 0.55.
How Large is the Labor Force in Greenwood Village?
There are 8,233 People in the Labor Forcein in Greenwood Village.
What is the Percentage of People in the Labor Force in Greenwood Village?
62.7% of People are in the Labor Force in Greenwood Village.
What is the Unemployment Rate in Greenwood Village?
Unemployment Rate in Greenwood Village is 3.1%.