Applewood, CO
Applewood Map
Applewood Overview
7,985
TOTAL POPULATION
4,045
MALE POPULATION
3,940
FEMALE POPULATION
102.66
MALES / 100 FEMALES
97.40
FEMALES / 100 MALES
44.5
MEDIAN AGE
3.0
AVG FAMILY SIZE
2.4
AVG HOUSEHOLD SIZE
$68,987
PER CAPITA INCOME
$153,567
AVG FAMILY INCOME
$125,455
AVG HOUSEHOLD INCOME
36.4%
WAGE / INCOME GAP [ % ]
63.6¢/ $1
WAGE / INCOME GAP [ $ ]
0.42
INEQUALITY / GINI INDEX
4,699
LABOR FORCE [ PEOPLE ]
69.9%
PERCENT IN LABOR FORCE
6.1%
UNEMPLOYMENT RATE
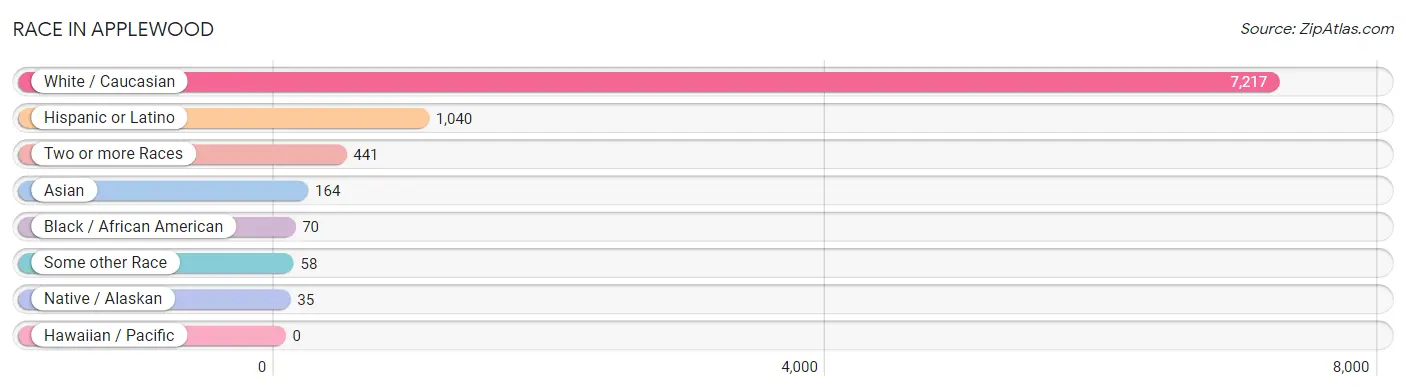
Race in Applewood
The most populous races in Applewood are White / Caucasian (7,217 | 90.4%), Hispanic or Latino (1,040 | 13.0%), and Two or more Races (441 | 5.5%).
| Race | # Population | % Population |
| Asian | 164 | 2.1% |
| Black / African American | 70 | 0.9% |
| Hawaiian / Pacific | 0 | 0.0% |
| Hispanic or Latino | 1,040 | 13.0% |
| Native / Alaskan | 35 | 0.4% |
| White / Caucasian | 7,217 | 90.4% |
| Two or more Races | 441 | 5.5% |
| Some other Race | 58 | 0.7% |
| Total | 7,985 | 100.0% |
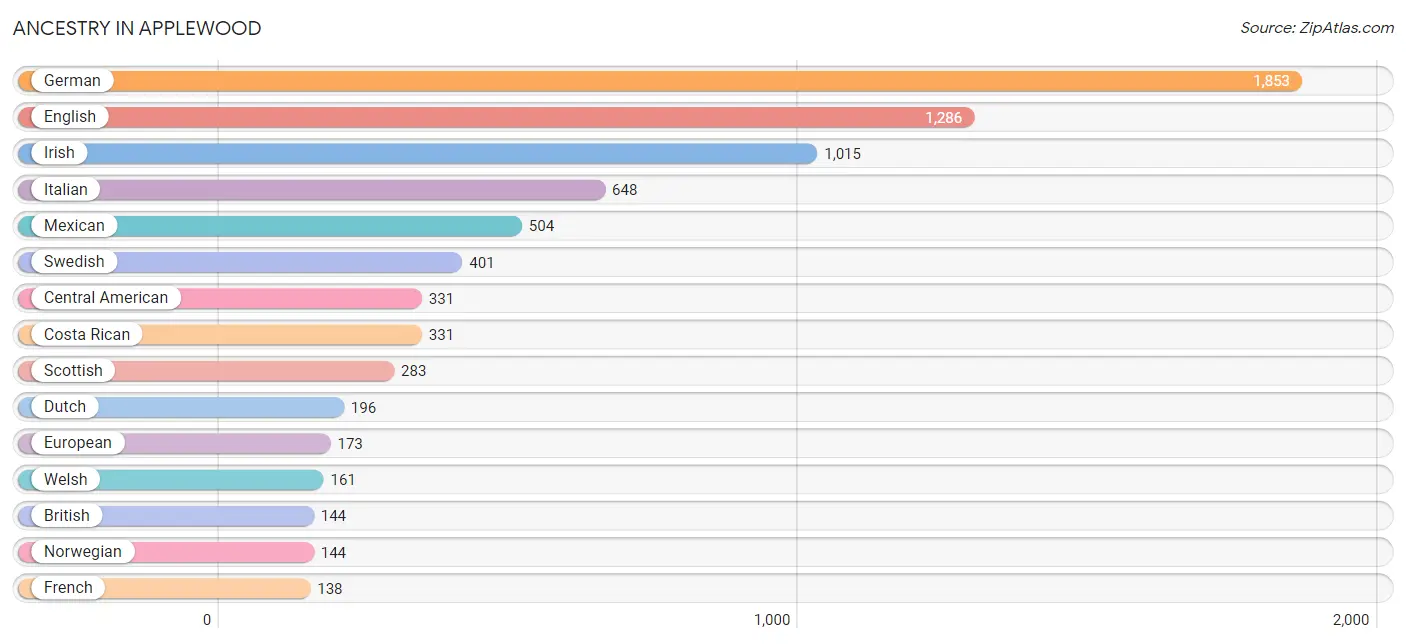
Ancestry in Applewood
The most populous ancestries reported in Applewood are German (1,853 | 23.2%), English (1,286 | 16.1%), Irish (1,015 | 12.7%), Italian (648 | 8.1%), and Mexican (504 | 6.3%), together accounting for 66.5% of all Applewood residents.
| Ancestry | # Population | % Population |
| Alsatian | 17 | 0.2% |
| American | 102 | 1.3% |
| Arab | 18 | 0.2% |
| Arapaho | 8 | 0.1% |
| Australian | 39 | 0.5% |
| Austrian | 48 | 0.6% |
| Belgian | 17 | 0.2% |
| Bhutanese | 14 | 0.2% |
| Blackfeet | 8 | 0.1% |
| British | 144 | 1.8% |
| Burmese | 26 | 0.3% |
| Canadian | 22 | 0.3% |
| Central American | 331 | 4.2% |
| Central American Indian | 14 | 0.2% |
| Cherokee | 37 | 0.5% |
| Chilean | 65 | 0.8% |
| Choctaw | 7 | 0.1% |
| Colombian | 18 | 0.2% |
| Costa Rican | 331 | 4.2% |
| Croatian | 26 | 0.3% |
| Cuban | 6 | 0.1% |
| Czech | 6 | 0.1% |
| Czechoslovakian | 21 | 0.3% |
| Danish | 93 | 1.2% |
| Dutch | 196 | 2.5% |
| English | 1,286 | 16.1% |
| European | 173 | 2.2% |
| Filipino | 13 | 0.2% |
| Finnish | 8 | 0.1% |
| French | 138 | 1.7% |
| French Canadian | 42 | 0.5% |
| German | 1,853 | 23.2% |
| Greek | 26 | 0.3% |
| Hungarian | 43 | 0.5% |
| Indian (Asian) | 5 | 0.1% |
| Iranian | 7 | 0.1% |
| Irish | 1,015 | 12.7% |
| Italian | 648 | 8.1% |
| Korean | 21 | 0.3% |
| Lebanese | 11 | 0.1% |
| Lithuanian | 18 | 0.2% |
| Mexican | 504 | 6.3% |
| Mexican American Indian | 9 | 0.1% |
| New Zealander | 10 | 0.1% |
| Northern European | 127 | 1.6% |
| Norwegian | 144 | 1.8% |
| Peruvian | 14 | 0.2% |
| Polish | 137 | 1.7% |
| Portuguese | 34 | 0.4% |
| Pueblo | 14 | 0.2% |
| Russian | 127 | 1.6% |
| Samoan | 10 | 0.1% |
| Scandinavian | 32 | 0.4% |
| Scotch-Irish | 131 | 1.6% |
| Scottish | 283 | 3.5% |
| Slovak | 11 | 0.1% |
| Slovene | 91 | 1.1% |
| South American | 97 | 1.2% |
| Spaniard | 7 | 0.1% |
| Spanish | 90 | 1.1% |
| Sri Lankan | 80 | 1.0% |
| Swedish | 401 | 5.0% |
| Swiss | 20 | 0.3% |
| Syrian | 7 | 0.1% |
| Ukrainian | 26 | 0.3% |
| Welsh | 161 | 2.0% |
| Yugoslavian | 7 | 0.1% | View All 67 Rows |
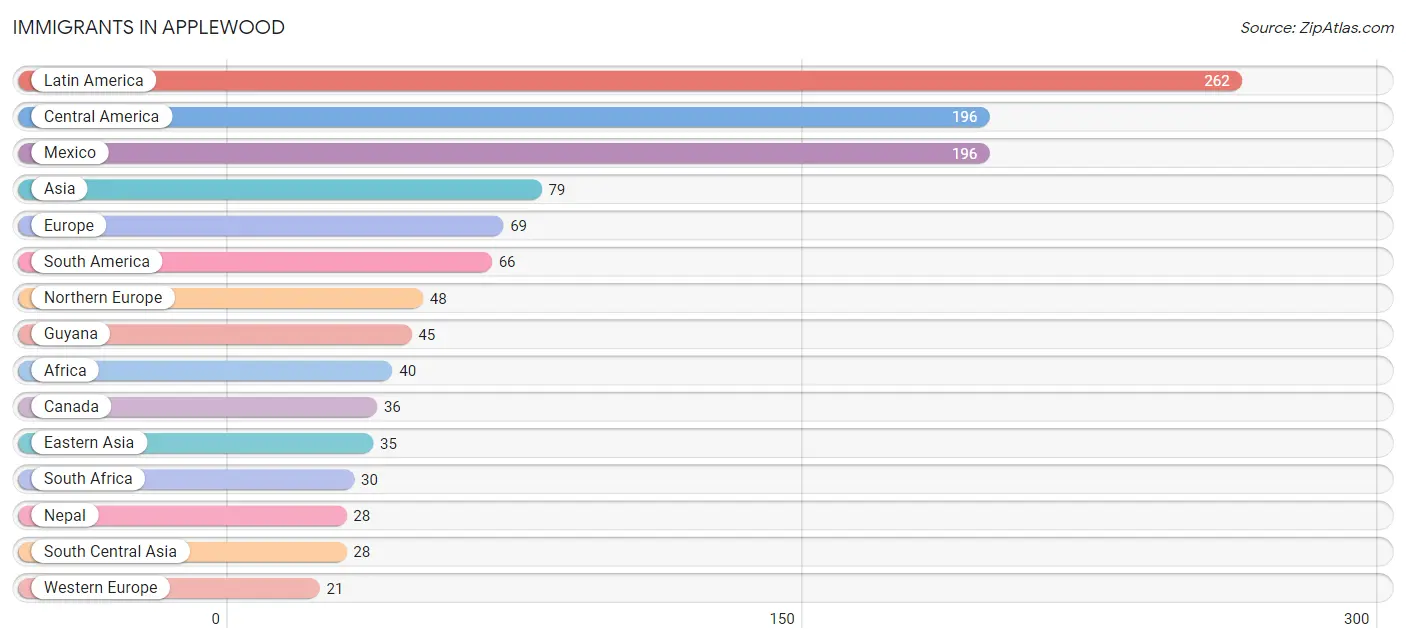
Immigrants in Applewood
The most numerous immigrant groups reported in Applewood came from Latin America (262 | 3.3%), Central America (196 | 2.5%), Mexico (196 | 2.5%), Asia (79 | 1.0%), and Europe (69 | 0.9%), together accounting for 10.0% of all Applewood residents.
| Immigration Origin | # Population | % Population |
| Africa | 40 | 0.5% |
| Asia | 79 | 1.0% |
| Australia | 10 | 0.1% |
| Canada | 36 | 0.4% |
| Central America | 196 | 2.5% |
| Chile | 7 | 0.1% |
| China | 17 | 0.2% |
| Eastern Africa | 10 | 0.1% |
| Eastern Asia | 35 | 0.4% |
| England | 10 | 0.1% |
| Europe | 69 | 0.9% |
| Germany | 15 | 0.2% |
| Guyana | 45 | 0.6% |
| Hong Kong | 5 | 0.1% |
| Japan | 6 | 0.1% |
| Korea | 12 | 0.2% |
| Latin America | 262 | 3.3% |
| Mexico | 196 | 2.5% |
| Nepal | 28 | 0.4% |
| Netherlands | 6 | 0.1% |
| Northern Europe | 48 | 0.6% |
| Oceania | 10 | 0.1% |
| Peru | 14 | 0.2% |
| Scotland | 7 | 0.1% |
| South Africa | 30 | 0.4% |
| South America | 66 | 0.8% |
| South Central Asia | 28 | 0.4% |
| South Eastern Asia | 16 | 0.2% |
| Vietnam | 16 | 0.2% |
| Western Europe | 21 | 0.3% |
| Zimbabwe | 10 | 0.1% | View All 31 Rows |
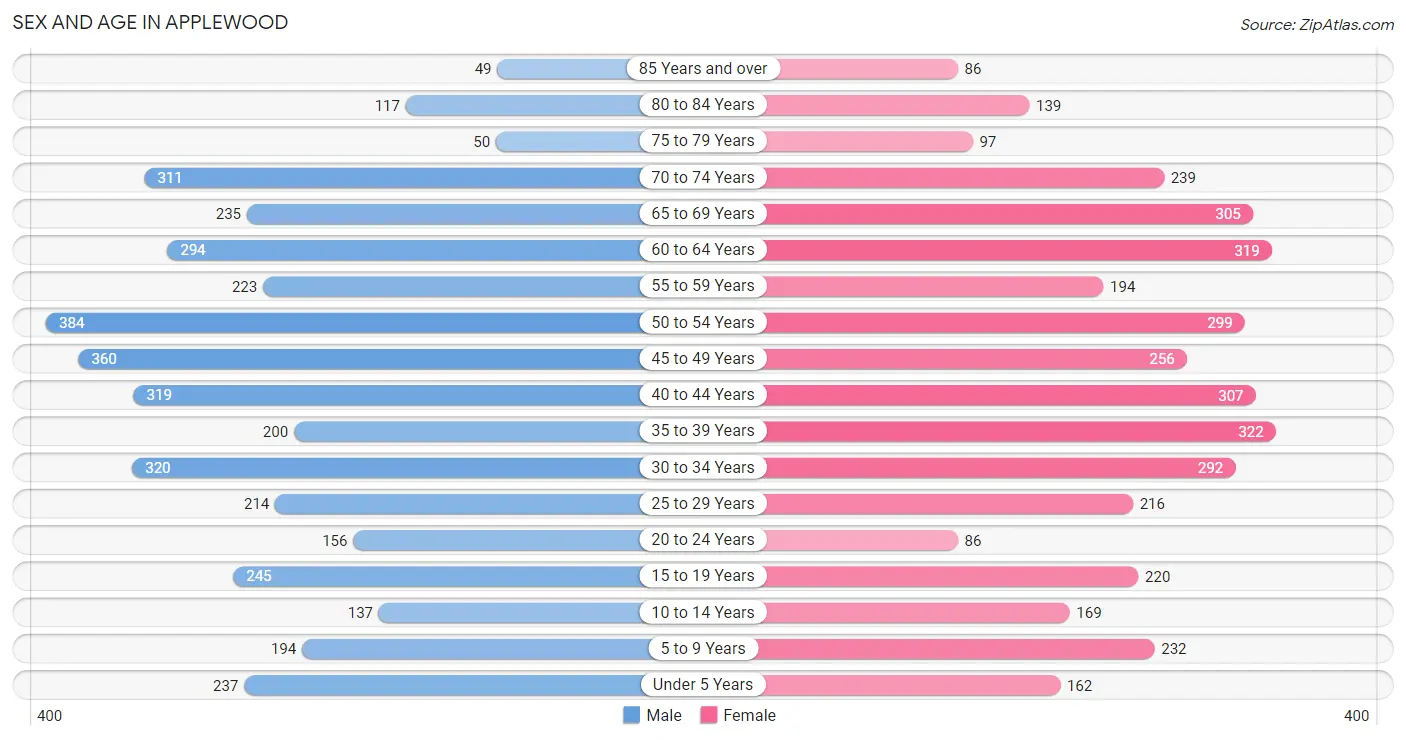
Sex and Age in Applewood
Sex and Age in Applewood
The most populous age groups in Applewood are 50 to 54 Years (384 | 9.5%) for men and 35 to 39 Years (322 | 8.2%) for women.
| Age Bracket | Male | Female |
| Under 5 Years | 237 (5.9%) | 162 (4.1%) |
| 5 to 9 Years | 194 (4.8%) | 232 (5.9%) |
| 10 to 14 Years | 137 (3.4%) | 169 (4.3%) |
| 15 to 19 Years | 245 (6.1%) | 220 (5.6%) |
| 20 to 24 Years | 156 (3.9%) | 86 (2.2%) |
| 25 to 29 Years | 214 (5.3%) | 216 (5.5%) |
| 30 to 34 Years | 320 (7.9%) | 292 (7.4%) |
| 35 to 39 Years | 200 (4.9%) | 322 (8.2%) |
| 40 to 44 Years | 319 (7.9%) | 307 (7.8%) |
| 45 to 49 Years | 360 (8.9%) | 256 (6.5%) |
| 50 to 54 Years | 384 (9.5%) | 299 (7.6%) |
| 55 to 59 Years | 223 (5.5%) | 194 (4.9%) |
| 60 to 64 Years | 294 (7.3%) | 319 (8.1%) |
| 65 to 69 Years | 235 (5.8%) | 305 (7.7%) |
| 70 to 74 Years | 311 (7.7%) | 239 (6.1%) |
| 75 to 79 Years | 50 (1.2%) | 97 (2.5%) |
| 80 to 84 Years | 117 (2.9%) | 139 (3.5%) |
| 85 Years and over | 49 (1.2%) | 86 (2.2%) |
| Total | 4,045 (100.0%) | 3,940 (100.0%) |
Families and Households in Applewood
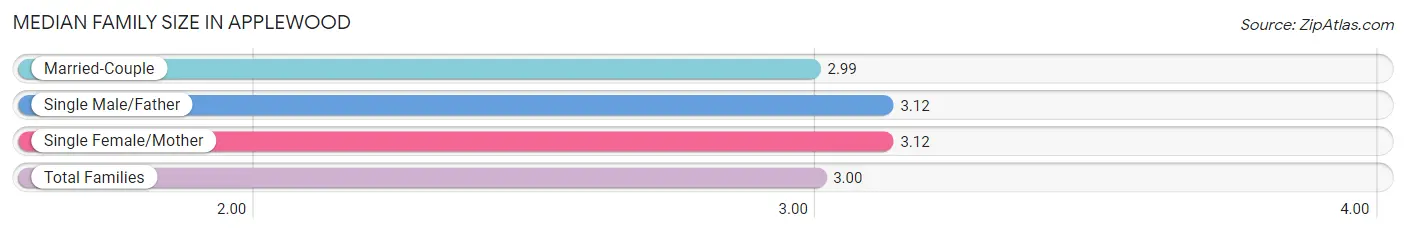
Median Family Size in Applewood
The median family size in Applewood is 3.00 persons per family, with single male/father families (93 | 4.5%) accounting for the largest median family size of 3.12 persons per family. On the other hand, married-couple families (1,805 | 87.7%) represent the smallest median family size with 2.99 persons per family.
| Family Type | # Families | Family Size |
| Married-Couple | 1,805 (87.7%) | 2.99 |
| Single Male/Father | 93 (4.5%) | 3.12 |
| Single Female/Mother | 159 (7.7%) | 3.12 |
| Total Families | 2,057 (100.0%) | 3.00 |
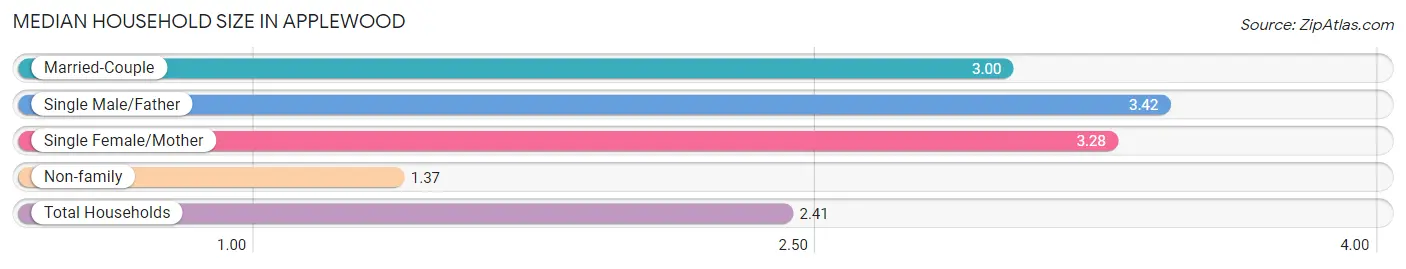
Median Household Size in Applewood
The median household size in Applewood is 2.41 persons per household, with single male/father households (93 | 2.8%) accounting for the largest median household size of 3.42 persons per household. non-family households (1,239 | 37.6%) represent the smallest median household size with 1.37 persons per household.
| Household Type | # Households | Household Size |
| Married-Couple | 1,805 (54.8%) | 3.00 |
| Single Male/Father | 93 (2.8%) | 3.42 |
| Single Female/Mother | 159 (4.8%) | 3.28 |
| Non-family | 1,239 (37.6%) | 1.37 |
| Total Households | 3,296 (100.0%) | 2.41 |
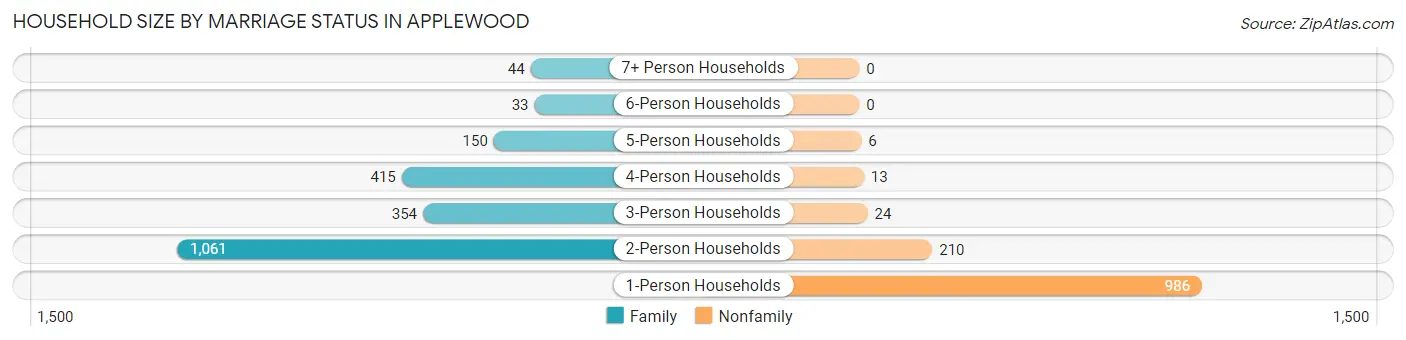
Household Size by Marriage Status in Applewood
Out of a total of 3,296 households in Applewood, 2,057 (62.4%) are family households, while 1,239 (37.6%) are nonfamily households. The most numerous type of family households are 2-person households, comprising 1,061, and the most common type of nonfamily households are 1-person households, comprising 986.
| Household Size | Family Households | Nonfamily Households |
| 1-Person Households | - | 986 (29.9%) |
| 2-Person Households | 1,061 (32.2%) | 210 (6.4%) |
| 3-Person Households | 354 (10.7%) | 24 (0.7%) |
| 4-Person Households | 415 (12.6%) | 13 (0.4%) |
| 5-Person Households | 150 (4.5%) | 6 (0.2%) |
| 6-Person Households | 33 (1.0%) | 0 (0.0%) |
| 7+ Person Households | 44 (1.3%) | 0 (0.0%) |
| Total | 2,057 (62.4%) | 1,239 (37.6%) |
Female Fertility in Applewood
Fertility by Age in Applewood
Average fertility rate in Applewood is 33.0 births per 1,000 women. Women in the age bracket of 35 to 50 years have the highest fertility rate with 39.0 births per 1,000 women. Women in the age bracket of 35 to 50 years acount for 61.4% of all women with births.
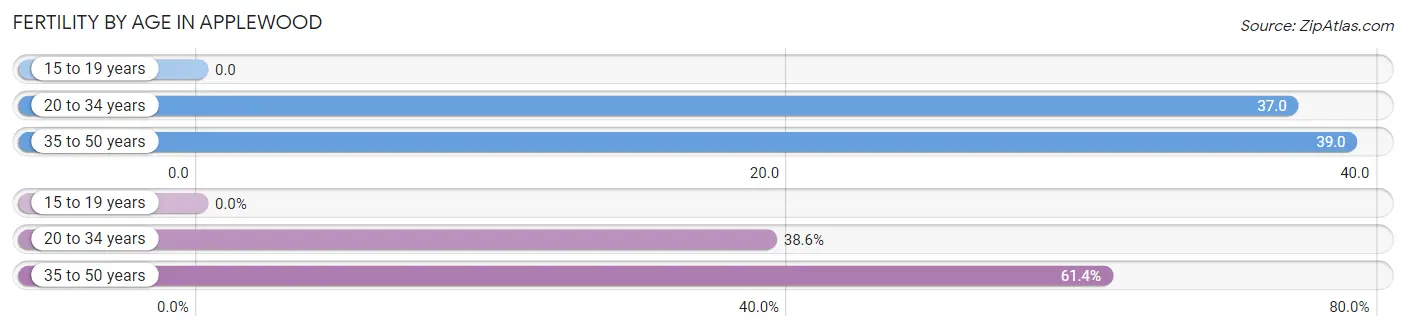
| Age Bracket | Women with Births | Births / 1,000 Women |
| 15 to 19 years | 0 (0.0%) | 0.0 |
| 20 to 34 years | 22 (38.6%) | 37.0 |
| 35 to 50 years | 35 (61.4%) | 39.0 |
| Total | 57 (100.0%) | 33.0 |
Fertility by Age by Marriage Status in Applewood
82.5% of women with births (57) in Applewood are married. The highest percentage of unmarried women with births falls into 35 to 50 years age bracket with 28.6% of them unmarried at the time of birth, while the lowest percentage of unmarried women with births belong to 20 to 34 years age bracket with 0.0% of them unmarried.
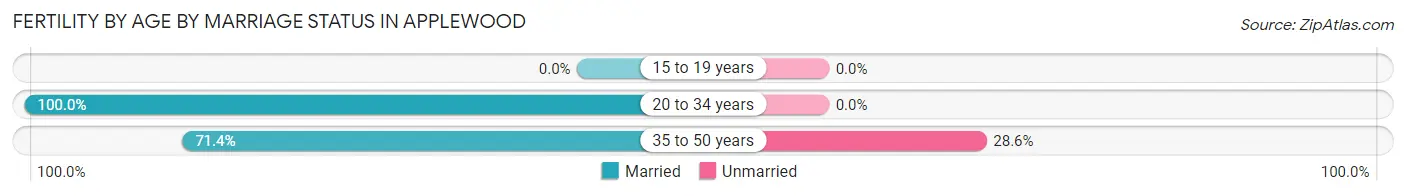
| Age Bracket | Married | Unmarried |
| 15 to 19 years | 0 (0.0%) | 0 (0.0%) |
| 20 to 34 years | 22 (100.0%) | 0 (0.0%) |
| 35 to 50 years | 25 (71.4%) | 10 (28.6%) |
| Total | 47 (82.5%) | 10 (17.5%) |
Fertility by Education in Applewood
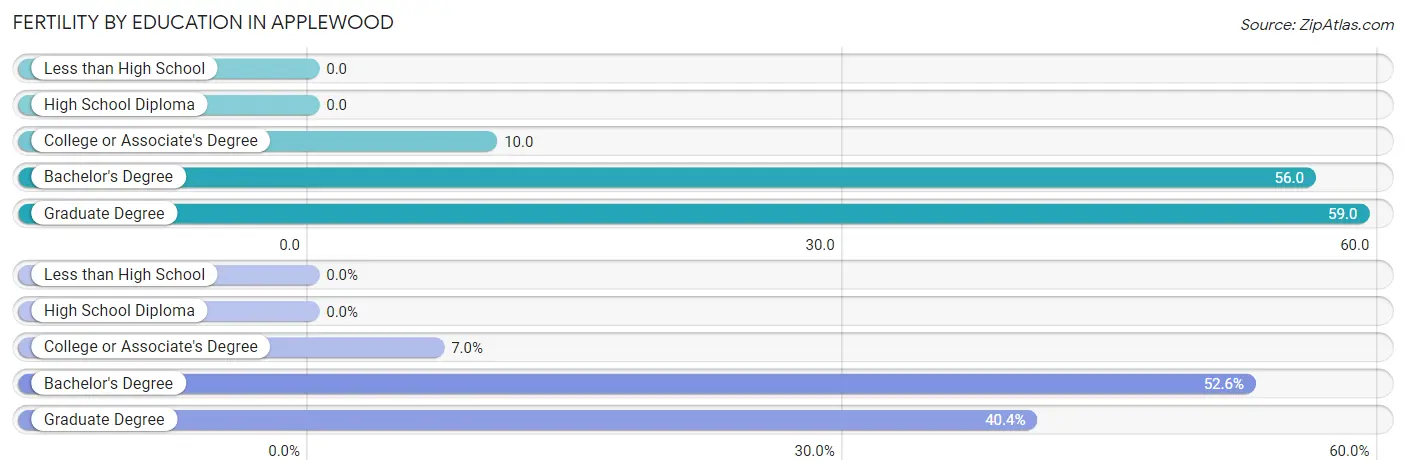
| Educational Attainment | Women with Births | Births / 1,000 Women |
| Less than High School | 0 (0.0%) | 0.0 |
| High School Diploma | 0 (0.0%) | 0.0 |
| College or Associate's Degree | 4 (7.0%) | 10.0 |
| Bachelor's Degree | 30 (52.6%) | 56.0 |
| Graduate Degree | 23 (40.4%) | 59.0 |
| Total | 57 (100.0%) | 33.0 |
Fertility by Education by Marriage Status in Applewood
17.5% of women with births in Applewood are unmarried. Women with the educational attainment of college or associate's degree are most likely to be married with 100.0% of them married at childbirth, while women with the educational attainment of bachelor's degree are least likely to be married with 33.3% of them unmarried at childbirth.
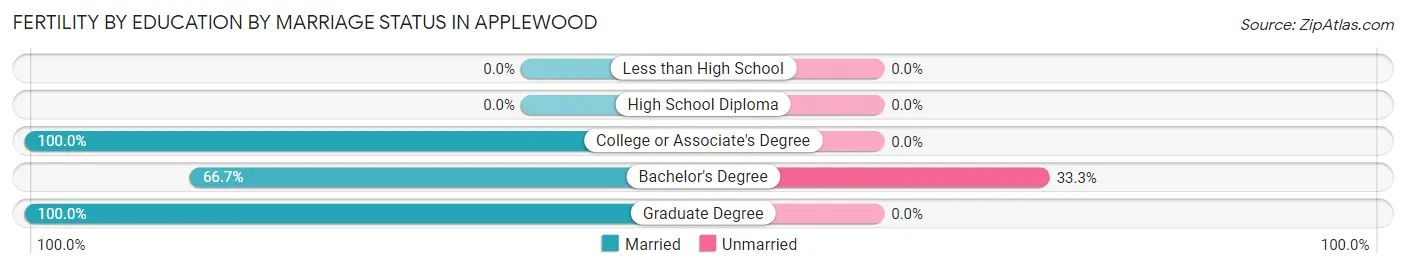
| Educational Attainment | Married | Unmarried |
| Less than High School | 0 (0.0%) | 0 (0.0%) |
| High School Diploma | 0 (0.0%) | 0 (0.0%) |
| College or Associate's Degree | 4 (100.0%) | 0 (0.0%) |
| Bachelor's Degree | 20 (66.7%) | 10 (33.3%) |
| Graduate Degree | 23 (100.0%) | 0 (0.0%) |
| Total | 47 (82.5%) | 10 (17.5%) |
Income in Applewood
Income Overview in Applewood
Per Capita Income in Applewood is $68,987, while median incomes of families and households are $153,567 and $125,455 respectively.
| Characteristic | Number | Measure |
| Per Capita Income | 7,985 | $68,987 |
| Median Family Income | 2,057 | $153,567 |
| Mean Family Income | 2,057 | $190,595 |
| Median Household Income | 3,296 | $125,455 |
| Mean Household Income | 3,296 | $160,442 |
| Income Deficit | 2,057 | $0 |
| Wage / Income Gap (%) | 7,985 | 36.36% |
| Wage / Income Gap ($) | 7,985 | 63.64¢ per $1 |
| Gini / Inequality Index | 7,985 | 0.42 |
Earnings by Sex in Applewood
Average Earnings in Applewood are $63,100, $80,960 for men and $51,523 for women, a difference of 36.4%.
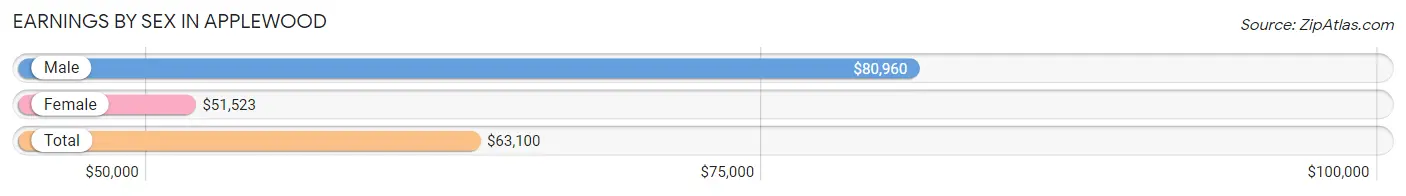
| Sex | Number | Average Earnings |
| Male | 2,637 (54.4%) | $80,960 |
| Female | 2,210 (45.6%) | $51,523 |
| Total | 4,847 (100.0%) | $63,100 |
Earnings by Sex by Income Bracket in Applewood
The most common earnings brackets in Applewood are $100,000+ for men (1,050 | 39.8%) and $100,000+ for women (330 | 14.9%).
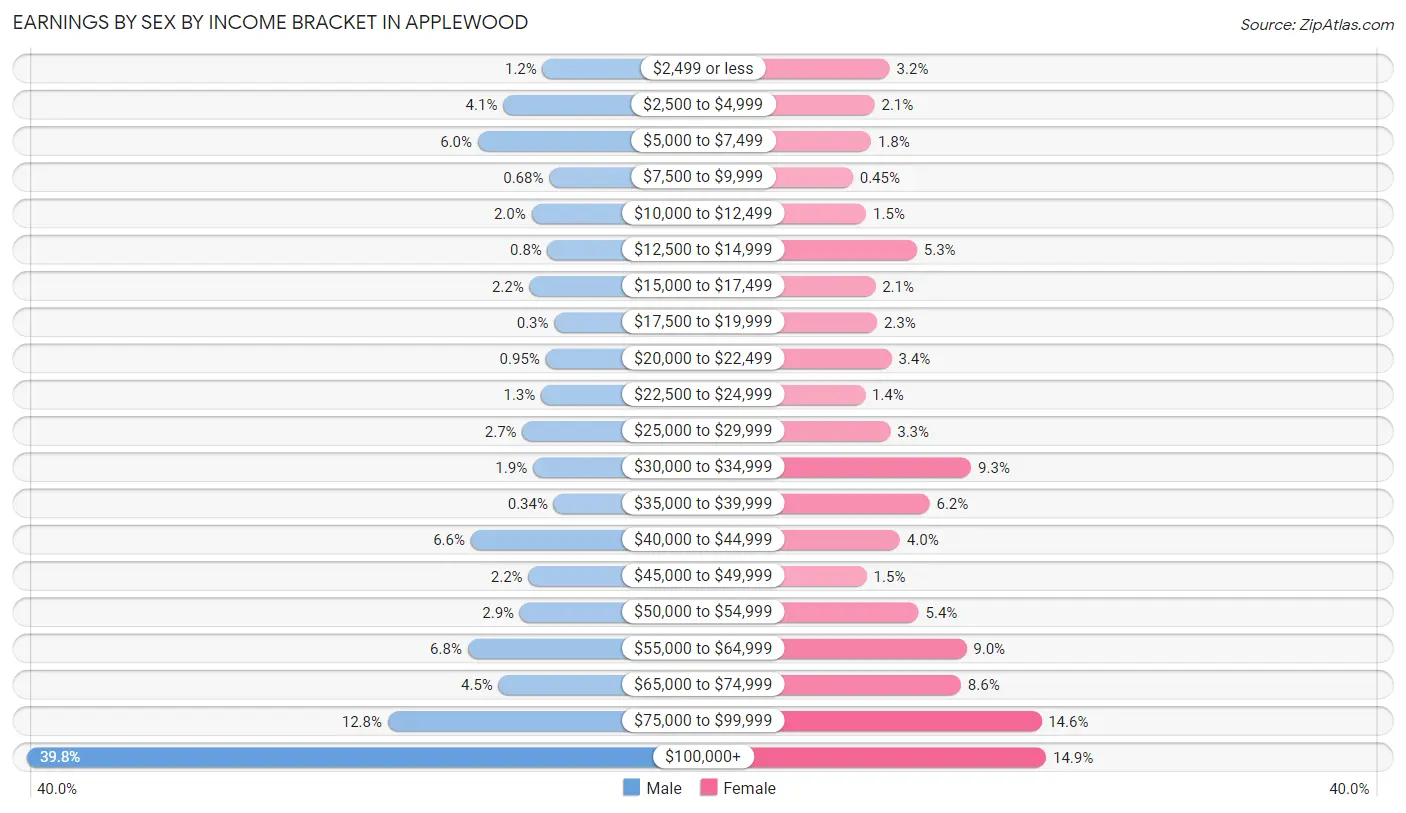
| Income | Male | Female |
| $2,499 or less | 31 (1.2%) | 71 (3.2%) |
| $2,500 to $4,999 | 109 (4.1%) | 46 (2.1%) |
| $5,000 to $7,499 | 159 (6.0%) | 40 (1.8%) |
| $7,500 to $9,999 | 18 (0.7%) | 10 (0.4%) |
| $10,000 to $12,499 | 53 (2.0%) | 32 (1.5%) |
| $12,500 to $14,999 | 21 (0.8%) | 116 (5.2%) |
| $15,000 to $17,499 | 57 (2.2%) | 47 (2.1%) |
| $17,500 to $19,999 | 8 (0.3%) | 50 (2.3%) |
| $20,000 to $22,499 | 25 (0.9%) | 74 (3.4%) |
| $22,500 to $24,999 | 34 (1.3%) | 30 (1.4%) |
| $25,000 to $29,999 | 71 (2.7%) | 72 (3.3%) |
| $30,000 to $34,999 | 50 (1.9%) | 206 (9.3%) |
| $35,000 to $39,999 | 9 (0.3%) | 137 (6.2%) |
| $40,000 to $44,999 | 173 (6.6%) | 88 (4.0%) |
| $45,000 to $49,999 | 59 (2.2%) | 33 (1.5%) |
| $50,000 to $54,999 | 76 (2.9%) | 119 (5.4%) |
| $55,000 to $64,999 | 179 (6.8%) | 198 (9.0%) |
| $65,000 to $74,999 | 118 (4.5%) | 189 (8.6%) |
| $75,000 to $99,999 | 337 (12.8%) | 322 (14.6%) |
| $100,000+ | 1,050 (39.8%) | 330 (14.9%) |
| Total | 2,637 (100.0%) | 2,210 (100.0%) |
Earnings by Sex by Educational Attainment in Applewood
Average earnings in Applewood are $87,375 for men and $55,610 for women, a difference of 36.3%. Men with an educational attainment of graduate degree enjoy the highest average annual earnings of $132,353, while those with less than high school education earn the least with $40,450. Women with an educational attainment of graduate degree earn the most with the average annual earnings of $62,019, while those with less than high school education have the smallest earnings of $28,750.
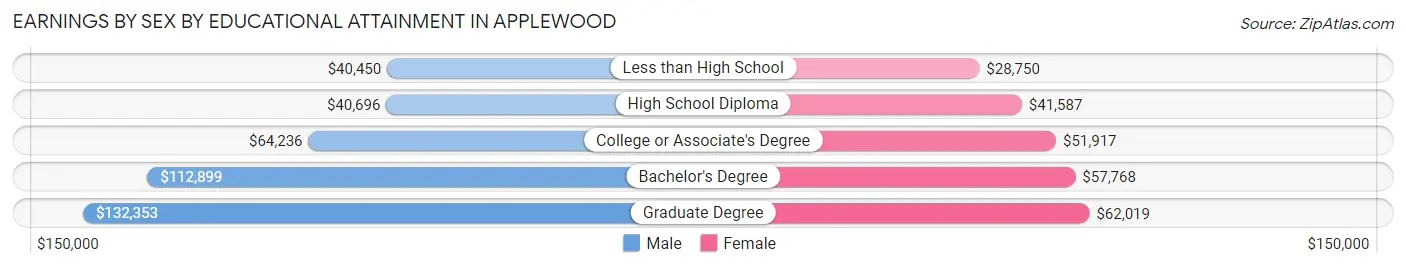
| Educational Attainment | Male Income | Female Income |
| Less than High School | $40,450 | $28,750 |
| High School Diploma | $40,696 | $41,587 |
| College or Associate's Degree | $64,236 | $51,917 |
| Bachelor's Degree | $112,899 | $57,768 |
| Graduate Degree | $132,353 | $62,019 |
| Total | $87,375 | $55,610 |
Family Income in Applewood
Family Income Brackets in Applewood
According to the Applewood family income data, there are 753 families falling into the $200,000+ income range, which is the most common income bracket and makes up 36.6% of all families.
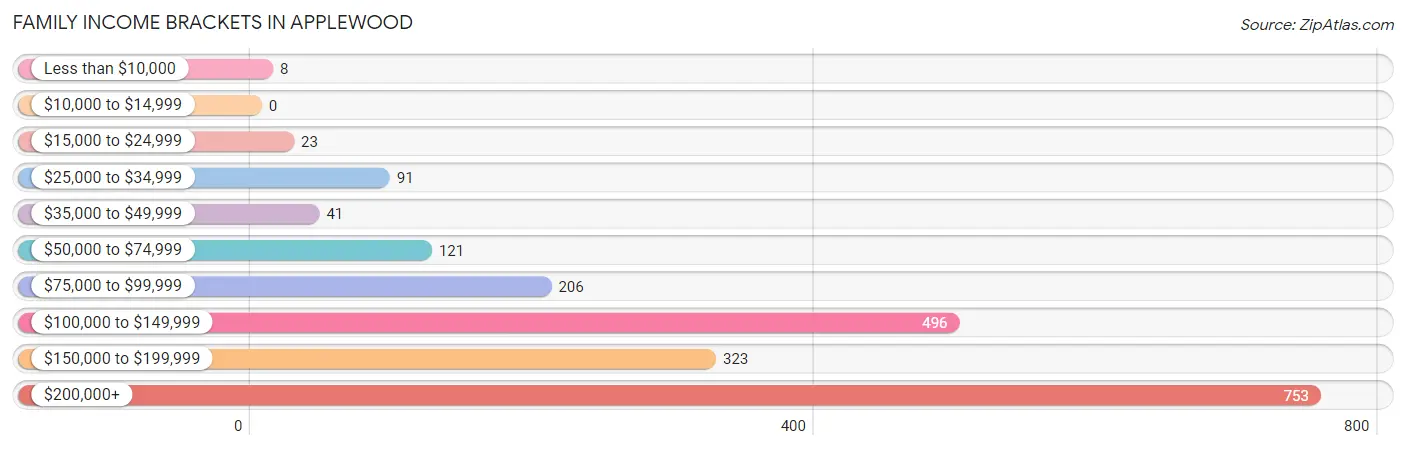
| Income Bracket | # Families | % Families |
| Less than $10,000 | 8 | 0.4% |
| $10,000 to $14,999 | 0 | 0.0% |
| $15,000 to $24,999 | 23 | 1.1% |
| $25,000 to $34,999 | 91 | 4.4% |
| $35,000 to $49,999 | 41 | 2.0% |
| $50,000 to $74,999 | 121 | 5.9% |
| $75,000 to $99,999 | 206 | 10.0% |
| $100,000 to $149,999 | 496 | 24.1% |
| $150,000 to $199,999 | 323 | 15.7% |
| $200,000+ | 753 | 36.6% |
Family Income by Famaliy Size in Applewood
4-person families (396 | 19.3%) account for the highest median family income in Applewood with $177,241 per family, while 2-person families (1,094 | 53.2%) have the highest median income of $70,469 per family member.
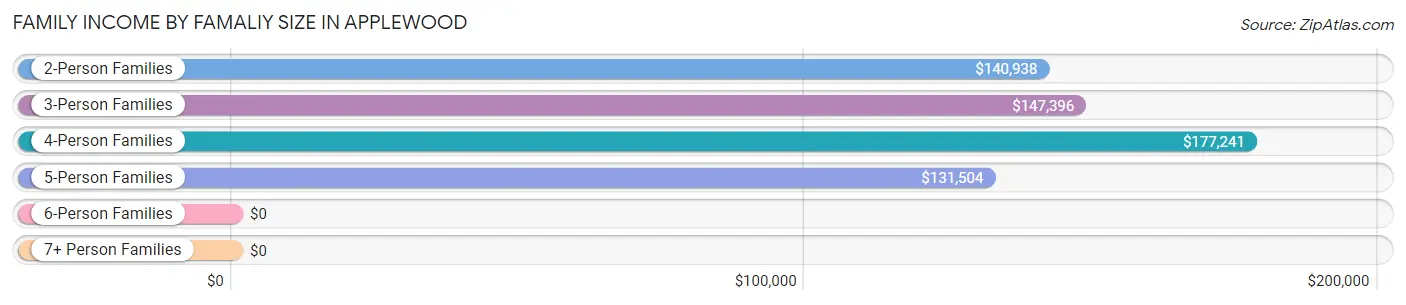
| Income Bracket | # Families | Median Income |
| 2-Person Families | 1,094 (53.2%) | $140,938 |
| 3-Person Families | 349 (17.0%) | $147,396 |
| 4-Person Families | 396 (19.3%) | $177,241 |
| 5-Person Families | 141 (6.9%) | $131,504 |
| 6-Person Families | 33 (1.6%) | $0 |
| 7+ Person Families | 44 (2.1%) | $0 |
| Total | 2,057 (100.0%) | $153,567 |
Family Income by Number of Earners in Applewood
The median family income in Applewood is $153,567, with families comprising 3+ earners (270) having the highest median family income of $189,500, while families with no earners (255) have the lowest median family income of $107,596, accounting for 13.1% and 12.4% of families, respectively.
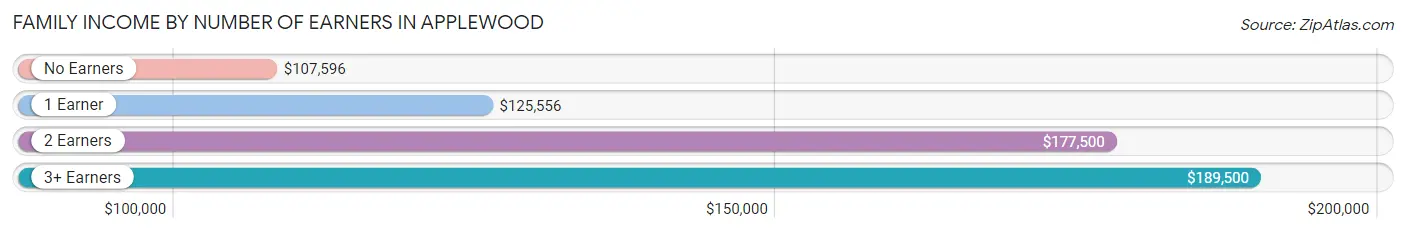
| Number of Earners | # Families | Median Income |
| No Earners | 255 (12.4%) | $107,596 |
| 1 Earner | 508 (24.7%) | $125,556 |
| 2 Earners | 1,024 (49.8%) | $177,500 |
| 3+ Earners | 270 (13.1%) | $189,500 |
| Total | 2,057 (100.0%) | $153,567 |
Household Income in Applewood
Household Income Brackets in Applewood
With 873 households falling in the category, the $200,000+ income range is the most frequent in Applewood, accounting for 26.5% of all households.
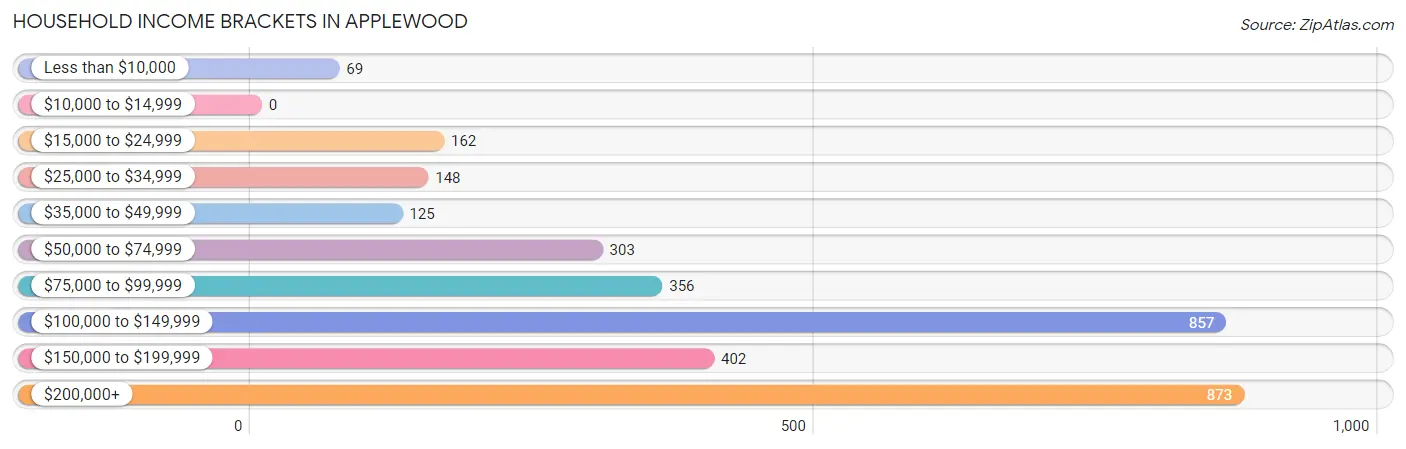
| Income Bracket | # Households | % Households |
| Less than $10,000 | 69 | 2.1% |
| $10,000 to $14,999 | 0 | 0.0% |
| $15,000 to $24,999 | 162 | 4.9% |
| $25,000 to $34,999 | 148 | 4.5% |
| $35,000 to $49,999 | 125 | 3.8% |
| $50,000 to $74,999 | 303 | 9.2% |
| $75,000 to $99,999 | 356 | 10.8% |
| $100,000 to $149,999 | 857 | 26.0% |
| $150,000 to $199,999 | 402 | 12.2% |
| $200,000+ | 873 | 26.5% |
Household Income by Householder Age in Applewood
The median household income in Applewood is $125,455, with the highest median household income of $175,474 found in the 25 to 44 years age bracket for the primary householder. A total of 807 households (24.5%) fall into this category. Meanwhile, the 15 to 24 years age bracket for the primary householder has the lowest median household income of $0, with 85 households (2.6%) in this group.
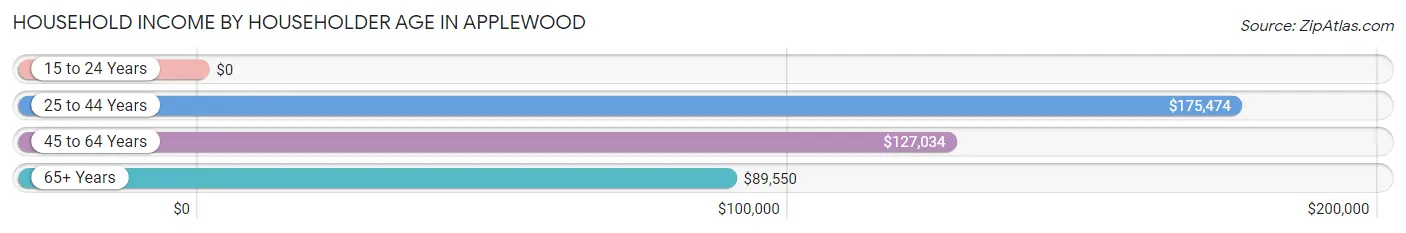
| Income Bracket | # Households | Median Income |
| 15 to 24 Years | 85 (2.6%) | $0 |
| 25 to 44 Years | 807 (24.5%) | $175,474 |
| 45 to 64 Years | 1,285 (39.0%) | $127,034 |
| 65+ Years | 1,119 (34.0%) | $89,550 |
| Total | 3,296 (100.0%) | $125,455 |
Poverty in Applewood
Income Below Poverty by Sex and Age in Applewood
With 5.1% poverty level for males and 3.5% for females among the residents of Applewood, 25 to 34 year old males and 15 year old females are the most vulnerable to poverty, with 86 males (16.1%) and 9 females (28.1%) in their respective age groups living below the poverty level.
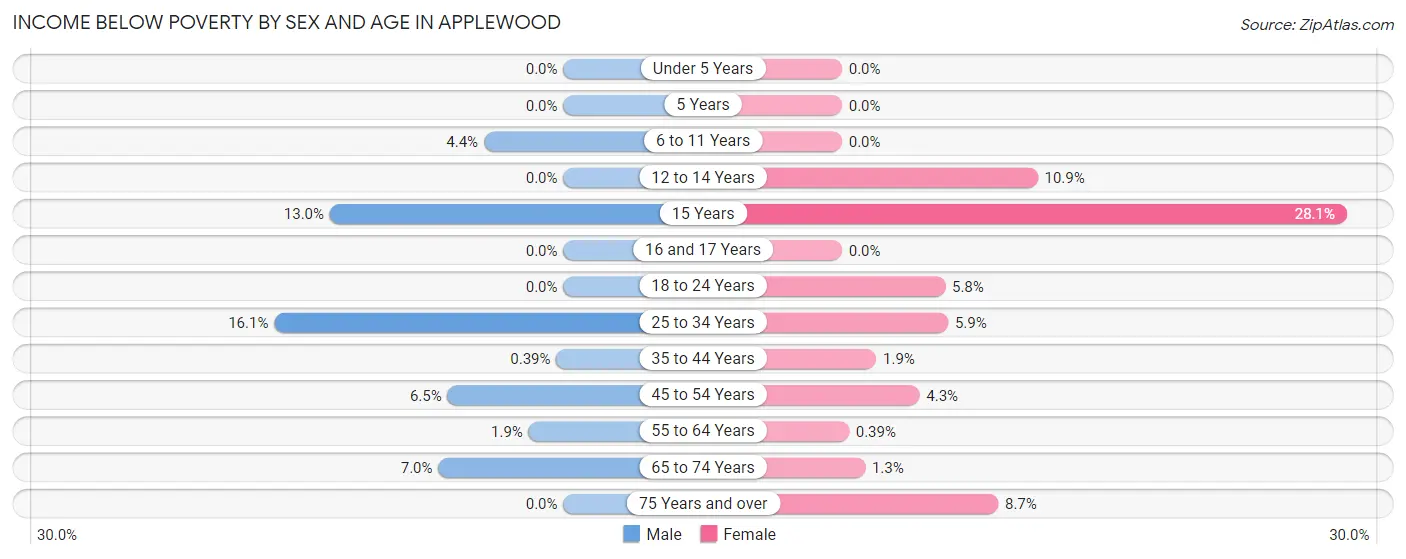
| Age Bracket | Male | Female |
| Under 5 Years | 0 (0.0%) | 0 (0.0%) |
| 5 Years | 0 (0.0%) | 0 (0.0%) |
| 6 to 11 Years | 10 (4.4%) | 0 (0.0%) |
| 12 to 14 Years | 0 (0.0%) | 17 (10.9%) |
| 15 Years | 13 (13.0%) | 9 (28.1%) |
| 16 and 17 Years | 0 (0.0%) | 0 (0.0%) |
| 18 to 24 Years | 0 (0.0%) | 10 (5.8%) |
| 25 to 34 Years | 86 (16.1%) | 30 (5.9%) |
| 35 to 44 Years | 2 (0.4%) | 12 (1.9%) |
| 45 to 54 Years | 48 (6.5%) | 24 (4.3%) |
| 55 to 64 Years | 10 (1.9%) | 2 (0.4%) |
| 65 to 74 Years | 38 (7.0%) | 7 (1.3%) |
| 75 Years and over | 0 (0.0%) | 28 (8.7%) |
| Total | 207 (5.1%) | 139 (3.5%) |
Income Above Poverty by Sex and Age in Applewood
According to the poverty statistics in Applewood, males aged under 5 years and females aged under 5 years are the age groups that are most secure financially, with 100.0% of males and 100.0% of females in these age groups living above the poverty line.
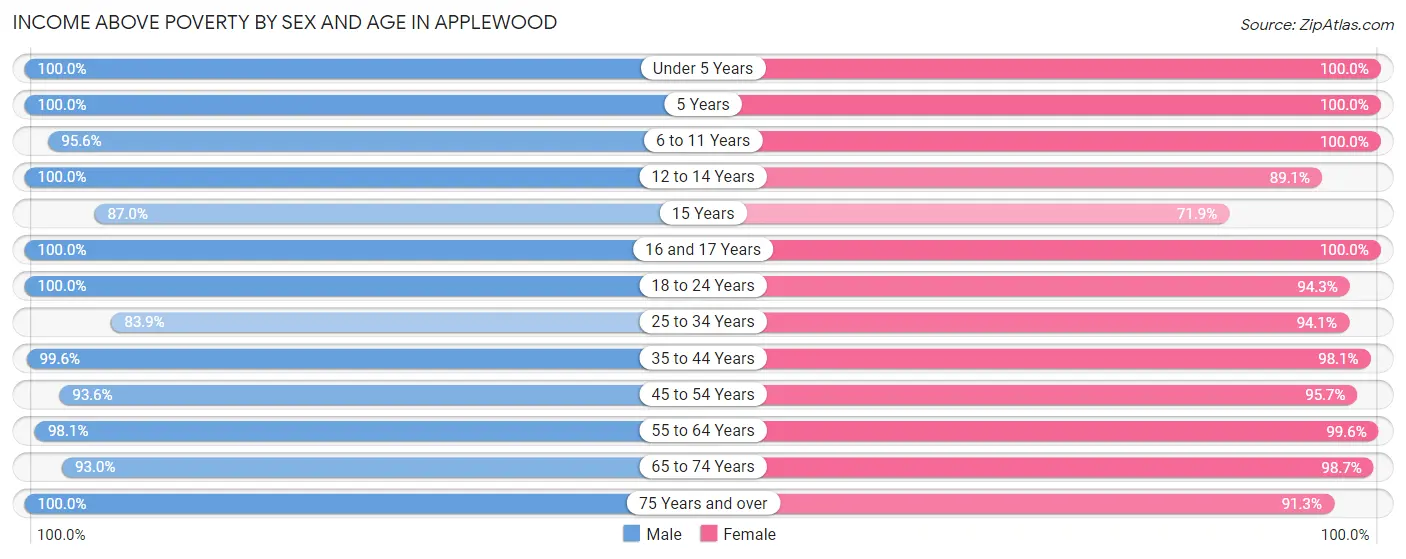
| Age Bracket | Male | Female |
| Under 5 Years | 237 (100.0%) | 159 (100.0%) |
| 5 Years | 31 (100.0%) | 49 (100.0%) |
| 6 to 11 Years | 216 (95.6%) | 196 (100.0%) |
| 12 to 14 Years | 74 (100.0%) | 139 (89.1%) |
| 15 Years | 87 (87.0%) | 23 (71.9%) |
| 16 and 17 Years | 115 (100.0%) | 100 (100.0%) |
| 18 to 24 Years | 186 (100.0%) | 164 (94.3%) |
| 25 to 34 Years | 448 (83.9%) | 478 (94.1%) |
| 35 to 44 Years | 517 (99.6%) | 617 (98.1%) |
| 45 to 54 Years | 696 (93.5%) | 531 (95.7%) |
| 55 to 64 Years | 507 (98.1%) | 511 (99.6%) |
| 65 to 74 Years | 508 (93.0%) | 536 (98.7%) |
| 75 Years and over | 215 (100.0%) | 294 (91.3%) |
| Total | 3,837 (94.9%) | 3,797 (96.5%) |
Income Below Poverty Among Married-Couple Families in Applewood
The poverty statistics for married-couple families in Applewood show that 0.7% or 12 of the total 1,805 families live below the poverty line. Families with 3 or 4 children have the highest poverty rate of 8.6%, comprising of 12 families. On the other hand, families with no children have the lowest poverty rate of 0.0%, which includes 0 families.
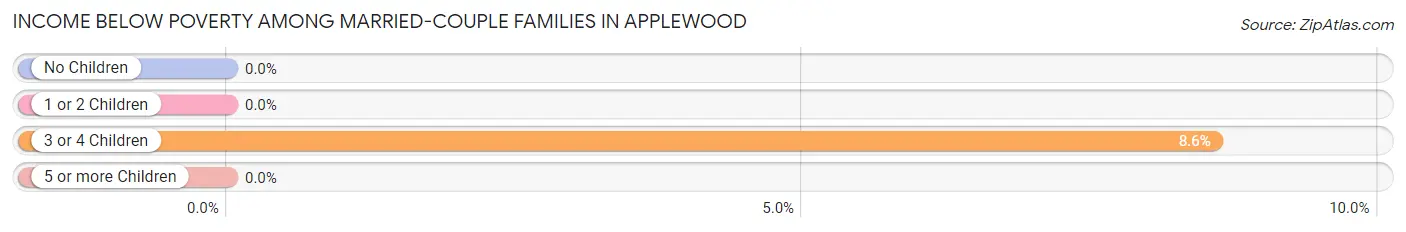
| Children | Above Poverty | Below Poverty |
| No Children | 1,065 (100.0%) | 0 (0.0%) |
| 1 or 2 Children | 593 (100.0%) | 0 (0.0%) |
| 3 or 4 Children | 128 (91.4%) | 12 (8.6%) |
| 5 or more Children | 7 (100.0%) | 0 (0.0%) |
| Total | 1,793 (99.3%) | 12 (0.7%) |
Income Below Poverty Among Single-Parent Households in Applewood
According to the poverty data in Applewood, 17.2% or 16 single-father households and 4.4% or 7 single-mother households are living below the poverty line. Among single-father households, those with 1 or 2 children have the highest poverty rate, with 8 households (29.6%) experiencing poverty. Likewise, among single-mother households, those with no children have the highest poverty rate, with 7 households (13.0%) falling below the poverty line.
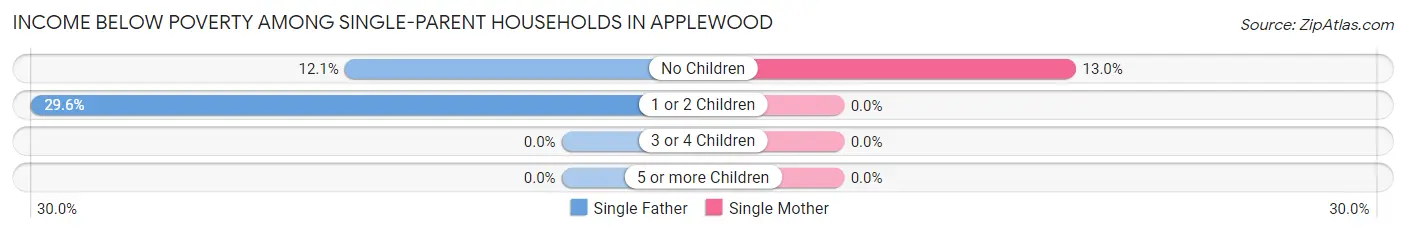
| Children | Single Father | Single Mother |
| No Children | 8 (12.1%) | 7 (13.0%) |
| 1 or 2 Children | 8 (29.6%) | 0 (0.0%) |
| 3 or 4 Children | 0 (0.0%) | 0 (0.0%) |
| 5 or more Children | 0 (0.0%) | 0 (0.0%) |
| Total | 16 (17.2%) | 7 (4.4%) |
Income Below Poverty Among Married-Couple vs Single-Parent Households in Applewood
The poverty data for Applewood shows that 12 of the married-couple family households (0.7%) and 23 of the single-parent households (9.1%) are living below the poverty level. Within the married-couple family households, those with 3 or 4 children have the highest poverty rate, with 12 households (8.6%) falling below the poverty line. Among the single-parent households, those with no children have the highest poverty rate, with 15 household (12.5%) living below poverty.
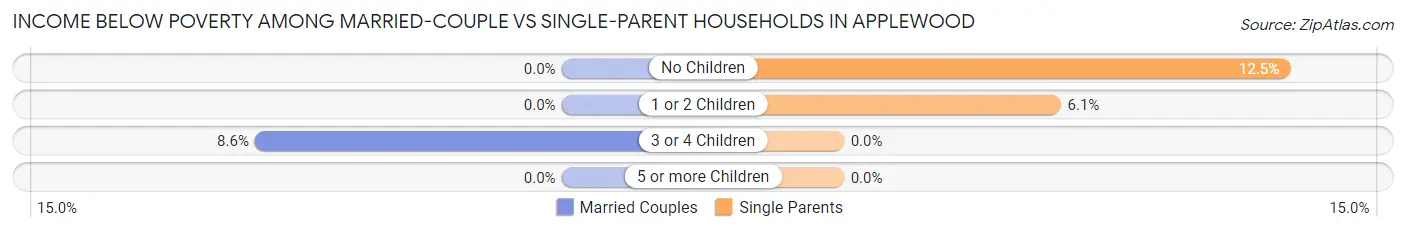
| Children | Married-Couple Families | Single-Parent Households |
| No Children | 0 (0.0%) | 15 (12.5%) |
| 1 or 2 Children | 0 (0.0%) | 8 (6.1%) |
| 3 or 4 Children | 12 (8.6%) | 0 (0.0%) |
| 5 or more Children | 0 (0.0%) | 0 (0.0%) |
| Total | 12 (0.7%) | 23 (9.1%) |
Employment Characteristics in Applewood
Employment by Class of Employer in Applewood
Among the 4,350 employed individuals in Applewood, private company employees (2,378 | 54.7%), not-for-profit organizations (419 | 9.6%), and self-employed (not incorporated) (417 | 9.6%) make up the most common classes of employment.
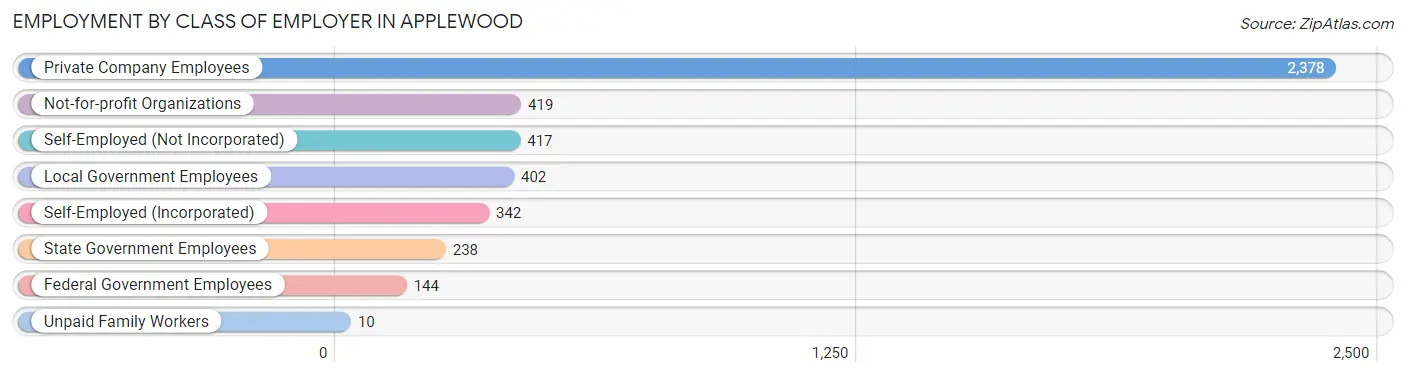
| Employer Class | # Employees | % Employees |
| Private Company Employees | 2,378 | 54.7% |
| Self-Employed (Incorporated) | 342 | 7.9% |
| Self-Employed (Not Incorporated) | 417 | 9.6% |
| Not-for-profit Organizations | 419 | 9.6% |
| Local Government Employees | 402 | 9.2% |
| State Government Employees | 238 | 5.5% |
| Federal Government Employees | 144 | 3.3% |
| Unpaid Family Workers | 10 | 0.2% |
| Total | 4,350 | 100.0% |
Employment Status by Age in Applewood
According to the labor force statistics for Applewood, out of the total population over 16 years of age (6,722), 69.9% or 4,699 individuals are in the labor force, with 6.1% or 287 of them unemployed. The age group with the highest labor force participation rate is 30 to 34 years, with 96.1% or 588 individuals in the labor force. Within the labor force, the 16 to 19 years age range has the highest percentage of unemployed individuals, with 47.5% or 77 of them being unemployed.
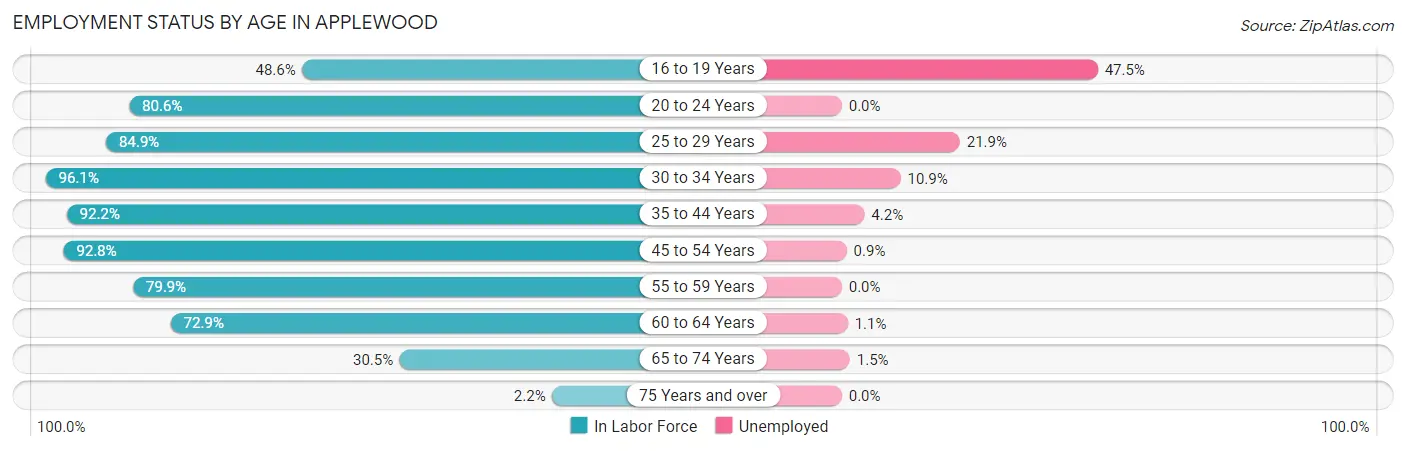
| Age Bracket | In Labor Force | Unemployed |
| 16 to 19 Years | 162 (48.6%) | 77 (47.5%) |
| 20 to 24 Years | 195 (80.6%) | 0 (0.0%) |
| 25 to 29 Years | 365 (84.9%) | 80 (21.9%) |
| 30 to 34 Years | 588 (96.1%) | 64 (10.9%) |
| 35 to 44 Years | 1,058 (92.2%) | 44 (4.2%) |
| 45 to 54 Years | 1,205 (92.8%) | 11 (0.9%) |
| 55 to 59 Years | 333 (79.9%) | 0 (0.0%) |
| 60 to 64 Years | 447 (72.9%) | 5 (1.1%) |
| 65 to 74 Years | 332 (30.5%) | 5 (1.5%) |
| 75 Years and over | 12 (2.2%) | 0 (0.0%) |
| Total | 4,699 (69.9%) | 287 (6.1%) |
Employment Status by Educational Attainment in Applewood
According to labor force statistics for Applewood, 88.4% of individuals (3,995) out of the total population between 25 and 64 years of age (4,519) are in the labor force, with 5.1% or 204 of them being unemployed. The group with the highest labor force participation rate are those with the educational attainment of bachelor's degree or higher, with 90.0% or 2,604 individuals in the labor force. Within the labor force, individuals with high school diploma education have the highest percentage of unemployment, with 13.2% or 61 of them being unemployed.
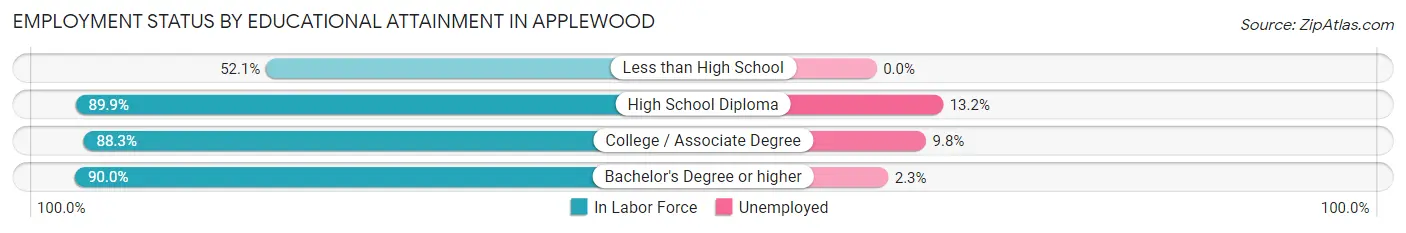
| Educational Attainment | In Labor Force | Unemployed |
| Less than High School | 74 (52.1%) | 0 (0.0%) |
| High School Diploma | 463 (89.9%) | 68 (13.2%) |
| College / Associate Degree | 856 (88.3%) | 95 (9.8%) |
| Bachelor's Degree or higher | 2,604 (90.0%) | 67 (2.3%) |
| Total | 3,995 (88.4%) | 230 (5.1%) |
Employment Occupations by Sex in Applewood
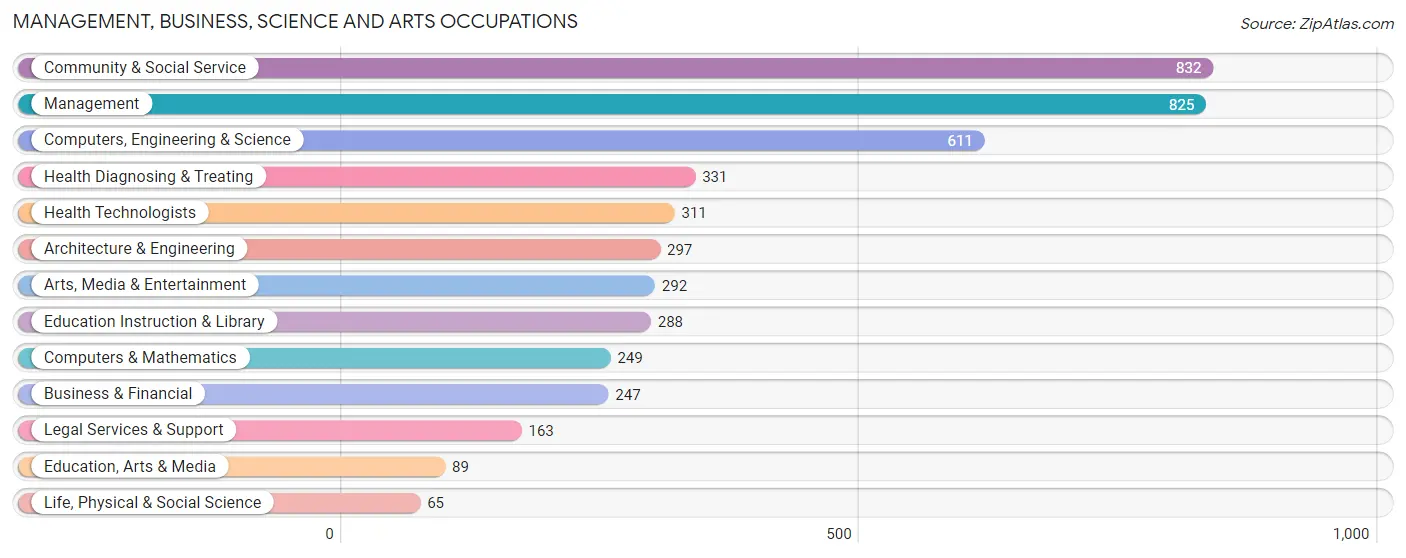
Management, Business, Science and Arts Occupations
The most common Management, Business, Science and Arts occupations in Applewood are Community & Social Service (832 | 18.9%), Management (825 | 18.7%), Computers, Engineering & Science (611 | 13.9%), Health Diagnosing & Treating (331 | 7.5%), and Health Technologists (311 | 7.0%).
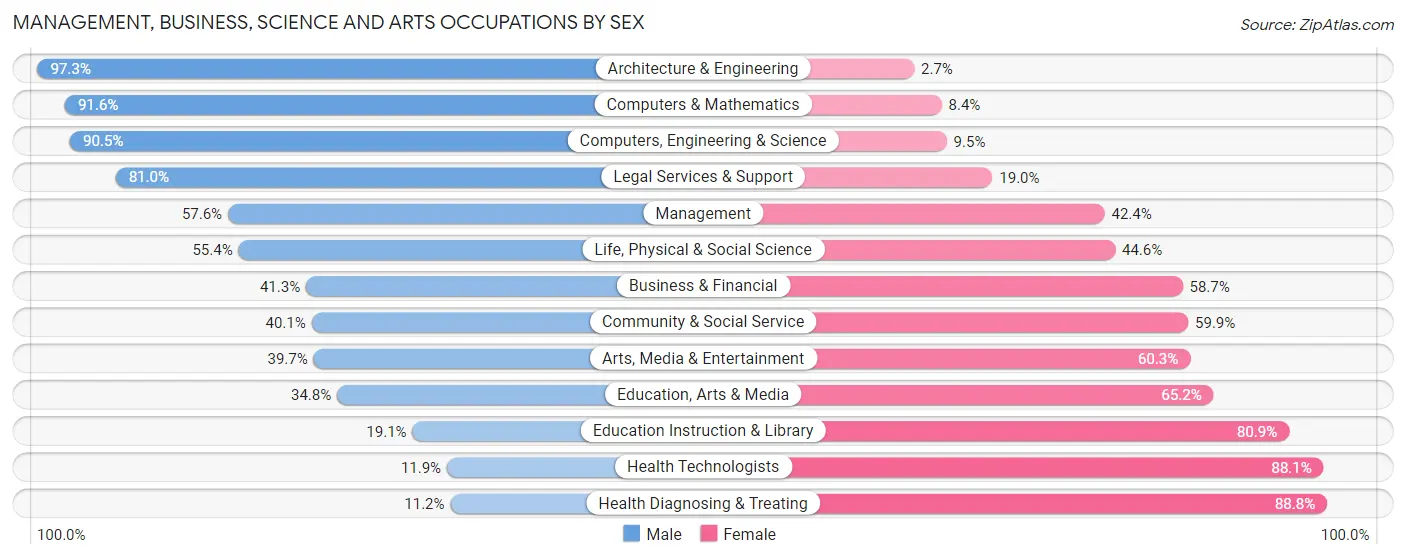
Management, Business, Science and Arts Occupations by Sex
Within the Management, Business, Science and Arts occupations in Applewood, the most male-oriented occupations are Architecture & Engineering (97.3%), Computers & Mathematics (91.6%), and Computers, Engineering & Science (90.5%), while the most female-oriented occupations are Health Diagnosing & Treating (88.8%), Health Technologists (88.1%), and Education Instruction & Library (80.9%).
| Occupation | Male | Female |
| Management | 475 (57.6%) | 350 (42.4%) |
| Business & Financial | 102 (41.3%) | 145 (58.7%) |
| Computers, Engineering & Science | 553 (90.5%) | 58 (9.5%) |
| Computers & Mathematics | 228 (91.6%) | 21 (8.4%) |
| Architecture & Engineering | 289 (97.3%) | 8 (2.7%) |
| Life, Physical & Social Science | 36 (55.4%) | 29 (44.6%) |
| Community & Social Service | 334 (40.1%) | 498 (59.9%) |
| Education, Arts & Media | 31 (34.8%) | 58 (65.2%) |
| Legal Services & Support | 132 (81.0%) | 31 (19.0%) |
| Education Instruction & Library | 55 (19.1%) | 233 (80.9%) |
| Arts, Media & Entertainment | 116 (39.7%) | 176 (60.3%) |
| Health Diagnosing & Treating | 37 (11.2%) | 294 (88.8%) |
| Health Technologists | 37 (11.9%) | 274 (88.1%) |
| Total (Category) | 1,501 (52.7%) | 1,345 (47.3%) |
| Total (Overall) | 2,431 (55.1%) | 1,980 (44.9%) |
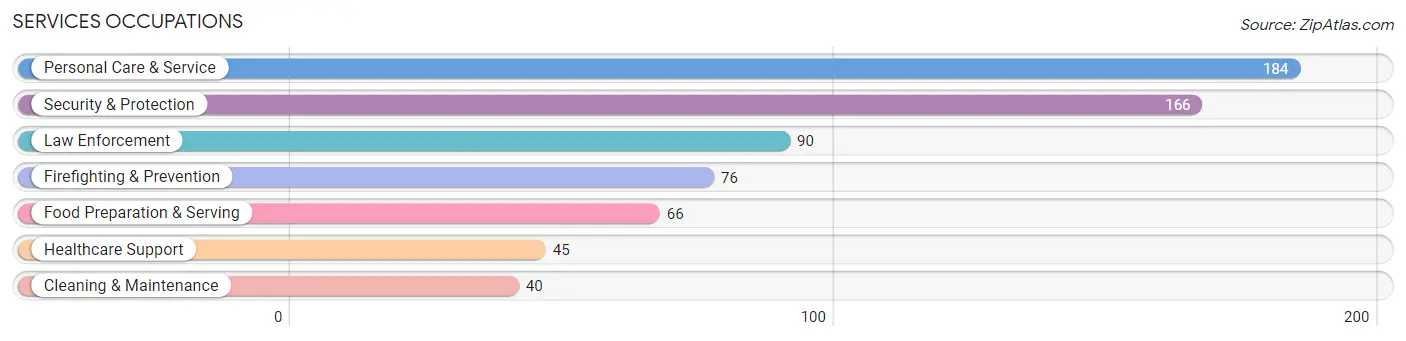
Services Occupations
The most common Services occupations in Applewood are Personal Care & Service (184 | 4.2%), Security & Protection (166 | 3.8%), Law Enforcement (90 | 2.0%), Firefighting & Prevention (76 | 1.7%), and Food Preparation & Serving (66 | 1.5%).
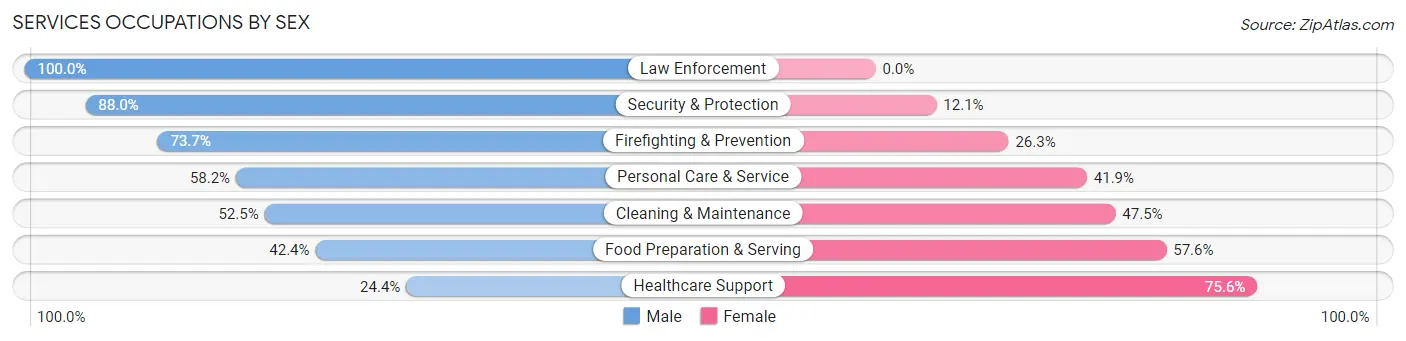
Services Occupations by Sex
Within the Services occupations in Applewood, the most male-oriented occupations are Law Enforcement (100.0%), Security & Protection (87.9%), and Firefighting & Prevention (73.7%), while the most female-oriented occupations are Healthcare Support (75.6%), Food Preparation & Serving (57.6%), and Cleaning & Maintenance (47.5%).
| Occupation | Male | Female |
| Healthcare Support | 11 (24.4%) | 34 (75.6%) |
| Security & Protection | 146 (87.9%) | 20 (12.0%) |
| Firefighting & Prevention | 56 (73.7%) | 20 (26.3%) |
| Law Enforcement | 90 (100.0%) | 0 (0.0%) |
| Food Preparation & Serving | 28 (42.4%) | 38 (57.6%) |
| Cleaning & Maintenance | 21 (52.5%) | 19 (47.5%) |
| Personal Care & Service | 107 (58.2%) | 77 (41.8%) |
| Total (Category) | 313 (62.5%) | 188 (37.5%) |
| Total (Overall) | 2,431 (55.1%) | 1,980 (44.9%) |
Sales and Office Occupations
The most common Sales and Office occupations in Applewood are Sales & Related (412 | 9.3%), and Office & Administration (321 | 7.3%).
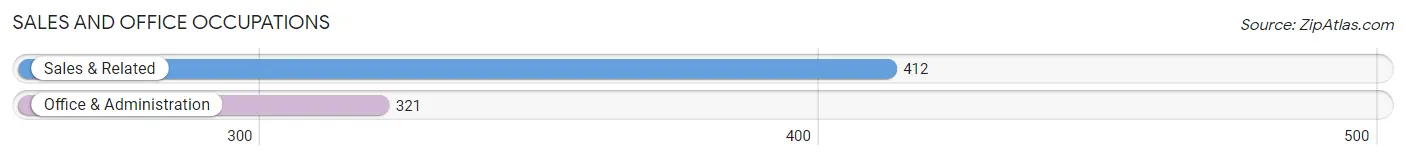
Sales and Office Occupations by Sex
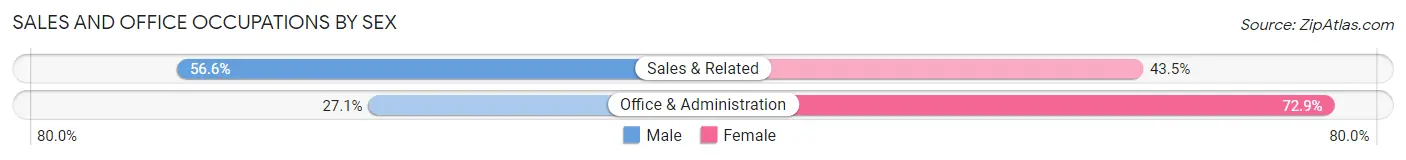
| Occupation | Male | Female |
| Sales & Related | 233 (56.6%) | 179 (43.4%) |
| Office & Administration | 87 (27.1%) | 234 (72.9%) |
| Total (Category) | 320 (43.7%) | 413 (56.3%) |
| Total (Overall) | 2,431 (55.1%) | 1,980 (44.9%) |
Natural Resources, Construction and Maintenance Occupations
The most common Natural Resources, Construction and Maintenance occupations in Applewood are Construction & Extraction (57 | 1.3%), and Installation, Maintenance & Repair (8 | 0.2%).
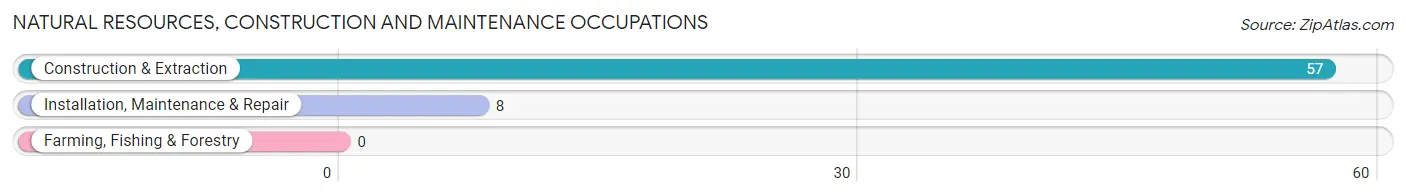
Natural Resources, Construction and Maintenance Occupations by Sex
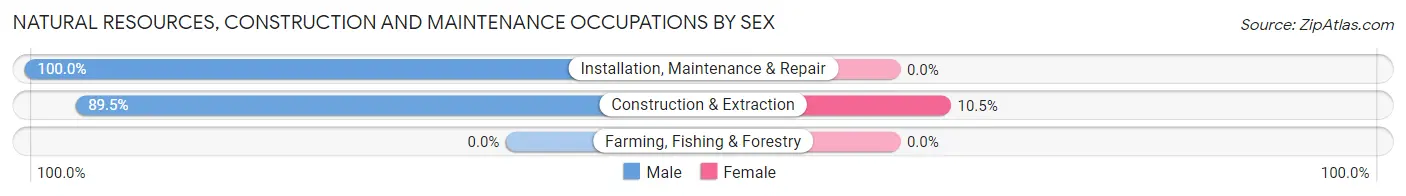
| Occupation | Male | Female |
| Farming, Fishing & Forestry | 0 (0.0%) | 0 (0.0%) |
| Construction & Extraction | 51 (89.5%) | 6 (10.5%) |
| Installation, Maintenance & Repair | 8 (100.0%) | 0 (0.0%) |
| Total (Category) | 59 (90.8%) | 6 (9.2%) |
| Total (Overall) | 2,431 (55.1%) | 1,980 (44.9%) |
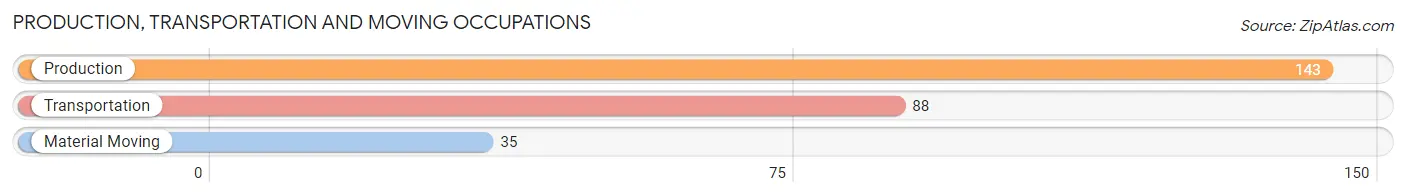
Production, Transportation and Moving Occupations
The most common Production, Transportation and Moving occupations in Applewood are Production (143 | 3.2%), Transportation (88 | 2.0%), and Material Moving (35 | 0.8%).
Production, Transportation and Moving Occupations by Sex
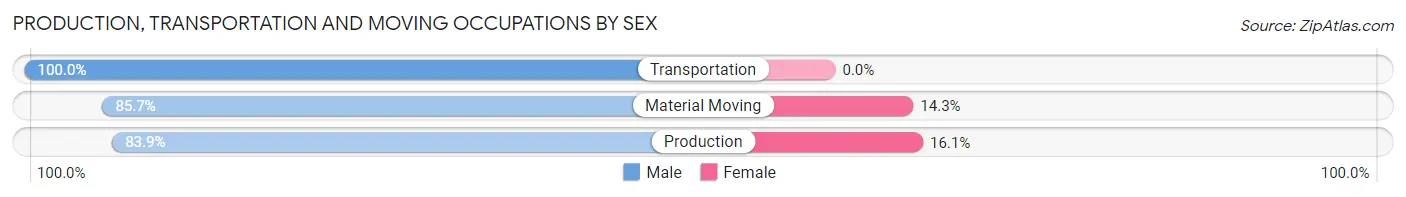
| Occupation | Male | Female |
| Production | 120 (83.9%) | 23 (16.1%) |
| Transportation | 88 (100.0%) | 0 (0.0%) |
| Material Moving | 30 (85.7%) | 5 (14.3%) |
| Total (Category) | 238 (89.5%) | 28 (10.5%) |
| Total (Overall) | 2,431 (55.1%) | 1,980 (44.9%) |
Employment Industries by Sex in Applewood
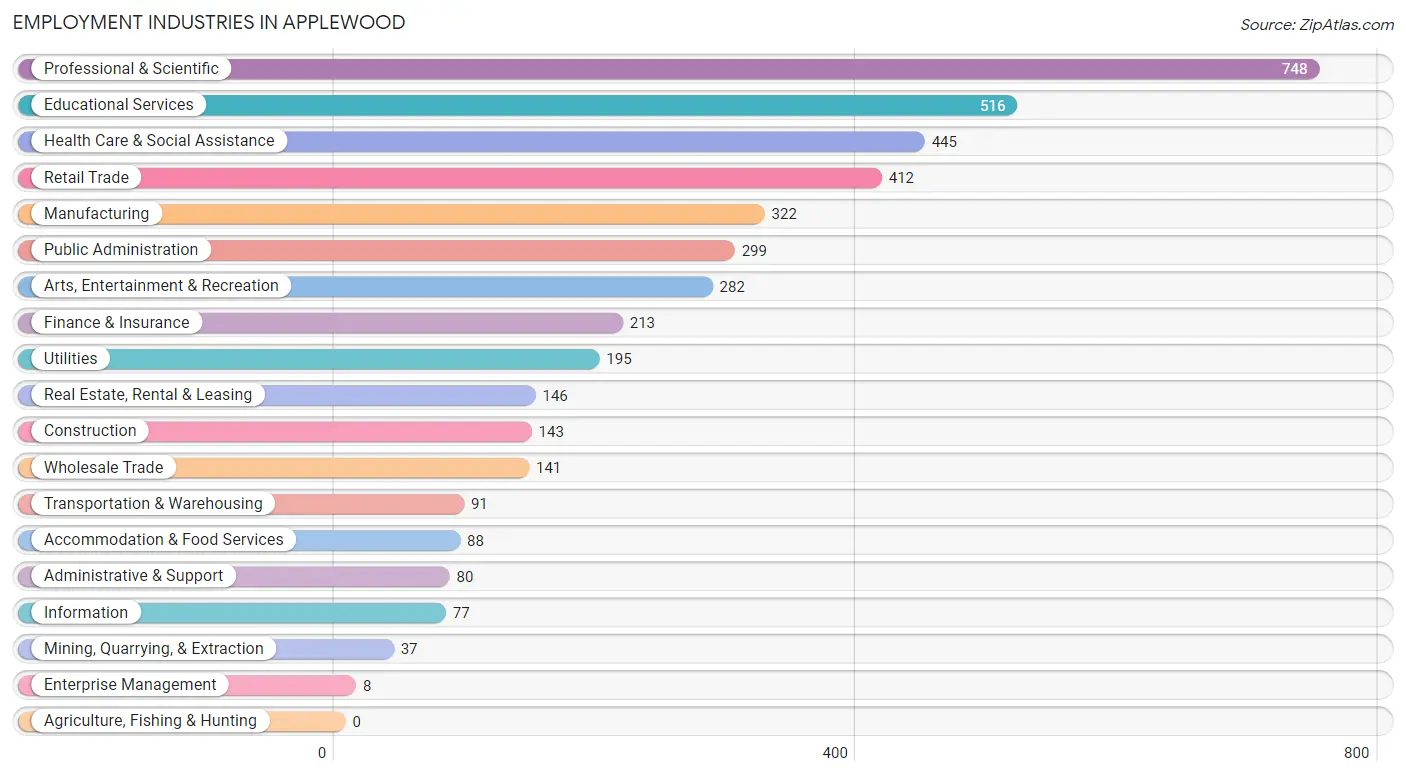
Employment Industries in Applewood
The major employment industries in Applewood include Professional & Scientific (748 | 17.0%), Educational Services (516 | 11.7%), Health Care & Social Assistance (445 | 10.1%), Retail Trade (412 | 9.3%), and Manufacturing (322 | 7.3%).
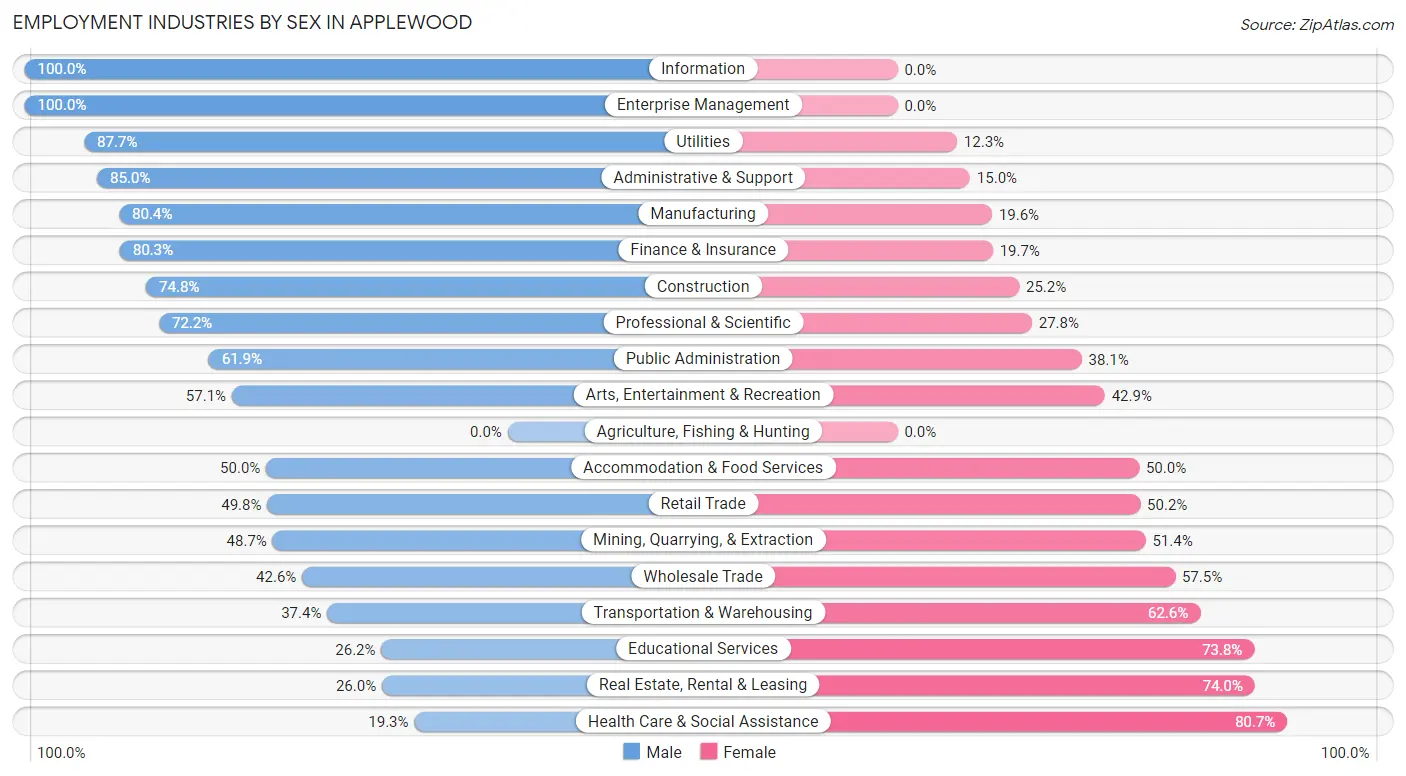
Employment Industries by Sex in Applewood
The Applewood industries that see more men than women are Information (100.0%), Enterprise Management (100.0%), and Utilities (87.7%), whereas the industries that tend to have a higher number of women are Health Care & Social Assistance (80.7%), Real Estate, Rental & Leasing (74.0%), and Educational Services (73.8%).
| Industry | Male | Female |
| Agriculture, Fishing & Hunting | 0 (0.0%) | 0 (0.0%) |
| Mining, Quarrying, & Extraction | 18 (48.6%) | 19 (51.3%) |
| Construction | 107 (74.8%) | 36 (25.2%) |
| Manufacturing | 259 (80.4%) | 63 (19.6%) |
| Wholesale Trade | 60 (42.5%) | 81 (57.5%) |
| Retail Trade | 205 (49.8%) | 207 (50.2%) |
| Transportation & Warehousing | 34 (37.4%) | 57 (62.6%) |
| Utilities | 171 (87.7%) | 24 (12.3%) |
| Information | 77 (100.0%) | 0 (0.0%) |
| Finance & Insurance | 171 (80.3%) | 42 (19.7%) |
| Real Estate, Rental & Leasing | 38 (26.0%) | 108 (74.0%) |
| Professional & Scientific | 540 (72.2%) | 208 (27.8%) |
| Enterprise Management | 8 (100.0%) | 0 (0.0%) |
| Administrative & Support | 68 (85.0%) | 12 (15.0%) |
| Educational Services | 135 (26.2%) | 381 (73.8%) |
| Health Care & Social Assistance | 86 (19.3%) | 359 (80.7%) |
| Arts, Entertainment & Recreation | 161 (57.1%) | 121 (42.9%) |
| Accommodation & Food Services | 44 (50.0%) | 44 (50.0%) |
| Public Administration | 185 (61.9%) | 114 (38.1%) |
| Total | 2,431 (55.1%) | 1,980 (44.9%) |
Education in Applewood
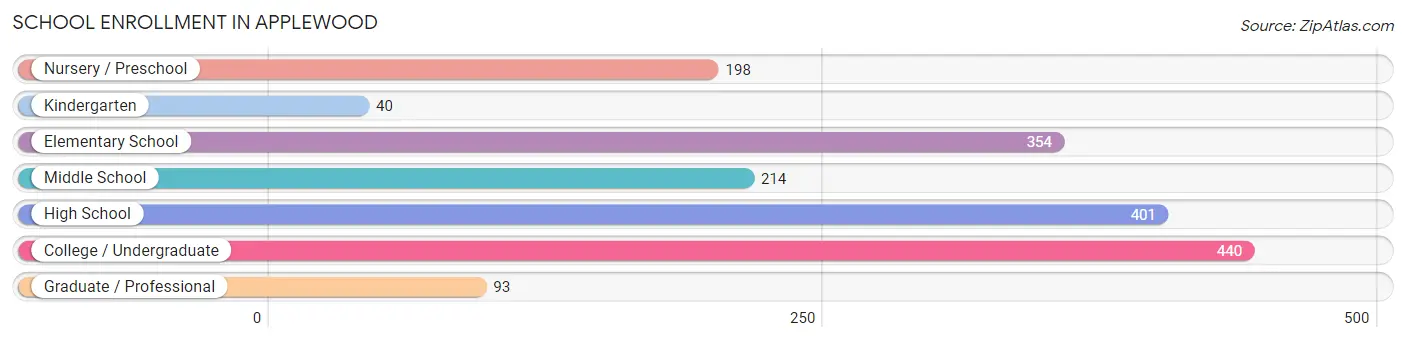
School Enrollment in Applewood
The most common levels of schooling among the 1,740 students in Applewood are college / undergraduate (440 | 25.3%), high school (401 | 23.1%), and elementary school (354 | 20.3%).
| School Level | # Students | % Students |
| Nursery / Preschool | 198 | 11.4% |
| Kindergarten | 40 | 2.3% |
| Elementary School | 354 | 20.3% |
| Middle School | 214 | 12.3% |
| High School | 401 | 23.1% |
| College / Undergraduate | 440 | 25.3% |
| Graduate / Professional | 93 | 5.3% |
| Total | 1,740 | 100.0% |
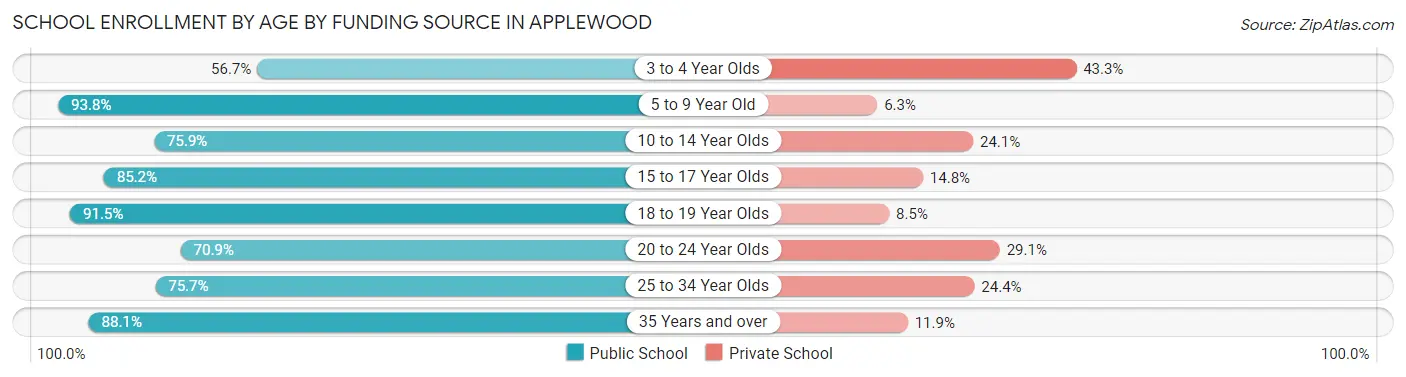
School Enrollment by Age by Funding Source in Applewood
Out of a total of 1,740 students who are enrolled in schools in Applewood, 311 (17.9%) attend a private institution, while the remaining 1,429 (82.1%) are enrolled in public schools. The age group of 3 to 4 year olds has the highest likelihood of being enrolled in private schools, with 68 (43.3% in the age bracket) enrolled. Conversely, the age group of 5 to 9 year old has the lowest likelihood of being enrolled in a private school, with 375 (93.8% in the age bracket) attending a public institution.
| Age Bracket | Public School | Private School |
| 3 to 4 Year Olds | 89 (56.7%) | 68 (43.3%) |
| 5 to 9 Year Old | 375 (93.8%) | 25 (6.2%) |
| 10 to 14 Year Olds | 211 (75.9%) | 67 (24.1%) |
| 15 to 17 Year Olds | 283 (85.2%) | 49 (14.8%) |
| 18 to 19 Year Olds | 108 (91.5%) | 10 (8.5%) |
| 20 to 24 Year Olds | 61 (70.9%) | 25 (29.1%) |
| 25 to 34 Year Olds | 146 (75.6%) | 47 (24.3%) |
| 35 Years and over | 155 (88.1%) | 21 (11.9%) |
| Total | 1,429 (82.1%) | 311 (17.9%) |
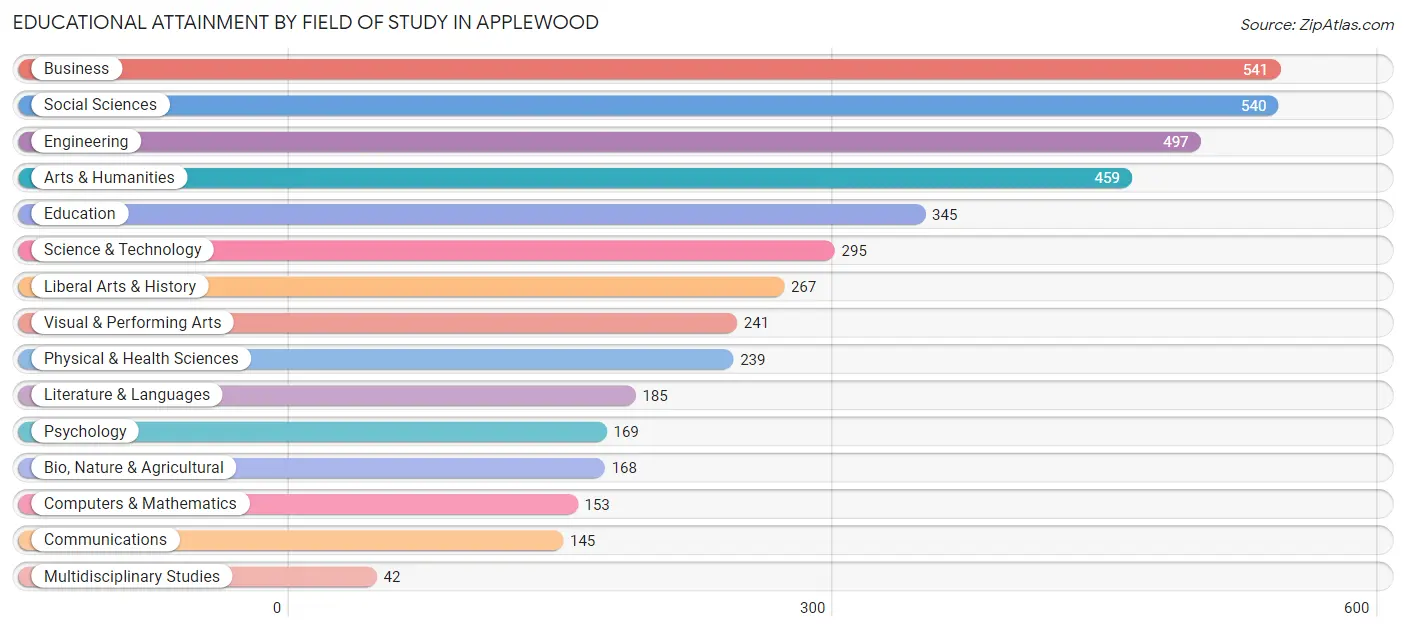
Educational Attainment by Field of Study in Applewood
Business (541 | 12.6%), social sciences (540 | 12.6%), engineering (497 | 11.6%), arts & humanities (459 | 10.7%), and education (345 | 8.1%) are the most common fields of study among 4,286 individuals in Applewood who have obtained a bachelor's degree or higher.
| Field of Study | # Graduates | % Graduates |
| Computers & Mathematics | 153 | 3.6% |
| Bio, Nature & Agricultural | 168 | 3.9% |
| Physical & Health Sciences | 239 | 5.6% |
| Psychology | 169 | 3.9% |
| Social Sciences | 540 | 12.6% |
| Engineering | 497 | 11.6% |
| Multidisciplinary Studies | 42 | 1.0% |
| Science & Technology | 295 | 6.9% |
| Business | 541 | 12.6% |
| Education | 345 | 8.1% |
| Literature & Languages | 185 | 4.3% |
| Liberal Arts & History | 267 | 6.2% |
| Visual & Performing Arts | 241 | 5.6% |
| Communications | 145 | 3.4% |
| Arts & Humanities | 459 | 10.7% |
| Total | 4,286 | 100.0% |
Transportation & Commute in Applewood
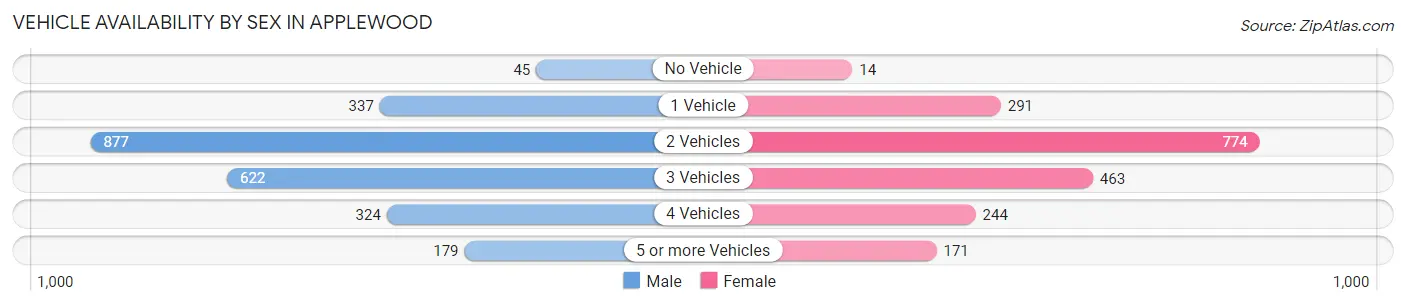
Vehicle Availability by Sex in Applewood
The most prevalent vehicle ownership categories in Applewood are males with 2 vehicles (877, accounting for 36.8%) and females with 2 vehicles (774, making up 44.8%).
| Vehicles Available | Male | Female |
| No Vehicle | 45 (1.9%) | 14 (0.7%) |
| 1 Vehicle | 337 (14.1%) | 291 (14.9%) |
| 2 Vehicles | 877 (36.8%) | 774 (39.6%) |
| 3 Vehicles | 622 (26.1%) | 463 (23.7%) |
| 4 Vehicles | 324 (13.6%) | 244 (12.5%) |
| 5 or more Vehicles | 179 (7.5%) | 171 (8.7%) |
| Total | 2,384 (100.0%) | 1,957 (100.0%) |
Commute Time in Applewood
The most frequently occuring commute durations in Applewood are 30 to 34 minutes (564 commuters, 16.0%), 20 to 24 minutes (476 commuters, 13.5%), and 10 to 14 minutes (464 commuters, 13.1%).
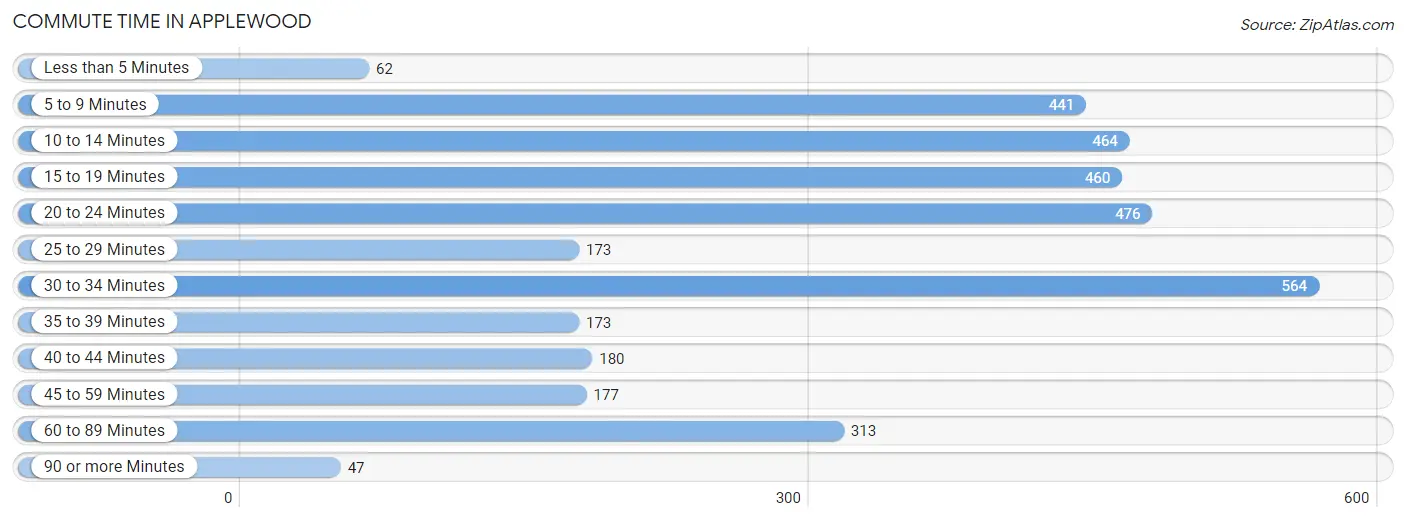
| Commute Time | # Commuters | % Commuters |
| Less than 5 Minutes | 62 | 1.8% |
| 5 to 9 Minutes | 441 | 12.5% |
| 10 to 14 Minutes | 464 | 13.1% |
| 15 to 19 Minutes | 460 | 13.0% |
| 20 to 24 Minutes | 476 | 13.5% |
| 25 to 29 Minutes | 173 | 4.9% |
| 30 to 34 Minutes | 564 | 16.0% |
| 35 to 39 Minutes | 173 | 4.9% |
| 40 to 44 Minutes | 180 | 5.1% |
| 45 to 59 Minutes | 177 | 5.0% |
| 60 to 89 Minutes | 313 | 8.9% |
| 90 or more Minutes | 47 | 1.3% |
Commute Time by Sex in Applewood
The most common commute times in Applewood are 30 to 34 minutes (436 commuters, 22.0%) for males and 5 to 9 minutes (240 commuters, 15.5%) for females.
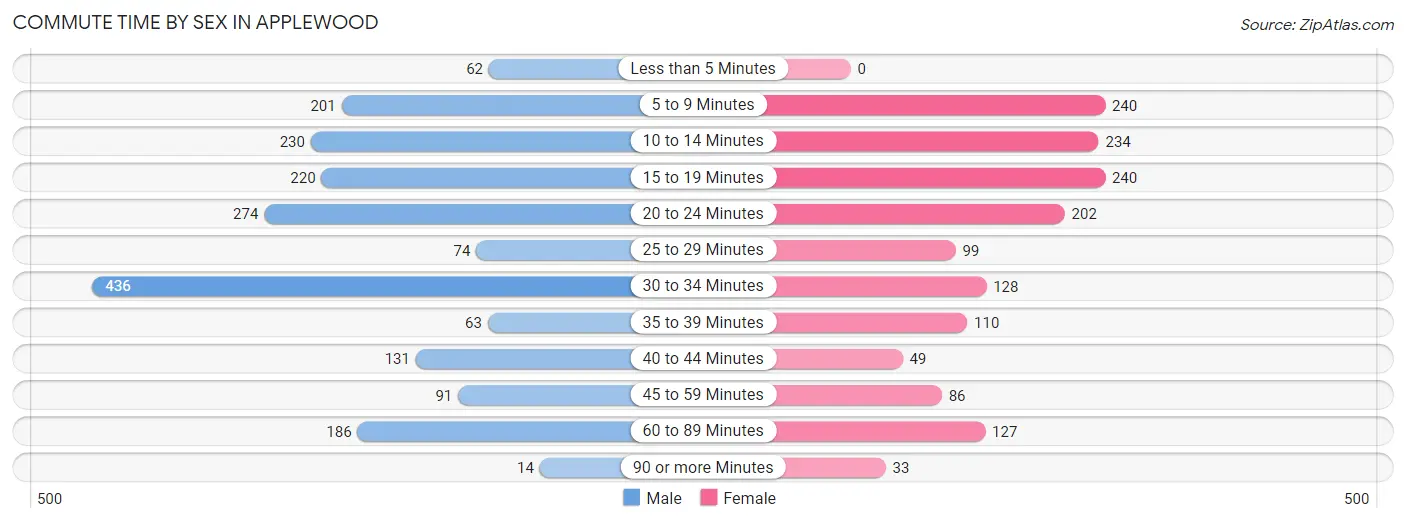
| Commute Time | Male | Female |
| Less than 5 Minutes | 62 (3.1%) | 0 (0.0%) |
| 5 to 9 Minutes | 201 (10.1%) | 240 (15.5%) |
| 10 to 14 Minutes | 230 (11.6%) | 234 (15.1%) |
| 15 to 19 Minutes | 220 (11.1%) | 240 (15.5%) |
| 20 to 24 Minutes | 274 (13.8%) | 202 (13.1%) |
| 25 to 29 Minutes | 74 (3.7%) | 99 (6.4%) |
| 30 to 34 Minutes | 436 (22.0%) | 128 (8.3%) |
| 35 to 39 Minutes | 63 (3.2%) | 110 (7.1%) |
| 40 to 44 Minutes | 131 (6.6%) | 49 (3.2%) |
| 45 to 59 Minutes | 91 (4.6%) | 86 (5.6%) |
| 60 to 89 Minutes | 186 (9.4%) | 127 (8.2%) |
| 90 or more Minutes | 14 (0.7%) | 33 (2.1%) |
Time of Departure to Work by Sex in Applewood
The most frequent times of departure to work in Applewood are 7:00 AM to 7:29 AM (354, 17.9%) for males and 8:00 AM to 8:29 AM (357, 23.1%) for females.
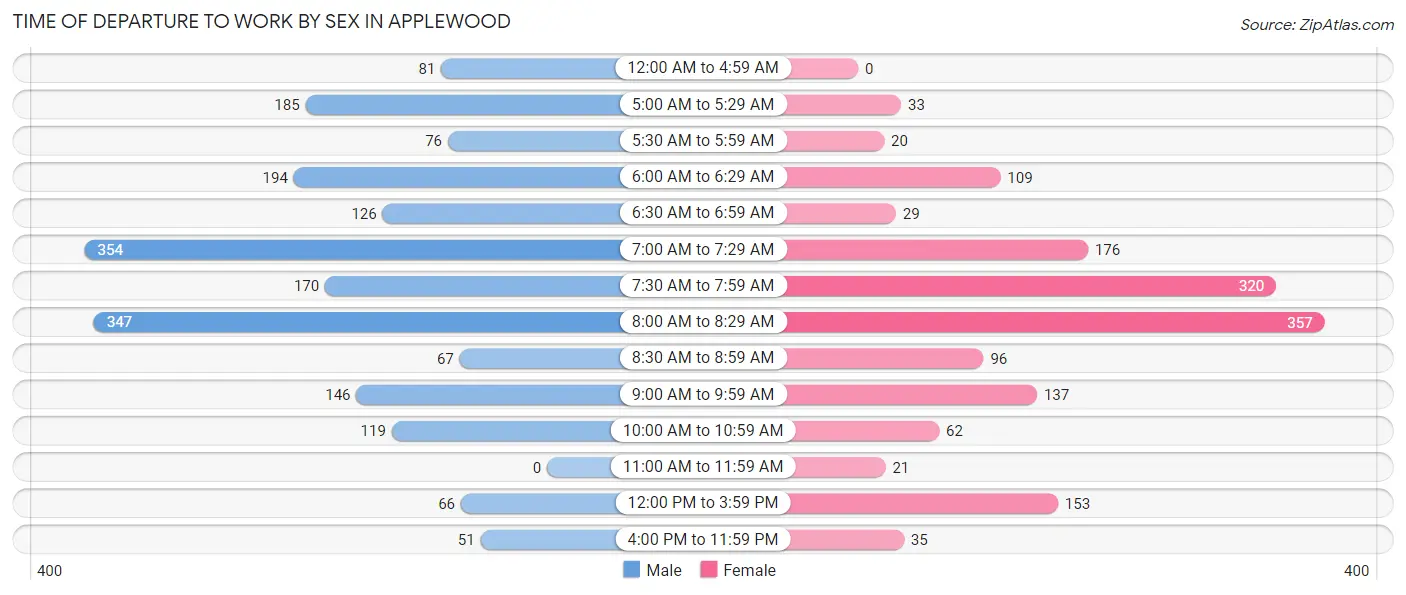
| Time of Departure | Male | Female |
| 12:00 AM to 4:59 AM | 81 (4.1%) | 0 (0.0%) |
| 5:00 AM to 5:29 AM | 185 (9.3%) | 33 (2.1%) |
| 5:30 AM to 5:59 AM | 76 (3.8%) | 20 (1.3%) |
| 6:00 AM to 6:29 AM | 194 (9.8%) | 109 (7.0%) |
| 6:30 AM to 6:59 AM | 126 (6.4%) | 29 (1.9%) |
| 7:00 AM to 7:29 AM | 354 (17.9%) | 176 (11.4%) |
| 7:30 AM to 7:59 AM | 170 (8.6%) | 320 (20.7%) |
| 8:00 AM to 8:29 AM | 347 (17.5%) | 357 (23.1%) |
| 8:30 AM to 8:59 AM | 67 (3.4%) | 96 (6.2%) |
| 9:00 AM to 9:59 AM | 146 (7.4%) | 137 (8.8%) |
| 10:00 AM to 10:59 AM | 119 (6.0%) | 62 (4.0%) |
| 11:00 AM to 11:59 AM | 0 (0.0%) | 21 (1.4%) |
| 12:00 PM to 3:59 PM | 66 (3.3%) | 153 (9.9%) |
| 4:00 PM to 11:59 PM | 51 (2.6%) | 35 (2.3%) |
| Total | 1,982 (100.0%) | 1,548 (100.0%) |
Housing Occupancy in Applewood
Occupancy by Ownership in Applewood
Of the total 3,296 dwellings in Applewood, owner-occupied units account for 2,594 (78.7%), while renter-occupied units make up 702 (21.3%).
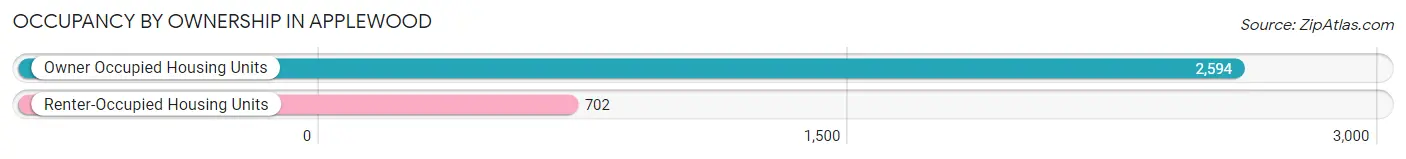
| Occupancy | # Housing Units | % Housing Units |
| Owner Occupied Housing Units | 2,594 | 78.7% |
| Renter-Occupied Housing Units | 702 | 21.3% |
| Total Occupied Housing Units | 3,296 | 100.0% |
Occupancy by Household Size in Applewood
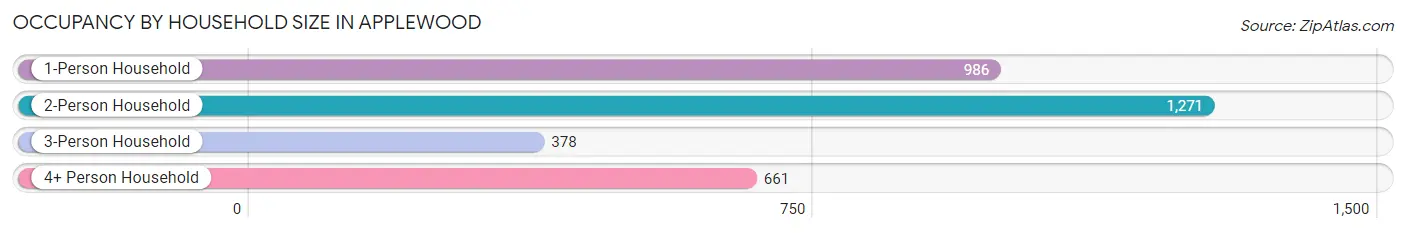
| Household Size | # Housing Units | % Housing Units |
| 1-Person Household | 986 | 29.9% |
| 2-Person Household | 1,271 | 38.6% |
| 3-Person Household | 378 | 11.5% |
| 4+ Person Household | 661 | 20.1% |
| Total Housing Units | 3,296 | 100.0% |
Occupancy by Ownership by Household Size in Applewood
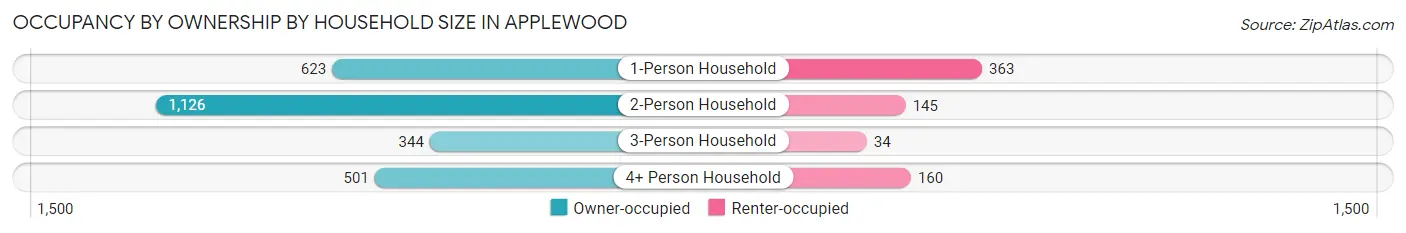
| Household Size | Owner-occupied | Renter-occupied |
| 1-Person Household | 623 (63.2%) | 363 (36.8%) |
| 2-Person Household | 1,126 (88.6%) | 145 (11.4%) |
| 3-Person Household | 344 (91.0%) | 34 (9.0%) |
| 4+ Person Household | 501 (75.8%) | 160 (24.2%) |
| Total Housing Units | 2,594 (78.7%) | 702 (21.3%) |
Occupancy by Educational Attainment in Applewood
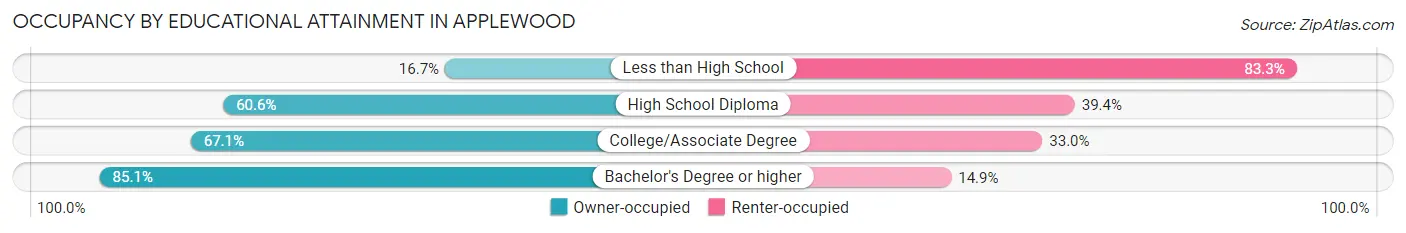
| Household Size | Owner-occupied | Renter-occupied |
| Less than High School | 7 (16.7%) | 35 (83.3%) |
| High School Diploma | 137 (60.6%) | 89 (39.4%) |
| College/Associate Degree | 472 (67.0%) | 232 (33.0%) |
| Bachelor's Degree or higher | 1,978 (85.1%) | 346 (14.9%) |
Occupancy by Age of Householder in Applewood
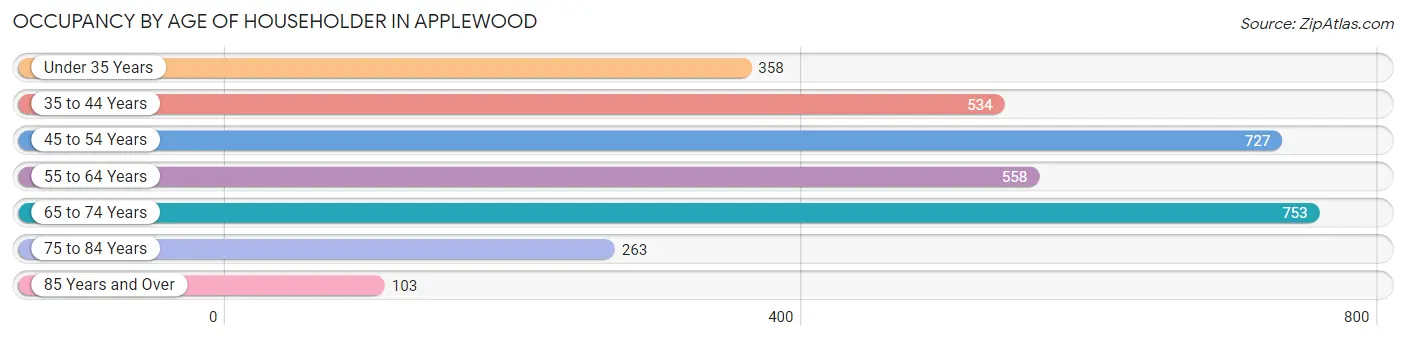
| Age Bracket | # Households | % Households |
| Under 35 Years | 358 | 10.9% |
| 35 to 44 Years | 534 | 16.2% |
| 45 to 54 Years | 727 | 22.1% |
| 55 to 64 Years | 558 | 16.9% |
| 65 to 74 Years | 753 | 22.9% |
| 75 to 84 Years | 263 | 8.0% |
| 85 Years and Over | 103 | 3.1% |
| Total | 3,296 | 100.0% |
Housing Finances in Applewood
Median Income by Occupancy in Applewood
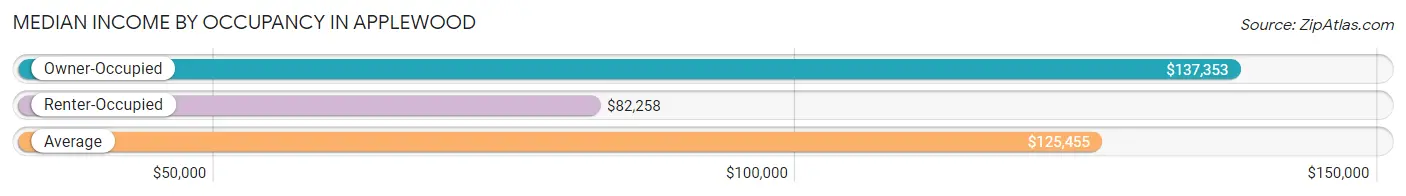
| Occupancy Type | # Households | Median Income |
| Owner-Occupied | 2,594 (78.7%) | $137,353 |
| Renter-Occupied | 702 (21.3%) | $82,258 |
| Average | 3,296 (100.0%) | $125,455 |
Occupancy by Householder Income Bracket in Applewood
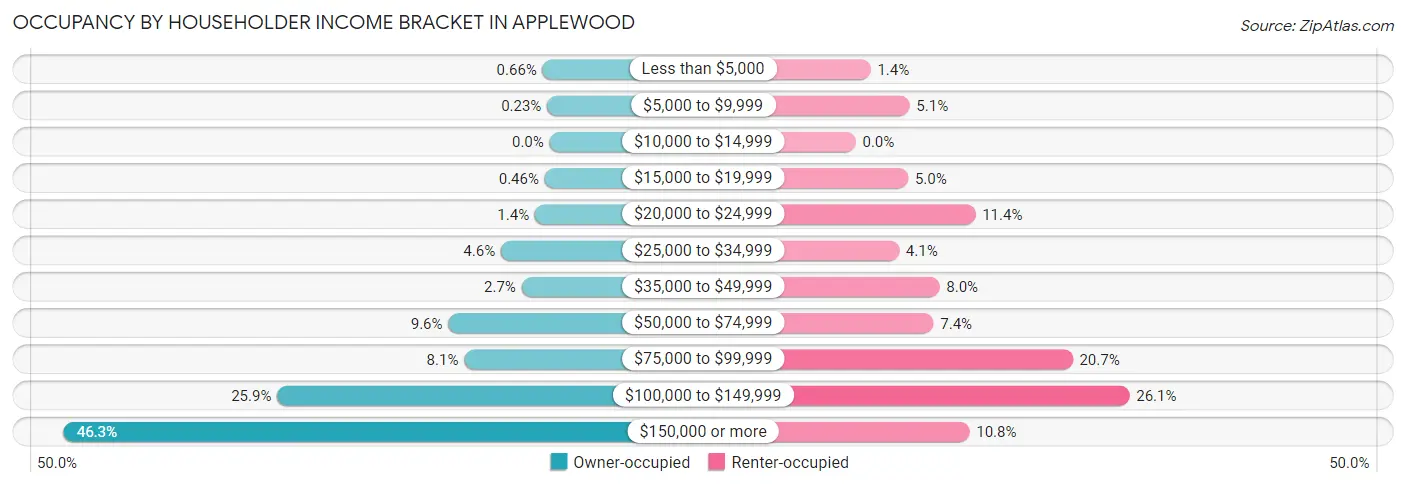
| Income Bracket | Owner-occupied | Renter-occupied |
| Less than $5,000 | 17 (0.7%) | 10 (1.4%) |
| $5,000 to $9,999 | 6 (0.2%) | 36 (5.1%) |
| $10,000 to $14,999 | 0 (0.0%) | 0 (0.0%) |
| $15,000 to $19,999 | 12 (0.5%) | 35 (5.0%) |
| $20,000 to $24,999 | 36 (1.4%) | 80 (11.4%) |
| $25,000 to $34,999 | 120 (4.6%) | 29 (4.1%) |
| $35,000 to $49,999 | 69 (2.7%) | 56 (8.0%) |
| $50,000 to $74,999 | 250 (9.6%) | 52 (7.4%) |
| $75,000 to $99,999 | 211 (8.1%) | 145 (20.7%) |
| $100,000 to $149,999 | 673 (25.9%) | 183 (26.1%) |
| $150,000 or more | 1,200 (46.3%) | 76 (10.8%) |
| Total | 2,594 (100.0%) | 702 (100.0%) |
Monthly Housing Cost Tiers in Applewood
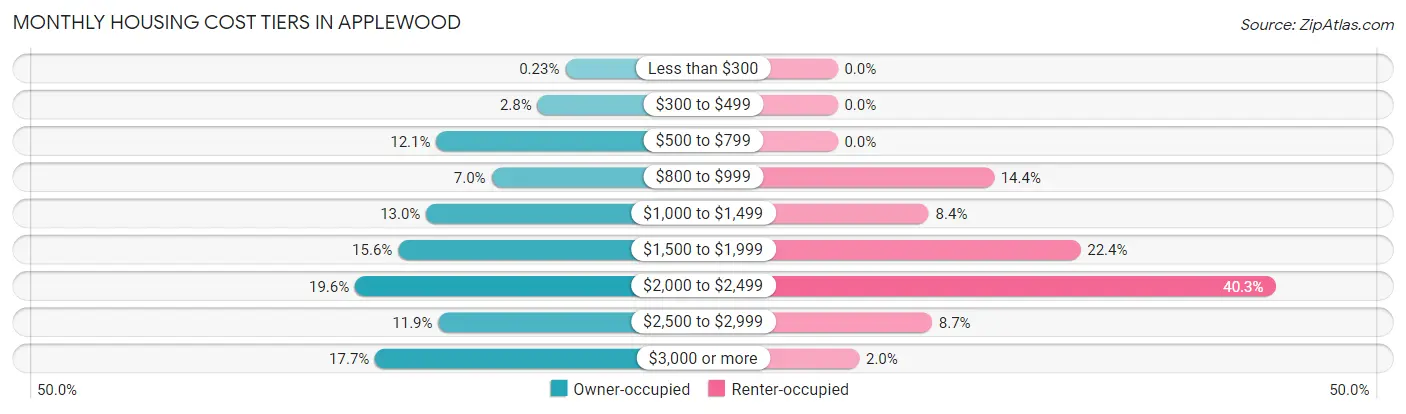
| Monthly Cost | Owner-occupied | Renter-occupied |
| Less than $300 | 6 (0.2%) | 0 (0.0%) |
| $300 to $499 | 72 (2.8%) | 0 (0.0%) |
| $500 to $799 | 314 (12.1%) | 0 (0.0%) |
| $800 to $999 | 182 (7.0%) | 101 (14.4%) |
| $1,000 to $1,499 | 338 (13.0%) | 59 (8.4%) |
| $1,500 to $1,999 | 405 (15.6%) | 157 (22.4%) |
| $2,000 to $2,499 | 508 (19.6%) | 283 (40.3%) |
| $2,500 to $2,999 | 309 (11.9%) | 61 (8.7%) |
| $3,000 or more | 460 (17.7%) | 14 (2.0%) |
| Total | 2,594 (100.0%) | 702 (100.0%) |
Physical Housing Characteristics in Applewood
Housing Structures in Applewood
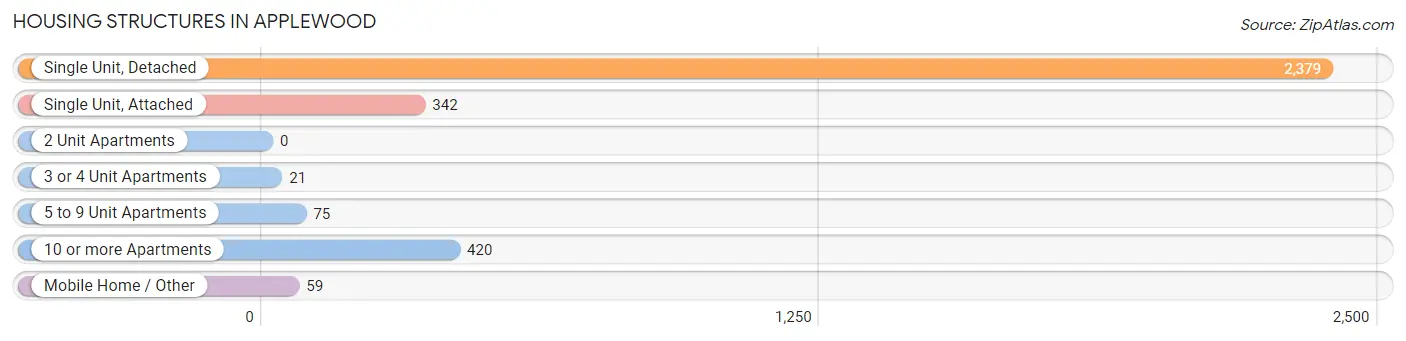
| Structure Type | # Housing Units | % Housing Units |
| Single Unit, Detached | 2,379 | 72.2% |
| Single Unit, Attached | 342 | 10.4% |
| 2 Unit Apartments | 0 | 0.0% |
| 3 or 4 Unit Apartments | 21 | 0.6% |
| 5 to 9 Unit Apartments | 75 | 2.3% |
| 10 or more Apartments | 420 | 12.7% |
| Mobile Home / Other | 59 | 1.8% |
| Total | 3,296 | 100.0% |
Housing Structures by Occupancy in Applewood
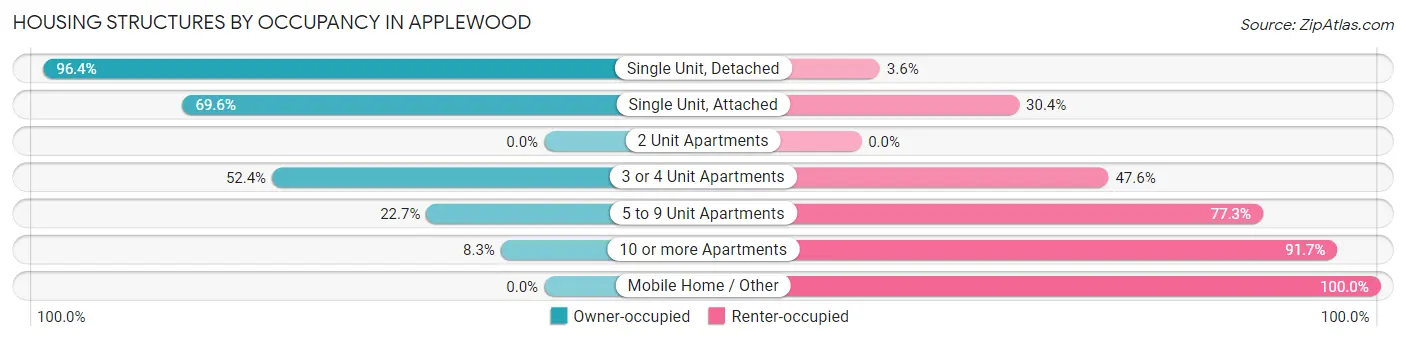
| Structure Type | Owner-occupied | Renter-occupied |
| Single Unit, Detached | 2,293 (96.4%) | 86 (3.6%) |
| Single Unit, Attached | 238 (69.6%) | 104 (30.4%) |
| 2 Unit Apartments | 0 (0.0%) | 0 (0.0%) |
| 3 or 4 Unit Apartments | 11 (52.4%) | 10 (47.6%) |
| 5 to 9 Unit Apartments | 17 (22.7%) | 58 (77.3%) |
| 10 or more Apartments | 35 (8.3%) | 385 (91.7%) |
| Mobile Home / Other | 0 (0.0%) | 59 (100.0%) |
| Total | 2,594 (78.7%) | 702 (21.3%) |
Housing Structures by Number of Rooms in Applewood
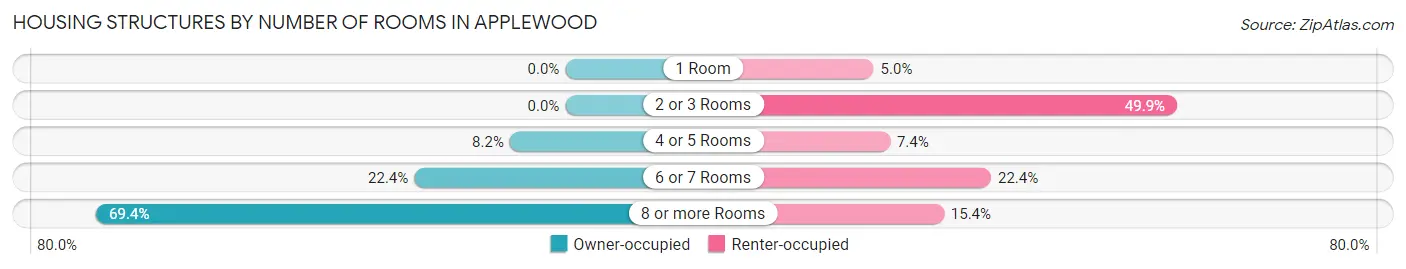
| Number of Rooms | Owner-occupied | Renter-occupied |
| 1 Room | 0 (0.0%) | 35 (5.0%) |
| 2 or 3 Rooms | 0 (0.0%) | 350 (49.9%) |
| 4 or 5 Rooms | 213 (8.2%) | 52 (7.4%) |
| 6 or 7 Rooms | 580 (22.4%) | 157 (22.4%) |
| 8 or more Rooms | 1,801 (69.4%) | 108 (15.4%) |
| Total | 2,594 (100.0%) | 702 (100.0%) |
Housing Structure by Heating Type in Applewood
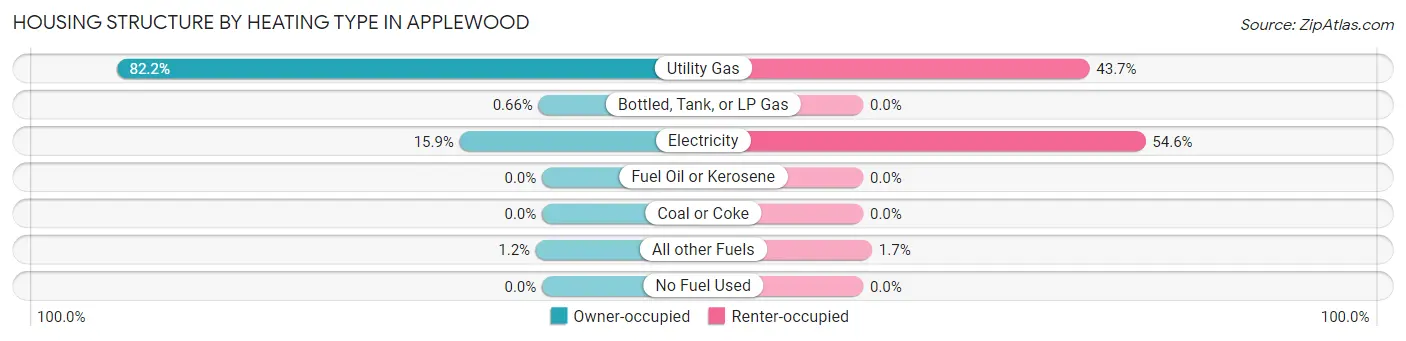
| Heating Type | Owner-occupied | Renter-occupied |
| Utility Gas | 2,133 (82.2%) | 307 (43.7%) |
| Bottled, Tank, or LP Gas | 17 (0.7%) | 0 (0.0%) |
| Electricity | 413 (15.9%) | 383 (54.6%) |
| Fuel Oil or Kerosene | 0 (0.0%) | 0 (0.0%) |
| Coal or Coke | 0 (0.0%) | 0 (0.0%) |
| All other Fuels | 31 (1.2%) | 12 (1.7%) |
| No Fuel Used | 0 (0.0%) | 0 (0.0%) |
| Total | 2,594 (100.0%) | 702 (100.0%) |
Household Vehicle Usage in Applewood
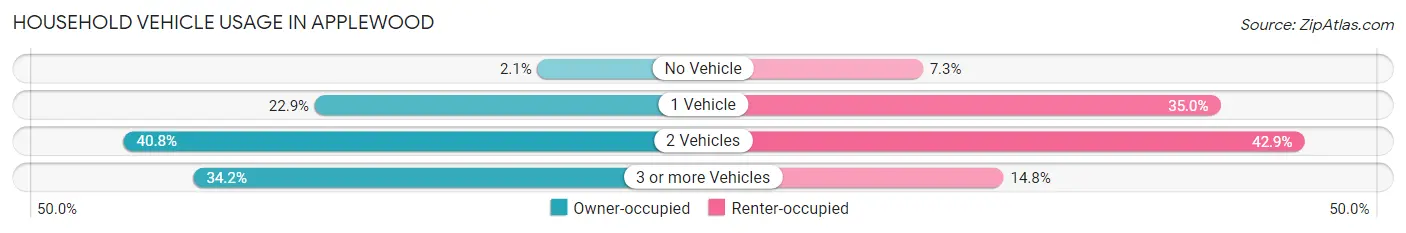
| Vehicles per Household | Owner-occupied | Renter-occupied |
| No Vehicle | 55 (2.1%) | 51 (7.3%) |
| 1 Vehicle | 594 (22.9%) | 246 (35.0%) |
| 2 Vehicles | 1,057 (40.7%) | 301 (42.9%) |
| 3 or more Vehicles | 888 (34.2%) | 104 (14.8%) |
| Total | 2,594 (100.0%) | 702 (100.0%) |
Real Estate & Mortgages in Applewood
Real Estate and Mortgage Overview in Applewood
| Characteristic | Without Mortgage | With Mortgage |
| Housing Units | 733 | 1,861 |
| Median Property Value | $742,600 | $665,400 |
| Median Household Income | $88,906 | $1,037 |
| Monthly Housing Costs | $777 | $460 |
| Real Estate Taxes | $3,878 | $0 |
Property Value by Mortgage Status in Applewood
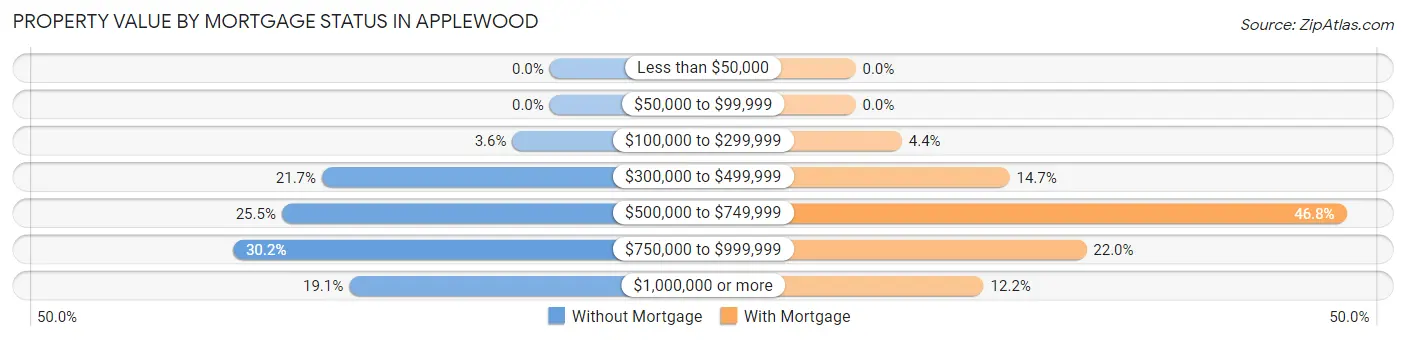
| Property Value | Without Mortgage | With Mortgage |
| Less than $50,000 | 0 (0.0%) | 0 (0.0%) |
| $50,000 to $99,999 | 0 (0.0%) | 0 (0.0%) |
| $100,000 to $299,999 | 26 (3.5%) | 82 (4.4%) |
| $300,000 to $499,999 | 159 (21.7%) | 273 (14.7%) |
| $500,000 to $749,999 | 187 (25.5%) | 870 (46.8%) |
| $750,000 to $999,999 | 221 (30.1%) | 409 (22.0%) |
| $1,000,000 or more | 140 (19.1%) | 227 (12.2%) |
| Total | 733 (100.0%) | 1,861 (100.0%) |
Household Income by Mortgage Status in Applewood
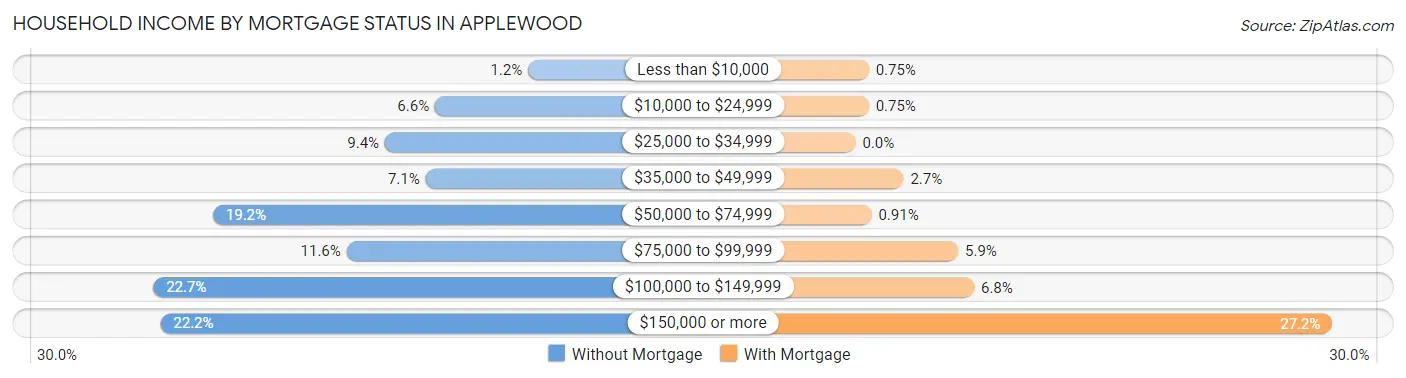
| Household Income | Without Mortgage | With Mortgage |
| Less than $10,000 | 9 (1.2%) | 14 (0.7%) |
| $10,000 to $24,999 | 48 (6.6%) | 14 (0.7%) |
| $25,000 to $34,999 | 69 (9.4%) | 0 (0.0%) |
| $35,000 to $49,999 | 52 (7.1%) | 51 (2.7%) |
| $50,000 to $74,999 | 141 (19.2%) | 17 (0.9%) |
| $75,000 to $99,999 | 85 (11.6%) | 109 (5.9%) |
| $100,000 to $149,999 | 166 (22.7%) | 126 (6.8%) |
| $150,000 or more | 163 (22.2%) | 507 (27.2%) |
| Total | 733 (100.0%) | 1,861 (100.0%) |
Property Value to Household Income Ratio in Applewood
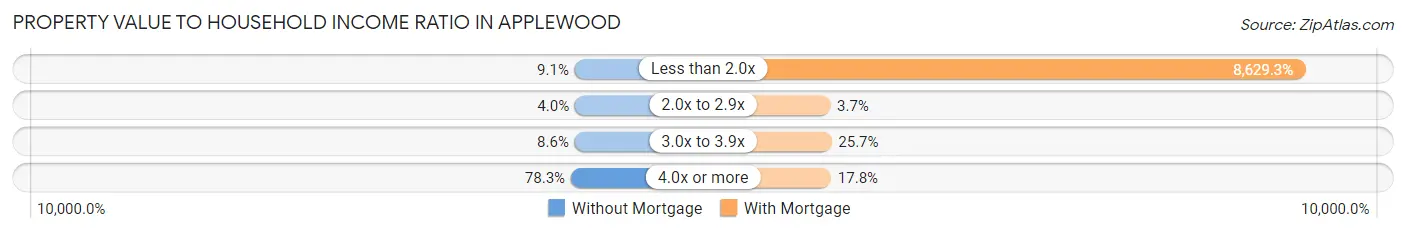
| Value-to-Income Ratio | Without Mortgage | With Mortgage |
| Less than 2.0x | 67 (9.1%) | 160,591 (8,629.3%) |
| 2.0x to 2.9x | 29 (4.0%) | 69 (3.7%) |
| 3.0x to 3.9x | 63 (8.6%) | 479 (25.7%) |
| 4.0x or more | 574 (78.3%) | 332 (17.8%) |
| Total | 733 (100.0%) | 1,861 (100.0%) |
Real Estate Taxes by Mortgage Status in Applewood
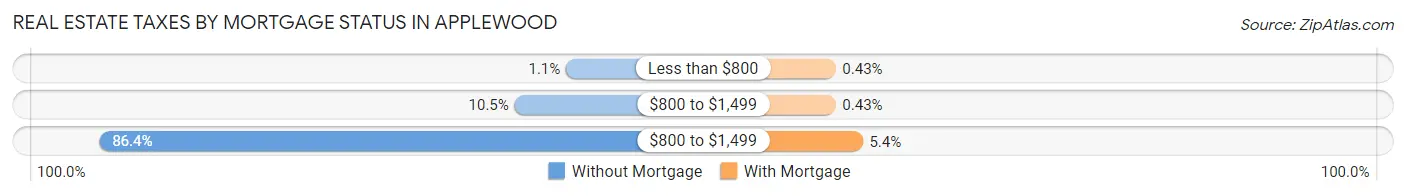
| Property Taxes | Without Mortgage | With Mortgage |
| Less than $800 | 8 (1.1%) | 8 (0.4%) |
| $800 to $1,499 | 77 (10.5%) | 8 (0.4%) |
| $800 to $1,499 | 633 (86.4%) | 100 (5.4%) |
| Total | 733 (100.0%) | 1,861 (100.0%) |
Health & Disability in Applewood
Health Insurance Coverage by Age in Applewood
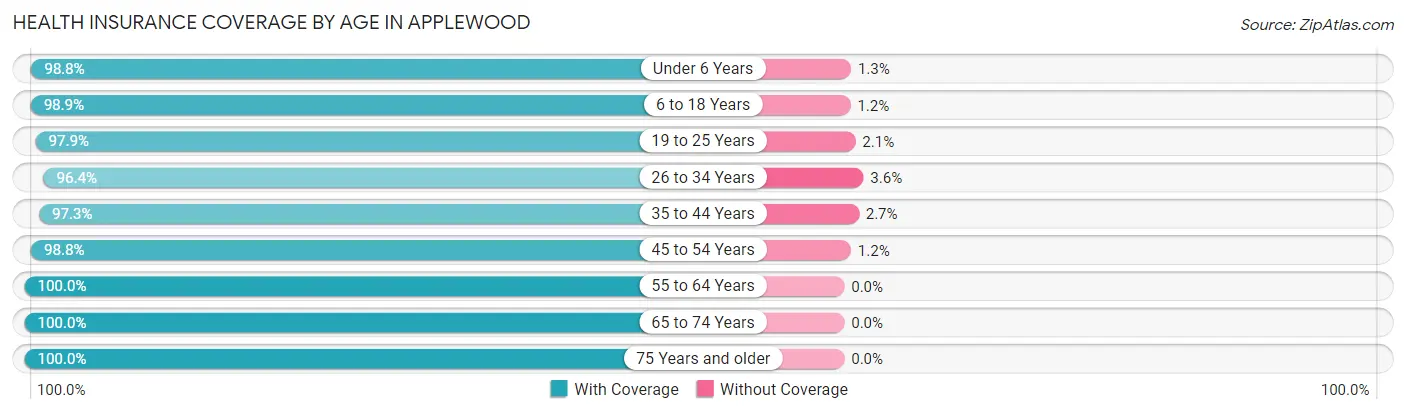
| Age Bracket | With Coverage | Without Coverage |
| Under 6 Years | 473 (98.8%) | 6 (1.3%) |
| 6 to 18 Years | 1,027 (98.9%) | 12 (1.1%) |
| 19 to 25 Years | 425 (97.9%) | 9 (2.1%) |
| 26 to 34 Years | 895 (96.4%) | 33 (3.6%) |
| 35 to 44 Years | 1,117 (97.3%) | 31 (2.7%) |
| 45 to 54 Years | 1,283 (98.8%) | 16 (1.2%) |
| 55 to 64 Years | 1,030 (100.0%) | 0 (0.0%) |
| 65 to 74 Years | 1,089 (100.0%) | 0 (0.0%) |
| 75 Years and older | 537 (100.0%) | 0 (0.0%) |
| Total | 7,876 (98.7%) | 107 (1.3%) |
Health Insurance Coverage by Citizenship Status in Applewood
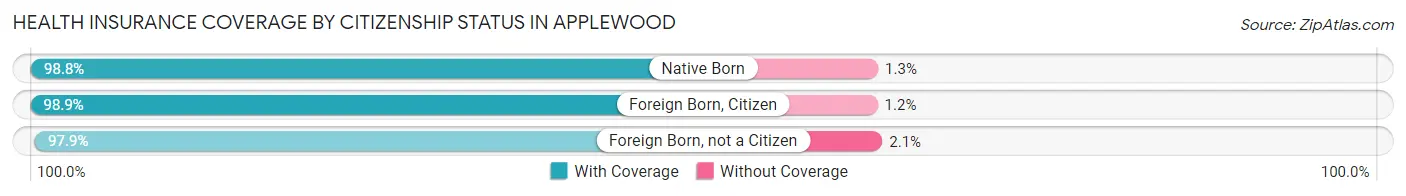
| Citizenship Status | With Coverage | Without Coverage |
| Native Born | 473 (98.8%) | 6 (1.3%) |
| Foreign Born, Citizen | 1,027 (98.9%) | 12 (1.1%) |
| Foreign Born, not a Citizen | 425 (97.9%) | 9 (2.1%) |
Health Insurance Coverage by Household Income in Applewood
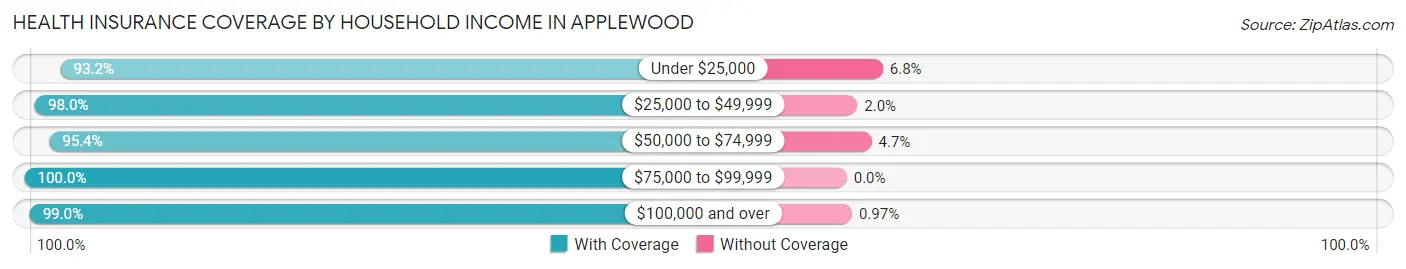
| Household Income | With Coverage | Without Coverage |
| Under $25,000 | 262 (93.2%) | 19 (6.8%) |
| $25,000 to $49,999 | 545 (98.0%) | 11 (2.0%) |
| $50,000 to $74,999 | 431 (95.4%) | 21 (4.6%) |
| $75,000 to $99,999 | 856 (100.0%) | 0 (0.0%) |
| $100,000 and over | 5,746 (99.0%) | 56 (1.0%) |
Public vs Private Health Insurance Coverage by Age in Applewood
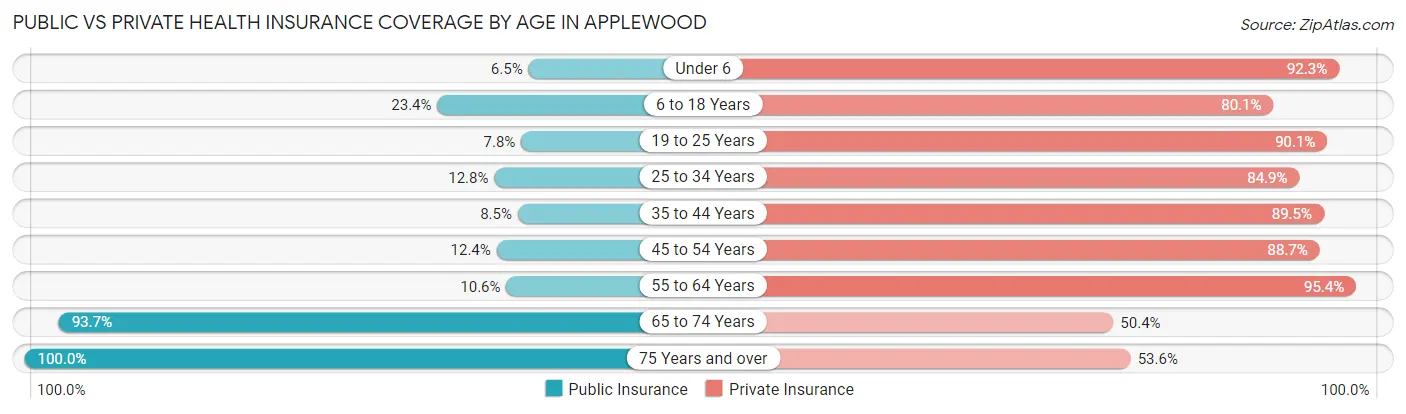
| Age Bracket | Public Insurance | Private Insurance |
| Under 6 | 31 (6.5%) | 442 (92.3%) |
| 6 to 18 Years | 243 (23.4%) | 832 (80.1%) |
| 19 to 25 Years | 34 (7.8%) | 391 (90.1%) |
| 25 to 34 Years | 119 (12.8%) | 788 (84.9%) |
| 35 to 44 Years | 97 (8.5%) | 1,027 (89.5%) |
| 45 to 54 Years | 161 (12.4%) | 1,152 (88.7%) |
| 55 to 64 Years | 109 (10.6%) | 983 (95.4%) |
| 65 to 74 Years | 1,020 (93.7%) | 549 (50.4%) |
| 75 Years and over | 537 (100.0%) | 288 (53.6%) |
| Total | 2,351 (29.4%) | 6,452 (80.8%) |
Disability Status by Sex by Age in Applewood
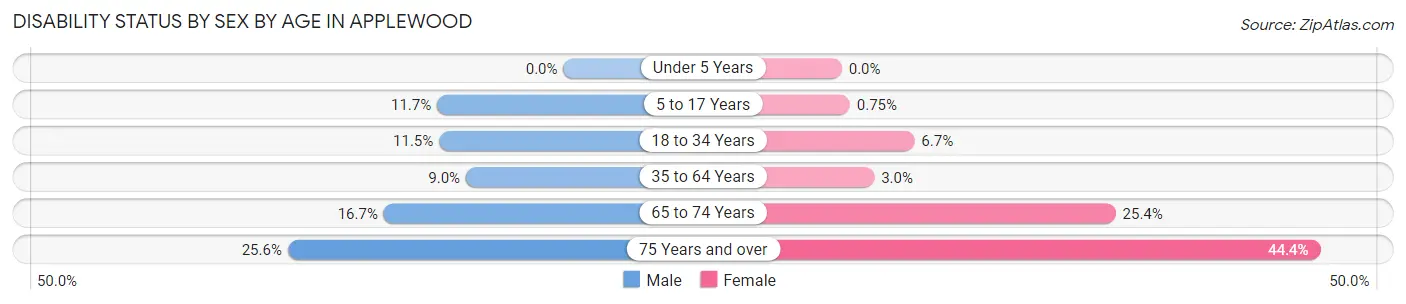
| Age Bracket | Male | Female |
| Under 5 Years | 0 (0.0%) | 0 (0.0%) |
| 5 to 17 Years | 64 (11.7%) | 4 (0.7%) |
| 18 to 34 Years | 83 (11.5%) | 46 (6.7%) |
| 35 to 64 Years | 161 (9.0%) | 51 (3.0%) |
| 65 to 74 Years | 91 (16.7%) | 138 (25.4%) |
| 75 Years and over | 55 (25.6%) | 143 (44.4%) |
Disability Class by Sex by Age in Applewood
Disability Class: Hearing Difficulty
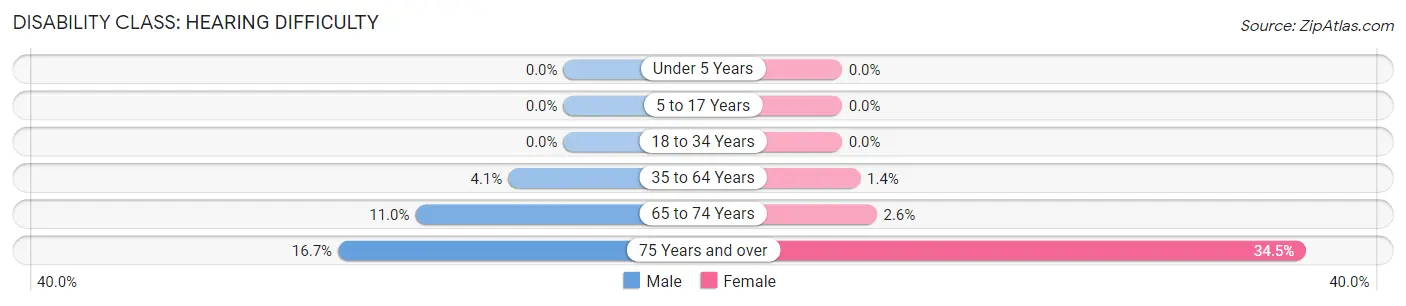
| Age Bracket | Male | Female |
| Under 5 Years | 0 (0.0%) | 0 (0.0%) |
| 5 to 17 Years | 0 (0.0%) | 0 (0.0%) |
| 18 to 34 Years | 0 (0.0%) | 0 (0.0%) |
| 35 to 64 Years | 73 (4.1%) | 23 (1.4%) |
| 65 to 74 Years | 60 (11.0%) | 14 (2.6%) |
| 75 Years and over | 36 (16.7%) | 111 (34.5%) |
Disability Class: Vision Difficulty
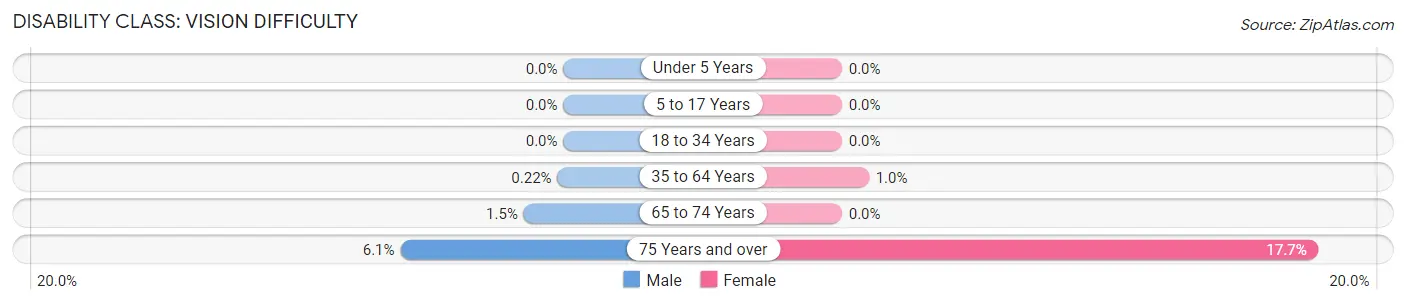
| Age Bracket | Male | Female |
| Under 5 Years | 0 (0.0%) | 0 (0.0%) |
| 5 to 17 Years | 0 (0.0%) | 0 (0.0%) |
| 18 to 34 Years | 0 (0.0%) | 0 (0.0%) |
| 35 to 64 Years | 4 (0.2%) | 17 (1.0%) |
| 65 to 74 Years | 8 (1.5%) | 0 (0.0%) |
| 75 Years and over | 13 (6.0%) | 57 (17.7%) |
Disability Class: Cognitive Difficulty
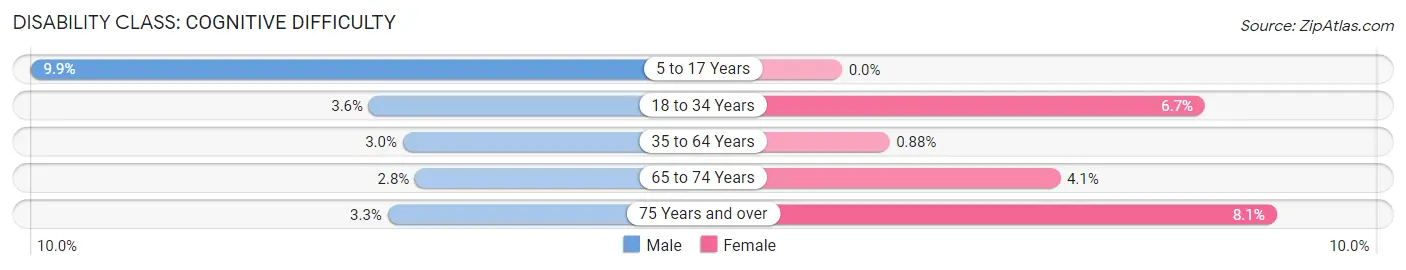
| Age Bracket | Male | Female |
| 5 to 17 Years | 54 (9.9%) | 0 (0.0%) |
| 18 to 34 Years | 26 (3.6%) | 46 (6.7%) |
| 35 to 64 Years | 53 (3.0%) | 15 (0.9%) |
| 65 to 74 Years | 15 (2.8%) | 22 (4.1%) |
| 75 Years and over | 7 (3.3%) | 26 (8.1%) |
Disability Class: Ambulatory Difficulty
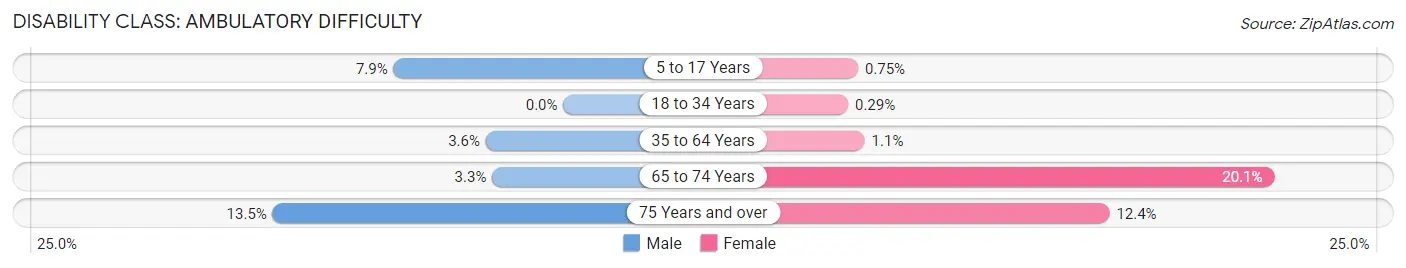
| Age Bracket | Male | Female |
| 5 to 17 Years | 43 (7.9%) | 4 (0.7%) |
| 18 to 34 Years | 0 (0.0%) | 2 (0.3%) |
| 35 to 64 Years | 64 (3.6%) | 18 (1.1%) |
| 65 to 74 Years | 18 (3.3%) | 109 (20.1%) |
| 75 Years and over | 29 (13.5%) | 40 (12.4%) |
Disability Class: Self-Care Difficulty
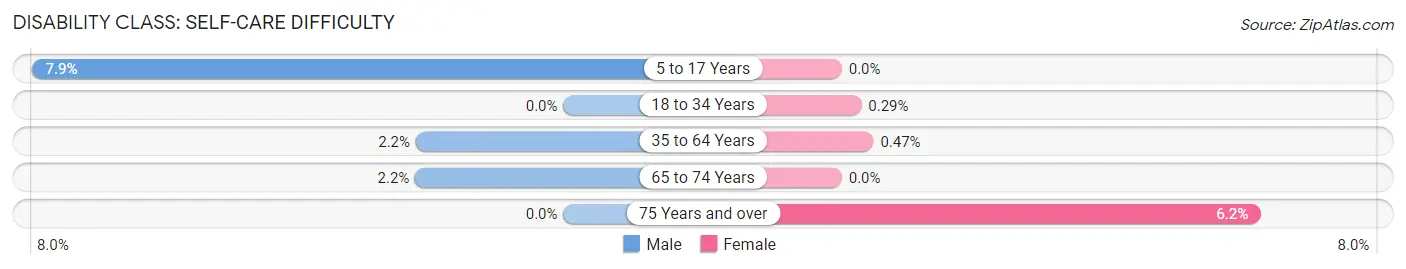
| Age Bracket | Male | Female |
| 5 to 17 Years | 43 (7.9%) | 0 (0.0%) |
| 18 to 34 Years | 0 (0.0%) | 2 (0.3%) |
| 35 to 64 Years | 39 (2.2%) | 8 (0.5%) |
| 65 to 74 Years | 12 (2.2%) | 0 (0.0%) |
| 75 Years and over | 0 (0.0%) | 20 (6.2%) |
Technology Access in Applewood
Computing Device Access in Applewood
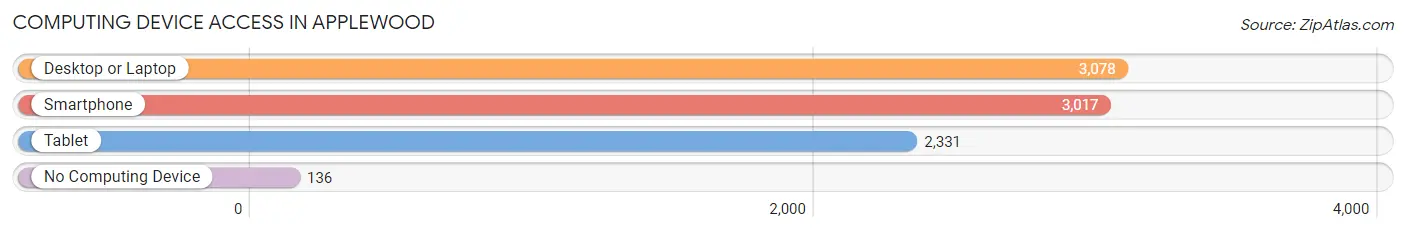
| Device Type | # Households | % Households |
| Desktop or Laptop | 3,078 | 93.4% |
| Smartphone | 3,017 | 91.5% |
| Tablet | 2,331 | 70.7% |
| No Computing Device | 136 | 4.1% |
| Total | 3,296 | 100.0% |
Internet Access in Applewood
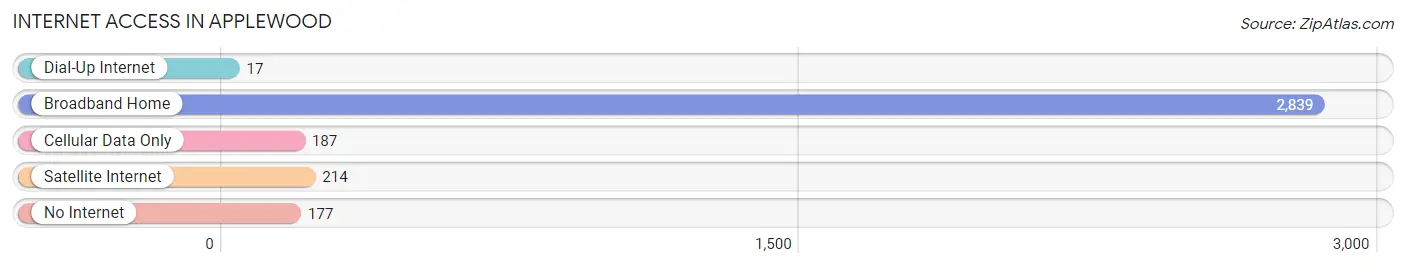
| Internet Type | # Households | % Households |
| Dial-Up Internet | 17 | 0.5% |
| Broadband Home | 2,839 | 86.1% |
| Cellular Data Only | 187 | 5.7% |
| Satellite Internet | 214 | 6.5% |
| No Internet | 177 | 5.4% |
| Total | 3,296 | 100.0% |
Applewood Summary
Applewood is a small, unincorporated community located in Jefferson County, Colorado. It is situated in the foothills of the Rocky Mountains, just west of Denver. The community is bordered by the cities of Lakewood, Wheat Ridge, and Arvada. Applewood is a popular destination for outdoor recreation, with its proximity to the mountains and its many parks and trails.
History
Applewood was first settled in the late 1800s by homesteaders who were attracted to the area’s abundant natural resources. The community was originally known as “Applewood Park” and was home to a number of apple orchards. In the early 1900s, the area was annexed by the City of Lakewood and became known as “Applewood.”
In the 1950s, Applewood began to experience rapid growth as the population of Denver and its suburbs increased. The area was annexed by the City of Wheat Ridge in the 1960s and became a popular destination for outdoor recreation.
Geography
Applewood is located in the foothills of the Rocky Mountains, just west of Denver. The community is bordered by the cities of Lakewood, Wheat Ridge, and Arvada. Applewood is situated at an elevation of 5,890 feet above sea level.
The area is characterized by rolling hills, open meadows, and dense forests. Applewood is home to a number of parks and trails, including the Applewood Trail, which is a popular destination for hikers and mountain bikers.
Economy
Applewood is primarily a residential community, with most of its residents employed in the nearby cities of Denver, Lakewood, Wheat Ridge, and Arvada. The area is also home to a number of small businesses, including restaurants, retail stores, and professional services.
Demographics
As of the 2010 census, Applewood had a population of 8,945. The population is primarily white (83.3%), with smaller percentages of Hispanic (7.2%), African American (3.2%), and Asian (2.2%) residents. The median household income is $63,945, and the median home value is $346,000.
Applewood is a diverse community, with a variety of religious and cultural backgrounds represented. The area is home to a number of churches, synagogues, and mosques.
Conclusion
Applewood is a small, unincorporated community located in Jefferson County, Colorado. It is situated in the foothills of the Rocky Mountains, just west of Denver. The community is bordered by the cities of Lakewood, Wheat Ridge, and Arvada. Applewood is a popular destination for outdoor recreation, with its proximity to the mountains and its many parks and trails. The area is primarily residential, with most of its residents employed in the nearby cities of Denver, Lakewood, Wheat Ridge, and Arvada. As of the 2010 census, Applewood had a population of 8,945, with a median household income of $63,945 and a median home value of $346,000. Applewood is a diverse community, with a variety of religious and cultural backgrounds represented.
Common Questions
What is the Total Population of Applewood?
Total Population of Applewood is 7,985.
What is the Total Male Population of Applewood?
Total Male Population of Applewood is 4,045.
What is the Total Female Population of Applewood?
Total Female Population of Applewood is 3,940.
What is the Ratio of Males per 100 Females in Applewood?
There are 102.66 Males per 100 Females in Applewood.
What is the Ratio of Females per 100 Males in Applewood?
There are 97.40 Females per 100 Males in Applewood.
What is the Median Population Age in Applewood?
Median Population Age in Applewood is 44.5 Years.
What is the Average Family Size in Applewood
Average Family Size in Applewood is 3.0 People.
What is the Average Household Size in Applewood
Average Household Size in Applewood is 2.4 People.
What is Per Capita Income in Applewood?
Per Capita income in Applewood is $68,987.
What is the Median Family Income in Applewood?
Median Family Income in Applewood is $153,567.
What is the Median Household income in Applewood?
Median Household Income in Applewood is $125,455.
What is Income or Wage Gap in Applewood?
Income or Wage Gap in Applewood is 36.4%.
Women in Applewood earn 63.6 cents for every dollar earned by a man.
What is Inequality or Gini Index in Applewood?
Inequality or Gini Index in Applewood is 0.42.
How Large is the Labor Force in Applewood?
There are 4,699 People in the Labor Forcein in Applewood.
What is the Percentage of People in the Labor Force in Applewood?
69.9% of People are in the Labor Force in Applewood.
What is the Unemployment Rate in Applewood?
Unemployment Rate in Applewood is 6.1%.