Zip Codes with the Highest Percentage of Population Employed in Accommodation & Food Services in Sacramento, CA
RELATED REPORTS & OPTIONS
Accommodation & Food Services
Sacramento
Compare Zip Codes
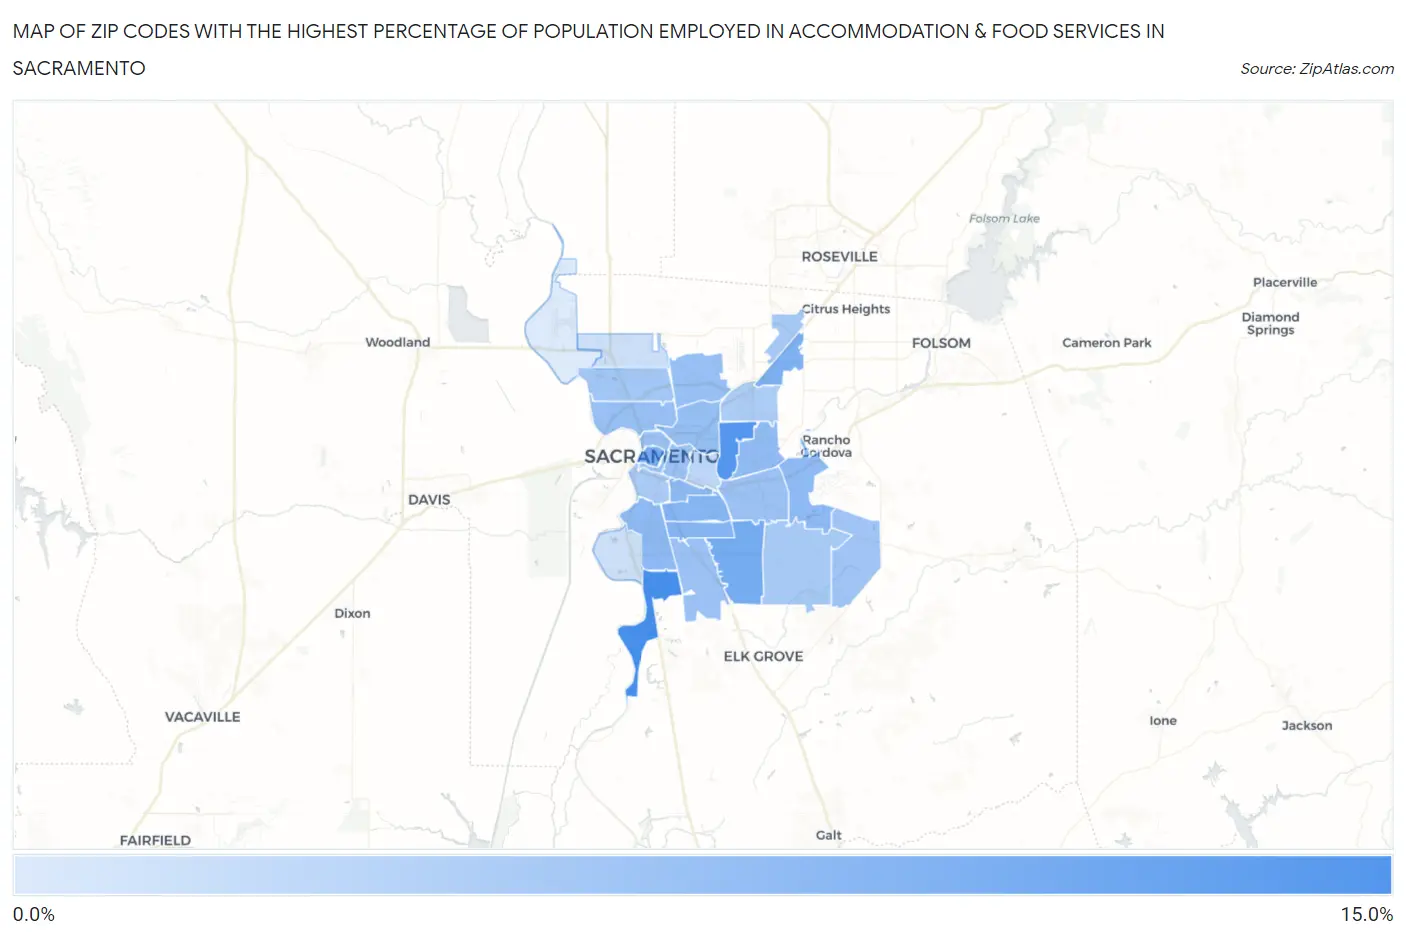
Map of Zip Codes with the Highest Percentage of Population Employed in Accommodation & Food Services in Sacramento
0.0%
15.0%
Zip Codes with the Highest Percentage of Population Employed in Accommodation & Food Services in Sacramento, CA
| Zip Code | % Employed | vs State | vs National | |
| 1. | 95832 | 14.5% | 7.2%(+7.29)#124 | 6.9%(+7.58)#1,828 |
| 2. | 95825 | 13.2% | 7.2%(+6.08)#144 | 6.9%(+6.37)#2,247 |
| 3. | 95814 | 10.7% | 7.2%(+3.57)#237 | 6.9%(+3.86)#3,772 |
| 4. | 95828 | 10.7% | 7.2%(+3.50)#246 | 6.9%(+3.79)#3,821 |
| 5. | 95841 | 10.0% | 7.2%(+2.79)#296 | 6.9%(+3.08)#4,594 |
| 6. | 95824 | 9.4% | 7.2%(+2.19)#360 | 6.9%(+2.48)#5,410 |
| 7. | 95820 | 9.3% | 7.2%(+2.14)#368 | 6.9%(+2.43)#5,490 |
| 8. | 95817 | 8.9% | 7.2%(+1.74)#406 | 6.9%(+2.03)#6,113 |
| 9. | 95822 | 8.7% | 7.2%(+1.52)#423 | 6.9%(+1.81)#6,488 |
| 10. | 95827 | 8.6% | 7.2%(+1.39)#437 | 6.9%(+1.68)#6,714 |
| 11. | 95864 | 8.4% | 7.2%(+1.26)#465 | 6.9%(+1.55)#6,943 |
| 12. | 95815 | 8.1% | 7.2%(+0.949)#507 | 6.9%(+1.24)#7,591 |
| 13. | 95838 | 7.9% | 7.2%(+0.764)#535 | 6.9%(+1.05)#7,954 |
| 14. | 95833 | 7.9% | 7.2%(+0.691)#549 | 6.9%(+0.981)#8,122 |
| 15. | 95816 | 7.8% | 7.2%(+0.648)#558 | 6.9%(+0.938)#8,216 |
| 16. | 95811 | 7.8% | 7.2%(+0.584)#571 | 6.9%(+0.874)#8,356 |
| 17. | 95826 | 7.7% | 7.2%(+0.492)#589 | 6.9%(+0.782)#8,592 |
| 18. | 95823 | 7.6% | 7.2%(+0.422)#595 | 6.9%(+0.712)#8,763 |
| 19. | 95830 | 7.1% | 7.2%(-0.054)#689 | 6.9%(+0.236)#10,012 |
| 20. | 95834 | 7.0% | 7.2%(-0.175)#718 | 6.9%(+0.115)#10,323 |
| 21. | 95842 | 6.9% | 7.2%(-0.244)#734 | 6.9%(+0.046)#10,531 |
| 22. | 95829 | 6.6% | 7.2%(-0.572)#803 | 6.9%(-0.282)#11,528 |
| 23. | 95818 | 6.5% | 7.2%(-0.693)#840 | 6.9%(-0.403)#11,917 |
| 24. | 95821 | 6.3% | 7.2%(-0.919)#883 | 6.9%(-0.629)#12,618 |
| 25. | 95819 | 5.1% | 7.2%(-2.10)#1,101 | 6.9%(-1.81)#16,563 |
| 26. | 95831 | 3.9% | 7.2%(-3.30)#1,307 | 6.9%(-3.01)#20,583 |
| 27. | 95835 | 3.8% | 7.2%(-3.38)#1,314 | 6.9%(-3.09)#20,814 |
| 28. | 95837 | 2.6% | 7.2%(-4.56)#1,444 | 6.9%(-4.27)#24,213 |
1
Common Questions
What are the Top 10 Zip Codes with the Highest Percentage of Population Employed in Accommodation & Food Services in Sacramento, CA?
Top 10 Zip Codes with the Highest Percentage of Population Employed in Accommodation & Food Services in Sacramento, CA are:
What zip code has the Highest Percentage of Population Employed in Accommodation & Food Services in Sacramento, CA?
95832 has the Highest Percentage of Population Employed in Accommodation & Food Services in Sacramento, CA with 14.5%.
What is the Percentage of Population Employed in Accommodation & Food Services in Sacramento, CA?
Percentage of Population Employed in Accommodation & Food Services in Sacramento is 7.5%.
What is the Percentage of Population Employed in Accommodation & Food Services in California?
Percentage of Population Employed in Accommodation & Food Services in California is 7.2%.
What is the Percentage of Population Employed in Accommodation & Food Services in the United States?
Percentage of Population Employed in Accommodation & Food Services in the United States is 6.9%.