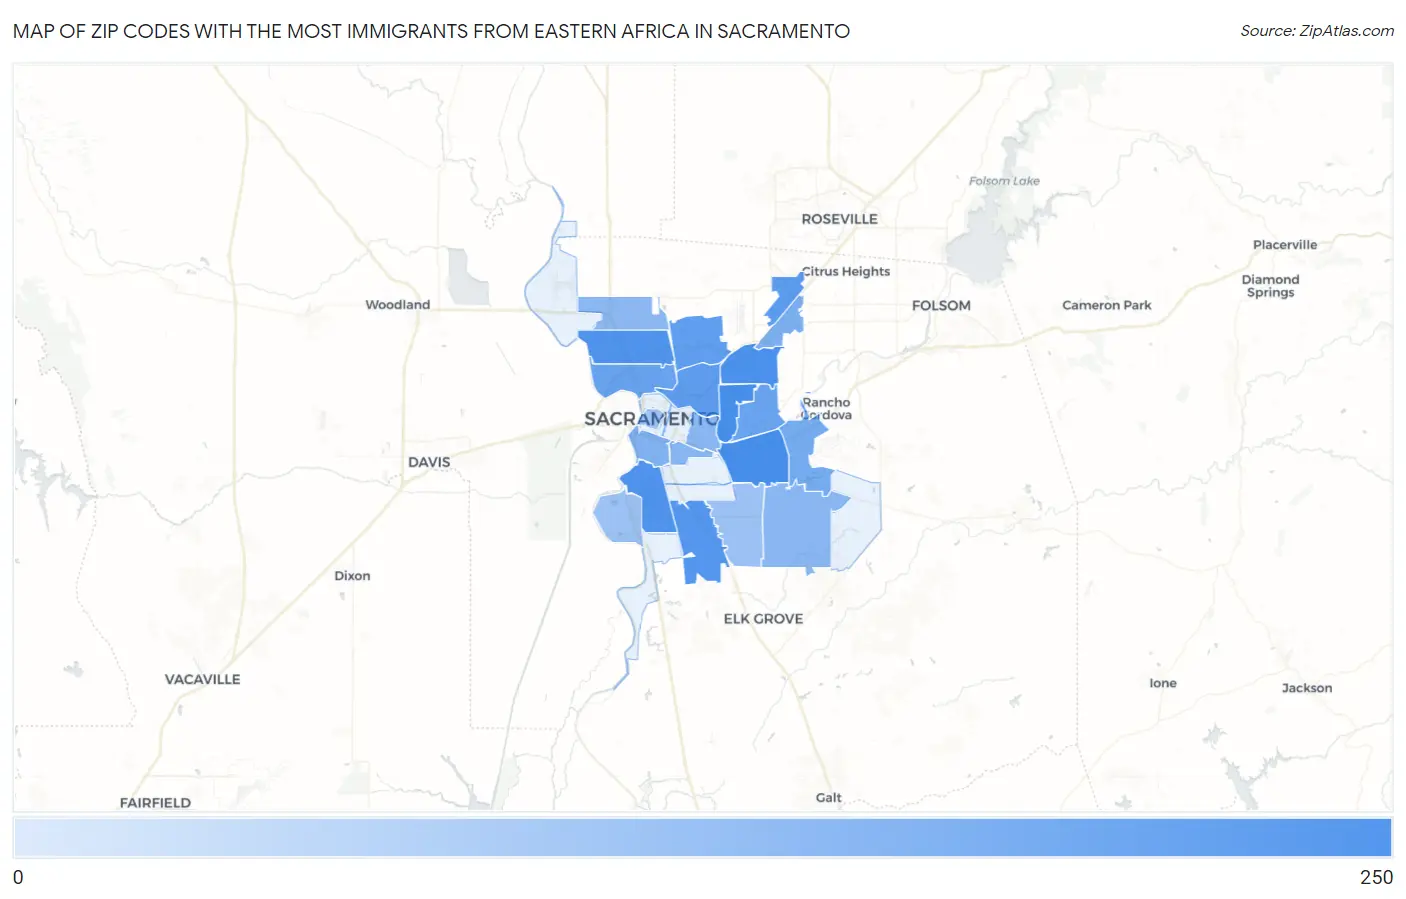
Zip Codes with the Most Immigrants from Eastern Africa in Sacramento, CA
RELATED REPORTS & OPTIONS
Eastern Africa
Sacramento
Compare Zip Codes
Map of Zip Codes with the Most Immigrants from Eastern Africa in Sacramento
0
250
Zip Codes with the Most Immigrants from Eastern Africa in Sacramento, CA
| Zip Code | Eastern Africa | vs State | vs National | |
| 1. | 95825 | 230 | 61,212(0.38%)#58 | 752,337(0.03%)#756 |
| 2. | 95826 | 223 | 61,212(0.36%)#64 | 752,337(0.03%)#779 |
| 3. | 95821 | 193 | 61,212(0.32%)#77 | 752,337(0.03%)#901 |
| 4. | 95822 | 180 | 61,212(0.29%)#87 | 752,337(0.02%)#955 |
| 5. | 95834 | 170 | 61,212(0.28%)#89 | 752,337(0.02%)#1,004 |
| 6. | 95823 | 138 | 61,212(0.23%)#111 | 752,337(0.02%)#1,204 |
| 7. | 95842 | 111 | 61,212(0.18%)#148 | 752,337(0.01%)#1,456 |
| 8. | 95815 | 100 | 61,212(0.16%)#171 | 752,337(0.01%)#1,608 |
| 9. | 95838 | 88 | 61,212(0.14%)#187 | 752,337(0.01%)#1,745 |
| 10. | 95833 | 73 | 61,212(0.12%)#235 | 752,337(0.01%)#2,016 |
| 11. | 95864 | 67 | 61,212(0.11%)#253 | 752,337(0.01%)#2,139 |
| 12. | 95827 | 44 | 61,212(0.07%)#338 | 752,337(0.01%)#2,797 |
| 13. | 95841 | 32 | 61,212(0.05%)#406 | 752,337(0.00%)#3,307 |
| 14. | 95818 | 27 | 61,212(0.04%)#441 | 752,337(0.00%)#3,589 |
| 15. | 95817 | 21 | 61,212(0.03%)#497 | 752,337(0.00%)#4,038 |
| 16. | 95829 | 20 | 61,212(0.03%)#507 | 752,337(0.00%)#4,094 |
| 17. | 95819 | 20 | 61,212(0.03%)#509 | 752,337(0.00%)#4,111 |
| 18. | 95835 | 18 | 61,212(0.03%)#522 | 752,337(0.00%)#4,228 |
| 19. | 95831 | 10 | 61,212(0.02%)#617 | 752,337(0.00%)#5,060 |
| 20. | 95828 | 9 | 61,212(0.01%)#626 | 752,337(0.00%)#5,158 |
| 21. | 95814 | 8 | 61,212(0.01%)#664 | 752,337(0.00%)#5,420 |
1
Common Questions
What are the Top 10 Zip Codes with the Most Immigrants from Eastern Africa in Sacramento, CA?
Top 10 Zip Codes with the Most Immigrants from Eastern Africa in Sacramento, CA are:
What zip code has the Most Immigrants from Eastern Africa in Sacramento, CA?
95825 has the Most Immigrants from Eastern Africa in Sacramento, CA with 230.
What is the Total Immigrants from Eastern Africa in Sacramento, CA?
Total Immigrants from Eastern Africa in Sacramento is 1,058.
What is the Total Immigrants from Eastern Africa in California?
Total Immigrants from Eastern Africa in California is 61,212.
What is the Total Immigrants from Eastern Africa in the United States?
Total Immigrants from Eastern Africa in the United States is 752,337.