Zip Codes with the Highest Percentage of Population Employed in Security & Protection in Sacramento, CA
RELATED REPORTS & OPTIONS
Security & Protection
Sacramento
Compare Zip Codes
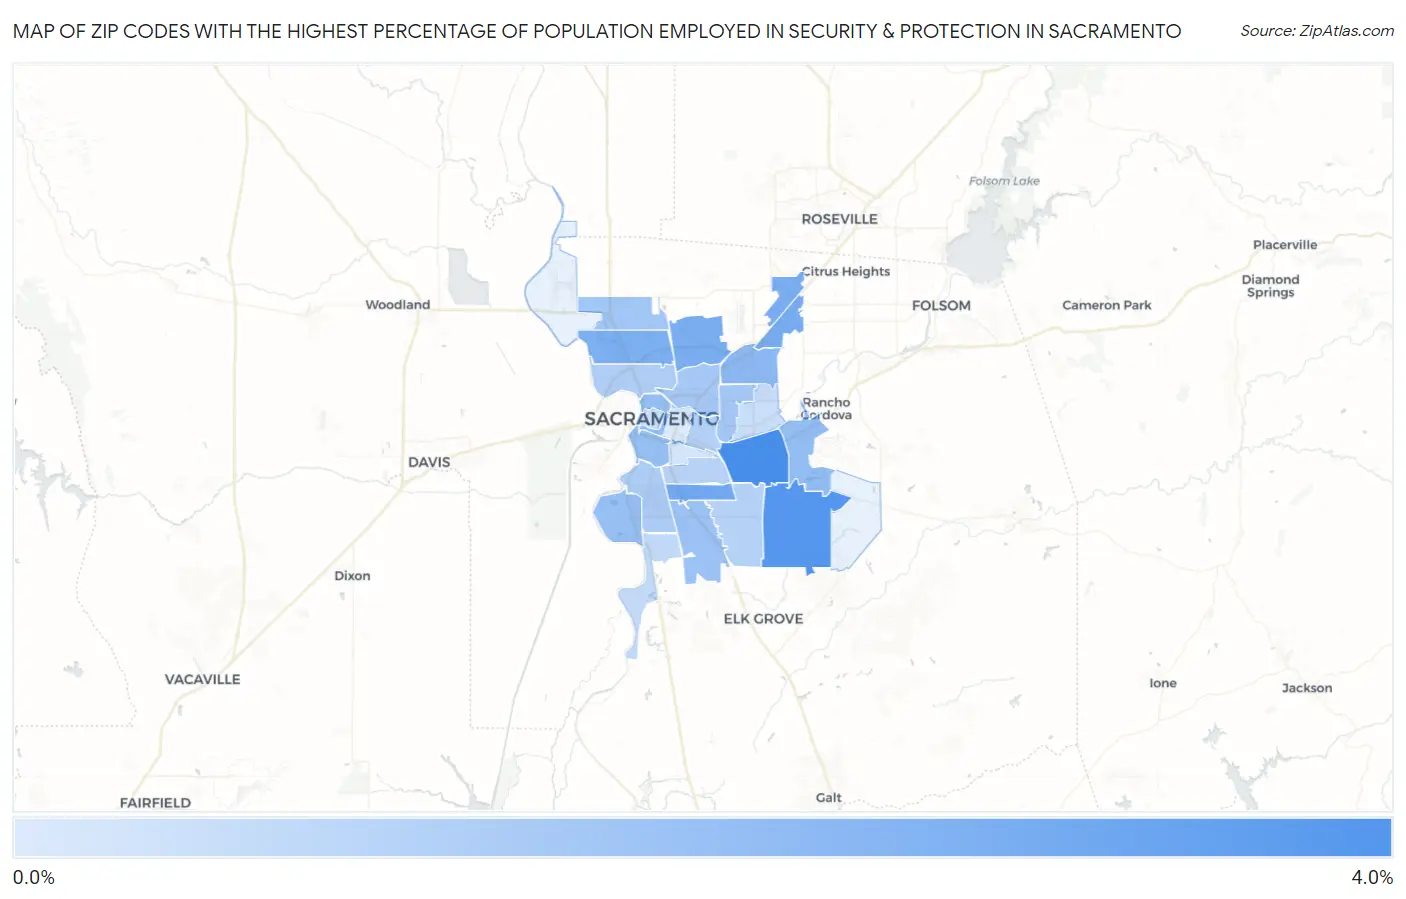
Map of Zip Codes with the Highest Percentage of Population Employed in Security & Protection in Sacramento
0.0%
4.0%
Zip Codes with the Highest Percentage of Population Employed in Security & Protection in Sacramento, CA
| Zip Code | % Employed | vs State | vs National | |
| 1. | 95826 | 3.6% | 2.1%(+1.51)#266 | 2.1%(+1.44)#5,430 |
| 2. | 95829 | 3.3% | 2.1%(+1.26)#308 | 2.1%(+1.19)#6,129 |
| 3. | 95824 | 2.8% | 2.1%(+0.701)#444 | 2.1%(+0.633)#8,187 |
| 4. | 95841 | 2.7% | 2.1%(+0.586)#464 | 2.1%(+0.518)#8,682 |
| 5. | 95838 | 2.6% | 2.1%(+0.535)#480 | 2.1%(+0.467)#8,931 |
| 6. | 95842 | 2.6% | 2.1%(+0.529)#484 | 2.1%(+0.461)#8,963 |
| 7. | 95834 | 2.5% | 2.1%(+0.469)#508 | 2.1%(+0.401)#9,256 |
| 8. | 95821 | 2.2% | 2.1%(+0.168)#604 | 2.1%(+0.100)#10,956 |
| 9. | 95827 | 2.1% | 2.1%(+0.023)#664 | 2.1%(-0.045)#11,885 |
| 10. | 95818 | 2.1% | 2.1%(-0.022)#683 | 2.1%(-0.090)#12,192 |
| 11. | 95811 | 2.1% | 2.1%(-0.027)#688 | 2.1%(-0.095)#12,225 |
| 12. | 95831 | 2.0% | 2.1%(-0.058)#704 | 2.1%(-0.126)#12,409 |
| 13. | 95823 | 1.9% | 2.1%(-0.149)#746 | 2.1%(-0.216)#13,008 |
| 14. | 95825 | 1.8% | 2.1%(-0.276)#794 | 2.1%(-0.344)#13,907 |
| 15. | 95835 | 1.8% | 2.1%(-0.281)#800 | 2.1%(-0.349)#13,953 |
| 16. | 95815 | 1.7% | 2.1%(-0.343)#835 | 2.1%(-0.411)#14,410 |
| 17. | 95822 | 1.6% | 2.1%(-0.476)#895 | 2.1%(-0.544)#15,380 |
| 18. | 95833 | 1.6% | 2.1%(-0.502)#909 | 2.1%(-0.569)#15,580 |
| 19. | 95819 | 1.5% | 2.1%(-0.585)#956 | 2.1%(-0.653)#16,242 |
| 20. | 95828 | 1.4% | 2.1%(-0.653)#983 | 2.1%(-0.721)#16,759 |
| 21. | 95820 | 1.4% | 2.1%(-0.680)#1,000 | 2.1%(-0.747)#16,944 |
| 22. | 95832 | 1.2% | 2.1%(-0.872)#1,096 | 2.1%(-0.940)#18,445 |
| 23. | 95864 | 1.1% | 2.1%(-0.990)#1,146 | 2.1%(-1.06)#19,355 |
| 24. | 95814 | 1.0% | 2.1%(-1.06)#1,168 | 2.1%(-1.12)#19,842 |
| 25. | 95817 | 0.90% | 2.1%(-1.18)#1,219 | 2.1%(-1.25)#20,819 |
| 26. | 95816 | 0.70% | 2.1%(-1.38)#1,287 | 2.1%(-1.45)#22,083 |
1
Common Questions
What are the Top 10 Zip Codes with the Highest Percentage of Population Employed in Security & Protection in Sacramento, CA?
Top 10 Zip Codes with the Highest Percentage of Population Employed in Security & Protection in Sacramento, CA are:
What zip code has the Highest Percentage of Population Employed in Security & Protection in Sacramento, CA?
95826 has the Highest Percentage of Population Employed in Security & Protection in Sacramento, CA with 3.6%.
What is the Percentage of Population Employed in Security & Protection in Sacramento, CA?
Percentage of Population Employed in Security & Protection in Sacramento is 1.8%.
What is the Percentage of Population Employed in Security & Protection in California?
Percentage of Population Employed in Security & Protection in California is 2.1%.
What is the Percentage of Population Employed in Security & Protection in the United States?
Percentage of Population Employed in Security & Protection in the United States is 2.1%.