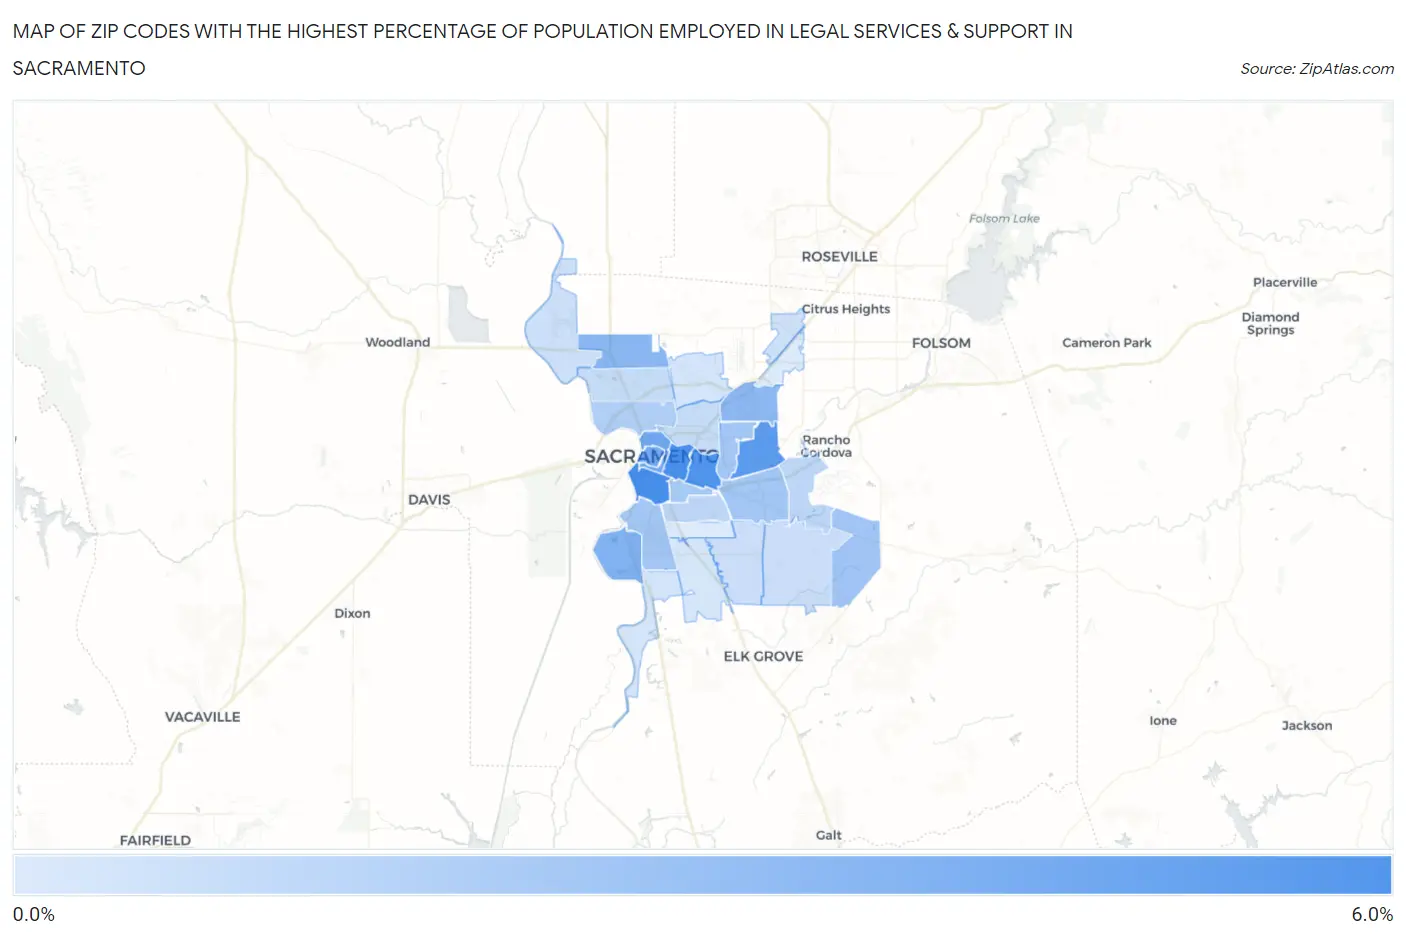
Zip Codes with the Highest Percentage of Population Employed in Legal Services & Support in Sacramento, CA
RELATED REPORTS & OPTIONS
Legal Services & Support
Sacramento
Compare Zip Codes
Map of Zip Codes with the Highest Percentage of Population Employed in Legal Services & Support in Sacramento
0.0%
6.0%
Zip Codes with the Highest Percentage of Population Employed in Legal Services & Support in Sacramento, CA
| Zip Code | % Employed | vs State | vs National | |
| 1. | 95818 | 5.4% | 1.3%(+4.15)#48 | 1.2%(+4.22)#620 |
| 2. | 95816 | 5.3% | 1.3%(+4.04)#51 | 1.2%(+4.12)#635 |
| 3. | 95819 | 5.2% | 1.3%(+3.89)#56 | 1.2%(+3.97)#679 |
| 4. | 95864 | 4.8% | 1.3%(+3.50)#64 | 1.2%(+3.58)#795 |
| 5. | 95814 | 3.9% | 1.3%(+2.67)#100 | 1.2%(+2.75)#1,163 |
| 6. | 95811 | 3.9% | 1.3%(+2.63)#102 | 1.2%(+2.70)#1,183 |
| 7. | 95831 | 3.3% | 1.3%(+2.06)#142 | 1.2%(+2.13)#1,570 |
| 8. | 95835 | 3.0% | 1.3%(+1.75)#167 | 1.2%(+1.82)#1,836 |
| 9. | 95821 | 2.9% | 1.3%(+1.67)#175 | 1.2%(+1.74)#1,933 |
| 10. | 95830 | 2.1% | 1.3%(+0.877)#276 | 1.2%(+0.951)#3,167 |
| 11. | 95822 | 2.1% | 1.3%(+0.869)#277 | 1.2%(+0.943)#3,185 |
| 12. | 95825 | 2.1% | 1.3%(+0.838)#281 | 1.2%(+0.912)#3,234 |
| 13. | 95826 | 2.1% | 1.3%(+0.816)#283 | 1.2%(+0.891)#3,279 |
| 14. | 95817 | 1.9% | 1.3%(+0.661)#319 | 1.2%(+0.735)#3,676 |
| 15. | 95833 | 1.6% | 1.3%(+0.307)#409 | 1.2%(+0.381)#4,796 |
| 16. | 95820 | 1.2% | 1.3%(-0.054)#531 | 1.2%(+0.020)#6,473 |
| 17. | 95827 | 1.2% | 1.3%(-0.070)#542 | 1.2%(+0.004)#6,583 |
| 18. | 95834 | 0.91% | 1.3%(-0.344)#676 | 1.2%(-0.269)#8,484 |
| 19. | 95815 | 0.91% | 1.3%(-0.346)#677 | 1.2%(-0.272)#8,501 |
| 20. | 95829 | 0.71% | 1.3%(-0.553)#796 | 1.2%(-0.479)#10,354 |
| 21. | 95828 | 0.68% | 1.3%(-0.580)#814 | 1.2%(-0.506)#10,630 |
| 22. | 95837 | 0.65% | 1.3%(-0.605)#832 | 1.2%(-0.530)#10,906 |
| 23. | 95842 | 0.51% | 1.3%(-0.744)#923 | 1.2%(-0.670)#12,443 |
| 24. | 95838 | 0.38% | 1.3%(-0.877)#1,019 | 1.2%(-0.803)#14,066 |
| 25. | 95832 | 0.37% | 1.3%(-0.886)#1,030 | 1.2%(-0.812)#14,174 |
| 26. | 95823 | 0.28% | 1.3%(-0.974)#1,071 | 1.2%(-0.899)#15,202 |
| 27. | 95841 | 0.074% | 1.3%(-1.18)#1,174 | 1.2%(-1.11)#17,311 |
| 28. | 95824 | 0.072% | 1.3%(-1.19)#1,175 | 1.2%(-1.11)#17,318 |
1
Common Questions
What are the Top 10 Zip Codes with the Highest Percentage of Population Employed in Legal Services & Support in Sacramento, CA?
Top 10 Zip Codes with the Highest Percentage of Population Employed in Legal Services & Support in Sacramento, CA are:
What zip code has the Highest Percentage of Population Employed in Legal Services & Support in Sacramento, CA?
95818 has the Highest Percentage of Population Employed in Legal Services & Support in Sacramento, CA with 5.4%.
What is the Percentage of Population Employed in Legal Services & Support in Sacramento, CA?
Percentage of Population Employed in Legal Services & Support in Sacramento is 2.2%.
What is the Percentage of Population Employed in Legal Services & Support in California?
Percentage of Population Employed in Legal Services & Support in California is 1.3%.
What is the Percentage of Population Employed in Legal Services & Support in the United States?
Percentage of Population Employed in Legal Services & Support in the United States is 1.2%.