Immigrants from Western Asia vs South American 1 or more Vehicles in Household
COMPARE
Immigrants from Western Asia
South American
1 or more Vehicles in Household
1 or more Vehicles in Household Comparison
Immigrants from Western Asia
South Americans
89.0%
1 OR MORE VEHICLES IN HOUSEHOLD
12.3/ 100
METRIC RATING
213th/ 347
METRIC RANK
89.5%
1 OR MORE VEHICLES IN HOUSEHOLD
39.6/ 100
METRIC RATING
187th/ 347
METRIC RANK
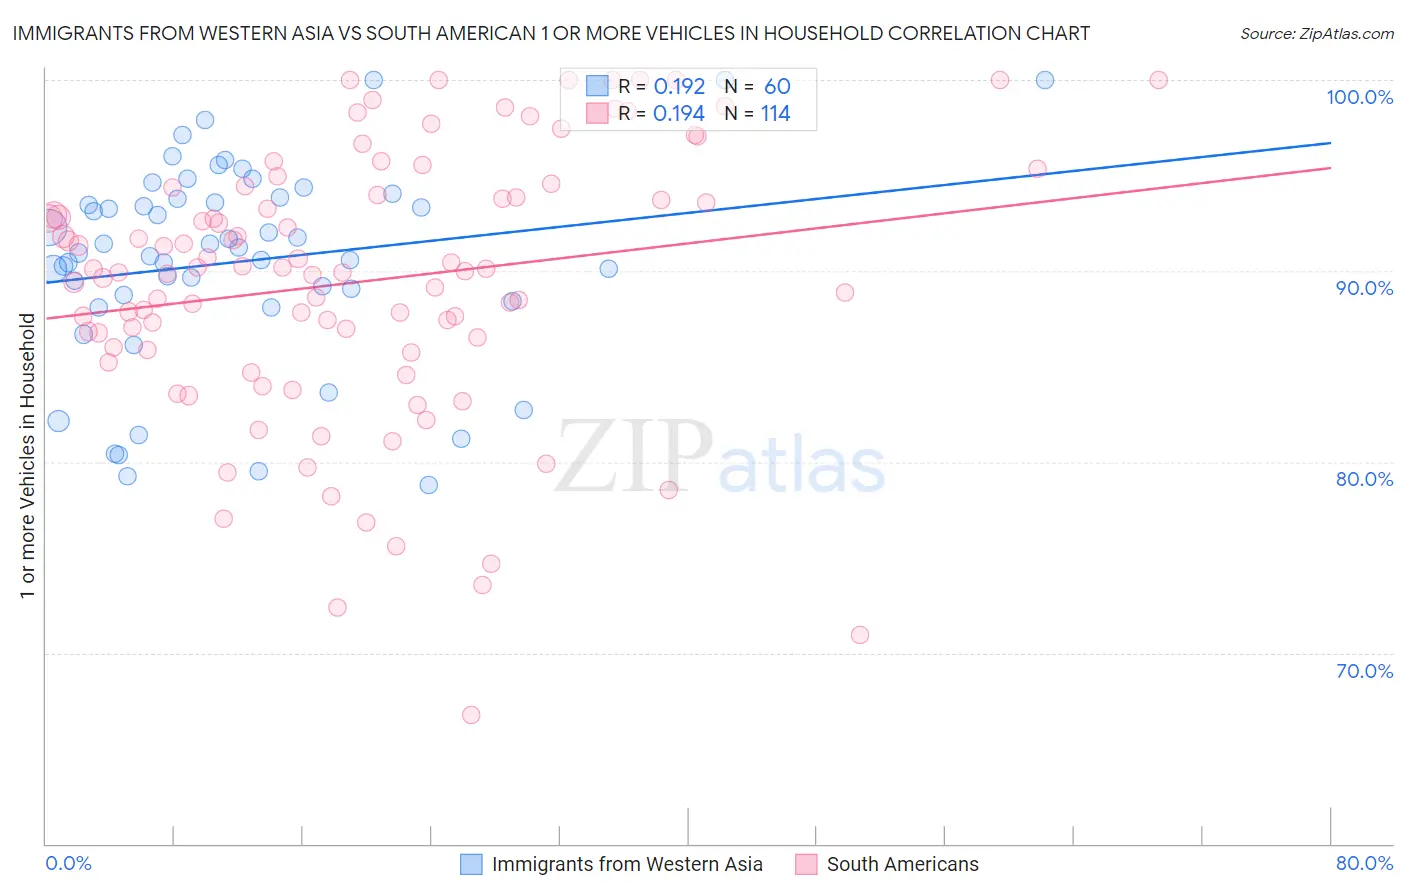
Immigrants from Western Asia vs South American 1 or more Vehicles in Household Correlation Chart
The statistical analysis conducted on geographies consisting of 404,226,276 people shows a poor positive correlation between the proportion of Immigrants from Western Asia and percentage of households with 1 or more vehicles available in the United States with a correlation coefficient (R) of 0.192 and weighted average of 89.0%. Similarly, the statistical analysis conducted on geographies consisting of 482,231,258 people shows a poor positive correlation between the proportion of South Americans and percentage of households with 1 or more vehicles available in the United States with a correlation coefficient (R) of 0.194 and weighted average of 89.5%, a difference of 0.61%.
1 or more Vehicles in Household Correlation Summary
| Measurement | Immigrants from Western Asia | South American |
| Minimum | 78.8% | 66.8% |
| Maximum | 100.0% | 100.0% |
| Range | 21.2% | 33.2% |
| Mean | 90.5% | 89.4% |
| Median | 91.1% | 90.0% |
| Interquartile 25% (IQ1) | 88.6% | 86.0% |
| Interquartile 75% (IQ3) | 93.8% | 94.0% |
| Interquartile Range (IQR) | 5.3% | 8.0% |
| Standard Deviation (Sample) | 5.3% | 7.0% |
| Standard Deviation (Population) | 5.2% | 7.0% |
Similar Demographics by 1 or more Vehicles in Household
Demographics Similar to Immigrants from Western Asia by 1 or more Vehicles in Household
In terms of 1 or more vehicles in household, the demographic groups most similar to Immigrants from Western Asia are Immigrants from Hungary (89.0%, a difference of 0.010%), Somali (89.0%, a difference of 0.020%), Sierra Leonean (89.0%, a difference of 0.030%), Dutch West Indian (89.0%, a difference of 0.040%), and Immigrants from Italy (89.1%, a difference of 0.060%).
| Demographics | Rating | Rank | 1 or more Vehicles in Household |
| Apache | 16.2 /100 | #206 | Poor 89.1% |
| Immigrants | Denmark | 14.8 /100 | #207 | Poor 89.1% |
| Immigrants | Chile | 14.4 /100 | #208 | Poor 89.1% |
| Immigrants | Italy | 14.0 /100 | #209 | Poor 89.1% |
| Dutch West Indians | 13.5 /100 | #210 | Poor 89.0% |
| Sierra Leoneans | 13.0 /100 | #211 | Poor 89.0% |
| Somalis | 12.8 /100 | #212 | Poor 89.0% |
| Immigrants | Western Asia | 12.3 /100 | #213 | Poor 89.0% |
| Immigrants | Hungary | 11.9 /100 | #214 | Poor 89.0% |
| Immigrants | Sri Lanka | 10.2 /100 | #215 | Poor 88.9% |
| Immigrants | Argentina | 9.4 /100 | #216 | Tragic 88.9% |
| Argentineans | 8.8 /100 | #217 | Tragic 88.9% |
| Ugandans | 8.7 /100 | #218 | Tragic 88.9% |
| Immigrants | Guatemala | 8.6 /100 | #219 | Tragic 88.9% |
| Immigrants | Zaire | 8.1 /100 | #220 | Tragic 88.8% |
Demographics Similar to South Americans by 1 or more Vehicles in Household
In terms of 1 or more vehicles in household, the demographic groups most similar to South Americans are Immigrants from Brazil (89.6%, a difference of 0.010%), Pueblo (89.6%, a difference of 0.010%), Immigrants from Nepal (89.5%, a difference of 0.010%), Immigrants from Bulgaria (89.6%, a difference of 0.020%), and Ethiopian (89.6%, a difference of 0.030%).
| Demographics | Rating | Rank | 1 or more Vehicles in Household |
| Arabs | 43.3 /100 | #180 | Average 89.6% |
| Immigrants | Ethiopia | 42.5 /100 | #181 | Average 89.6% |
| Ukrainians | 42.4 /100 | #182 | Average 89.6% |
| Ethiopians | 41.2 /100 | #183 | Average 89.6% |
| Immigrants | Bulgaria | 40.7 /100 | #184 | Average 89.6% |
| Immigrants | Brazil | 40.1 /100 | #185 | Average 89.6% |
| Pueblo | 39.9 /100 | #186 | Fair 89.6% |
| South Americans | 39.6 /100 | #187 | Fair 89.5% |
| Immigrants | Nepal | 38.9 /100 | #188 | Fair 89.5% |
| Carpatho Rusyns | 37.8 /100 | #189 | Fair 89.5% |
| Shoshone | 37.5 /100 | #190 | Fair 89.5% |
| Immigrants | Poland | 37.1 /100 | #191 | Fair 89.5% |
| Immigrants | North Macedonia | 36.5 /100 | #192 | Fair 89.5% |
| Immigrants | Northern Europe | 35.5 /100 | #193 | Fair 89.5% |
| Immigrants | Eritrea | 33.2 /100 | #194 | Fair 89.4% |