Immigrants from Pakistan vs Immigrants from Sri Lanka 3 or more Vehicles in Household
COMPARE
Immigrants from Pakistan
Immigrants from Sri Lanka
3 or more Vehicles in Household
3 or more Vehicles in Household Comparison
Immigrants from Pakistan
Immigrants from Sri Lanka
19.8%
3 OR MORE VEHICLES IN HOUSEHOLD
68.2/ 100
METRIC RATING
159th/ 347
METRIC RANK
19.2%
3 OR MORE VEHICLES IN HOUSEHOLD
30.7/ 100
METRIC RATING
185th/ 347
METRIC RANK
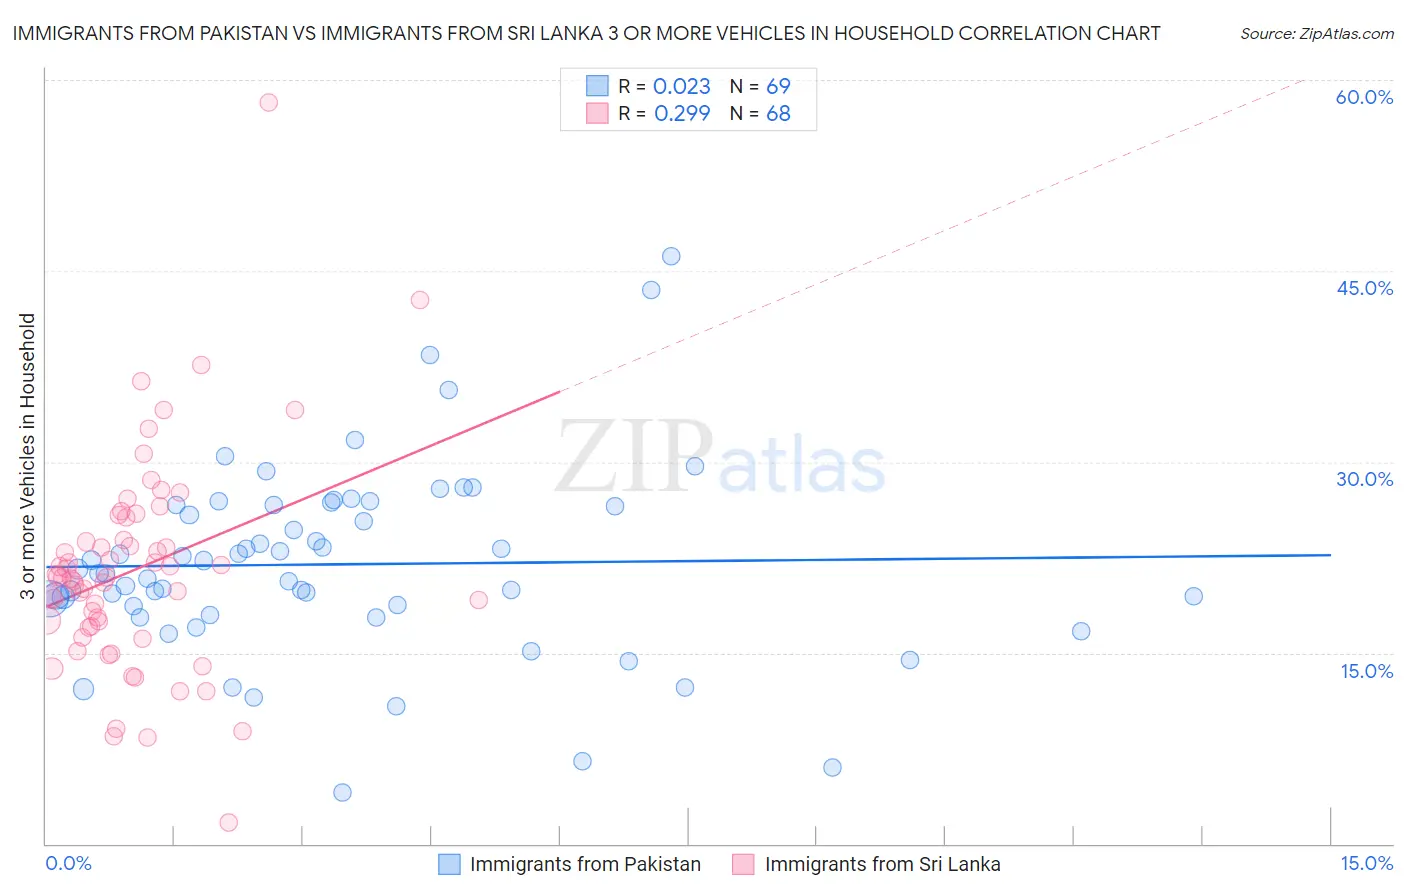
Immigrants from Pakistan vs Immigrants from Sri Lanka 3 or more Vehicles in Household Correlation Chart
The statistical analysis conducted on geographies consisting of 283,714,957 people shows no correlation between the proportion of Immigrants from Pakistan and percentage of households with 3 or more vehicles available in the United States with a correlation coefficient (R) of 0.023 and weighted average of 19.8%. Similarly, the statistical analysis conducted on geographies consisting of 149,676,246 people shows a weak positive correlation between the proportion of Immigrants from Sri Lanka and percentage of households with 3 or more vehicles available in the United States with a correlation coefficient (R) of 0.299 and weighted average of 19.2%, a difference of 3.0%.
3 or more Vehicles in Household Correlation Summary
| Measurement | Immigrants from Pakistan | Immigrants from Sri Lanka |
| Minimum | 4.0% | 1.7% |
| Maximum | 46.2% | 58.3% |
| Range | 42.1% | 56.6% |
| Mean | 21.9% | 21.5% |
| Median | 21.3% | 20.9% |
| Interquartile 25% (IQ1) | 18.3% | 17.0% |
| Interquartile 75% (IQ3) | 26.6% | 24.8% |
| Interquartile Range (IQR) | 8.3% | 7.7% |
| Standard Deviation (Sample) | 7.5% | 8.6% |
| Standard Deviation (Population) | 7.5% | 8.5% |
Similar Demographics by 3 or more Vehicles in Household
Demographics Similar to Immigrants from Pakistan by 3 or more Vehicles in Household
In terms of 3 or more vehicles in household, the demographic groups most similar to Immigrants from Pakistan are Armenian (19.8%, a difference of 0.050%), Immigrants from Lebanon (19.8%, a difference of 0.050%), Hungarian (19.8%, a difference of 0.21%), Immigrants from Guatemala (19.7%, a difference of 0.22%), and Thai (19.8%, a difference of 0.26%).
| Demographics | Rating | Rank | 3 or more Vehicles in Household |
| Lebanese | 79.8 /100 | #152 | Good 20.0% |
| Yuman | 75.6 /100 | #153 | Good 19.9% |
| Immigrants | Jordan | 75.0 /100 | #154 | Good 19.9% |
| Tlingit-Haida | 73.4 /100 | #155 | Good 19.9% |
| Thais | 71.1 /100 | #156 | Good 19.8% |
| Hungarians | 70.5 /100 | #157 | Good 19.8% |
| Armenians | 68.8 /100 | #158 | Good 19.8% |
| Immigrants | Pakistan | 68.2 /100 | #159 | Good 19.8% |
| Immigrants | Lebanon | 67.6 /100 | #160 | Good 19.8% |
| Immigrants | Guatemala | 65.6 /100 | #161 | Good 19.7% |
| Estonians | 63.2 /100 | #162 | Good 19.7% |
| Chileans | 63.0 /100 | #163 | Good 19.7% |
| Yugoslavians | 62.9 /100 | #164 | Good 19.7% |
| Immigrants | Costa Rica | 61.9 /100 | #165 | Good 19.7% |
| Immigrants | Cameroon | 60.9 /100 | #166 | Good 19.7% |
Demographics Similar to Immigrants from Sri Lanka by 3 or more Vehicles in Household
In terms of 3 or more vehicles in household, the demographic groups most similar to Immigrants from Sri Lanka are Immigrants from Sweden (19.2%, a difference of 0.16%), Immigrants from Hong Kong (19.2%, a difference of 0.22%), Latvian (19.3%, a difference of 0.44%), Immigrants from Kuwait (19.1%, a difference of 0.44%), and Indian (Asian) (19.1%, a difference of 0.44%).
| Demographics | Rating | Rank | 3 or more Vehicles in Household |
| Immigrants | Syria | 40.3 /100 | #178 | Average 19.4% |
| Immigrants | South Central Asia | 38.9 /100 | #179 | Fair 19.3% |
| South Africans | 37.5 /100 | #180 | Fair 19.3% |
| Romanians | 37.1 /100 | #181 | Fair 19.3% |
| Cubans | 36.6 /100 | #182 | Fair 19.3% |
| Cajuns | 36.0 /100 | #183 | Fair 19.3% |
| Latvians | 35.7 /100 | #184 | Fair 19.3% |
| Immigrants | Sri Lanka | 30.7 /100 | #185 | Fair 19.2% |
| Immigrants | Sweden | 29.0 /100 | #186 | Fair 19.2% |
| Immigrants | Hong Kong | 28.3 /100 | #187 | Fair 19.2% |
| Immigrants | Kuwait | 26.1 /100 | #188 | Fair 19.1% |
| Indians (Asian) | 26.0 /100 | #189 | Fair 19.1% |
| Immigrants | Zimbabwe | 25.5 /100 | #190 | Fair 19.1% |
| South American Indians | 25.4 /100 | #191 | Fair 19.1% |
| Kenyans | 24.7 /100 | #192 | Fair 19.1% |