Immigrants from North America vs Burmese Unemployment Among Women with Children Ages 6 to 17 years
COMPARE
Immigrants from North America
Burmese
Unemployment Among Women with Children Ages 6 to 17 years
Unemployment Among Women with Children Ages 6 to 17 years Comparison
Immigrants from North America
Burmese
9.2%
UNEMPLOYMENT AMONG WOMEN WITH CHILDREN AGES 6 TO 17 YEARS
12.7/ 100
METRIC RATING
206th/ 347
METRIC RANK
8.0%
UNEMPLOYMENT AMONG WOMEN WITH CHILDREN AGES 6 TO 17 YEARS
100.0/ 100
METRIC RATING
36th/ 347
METRIC RANK
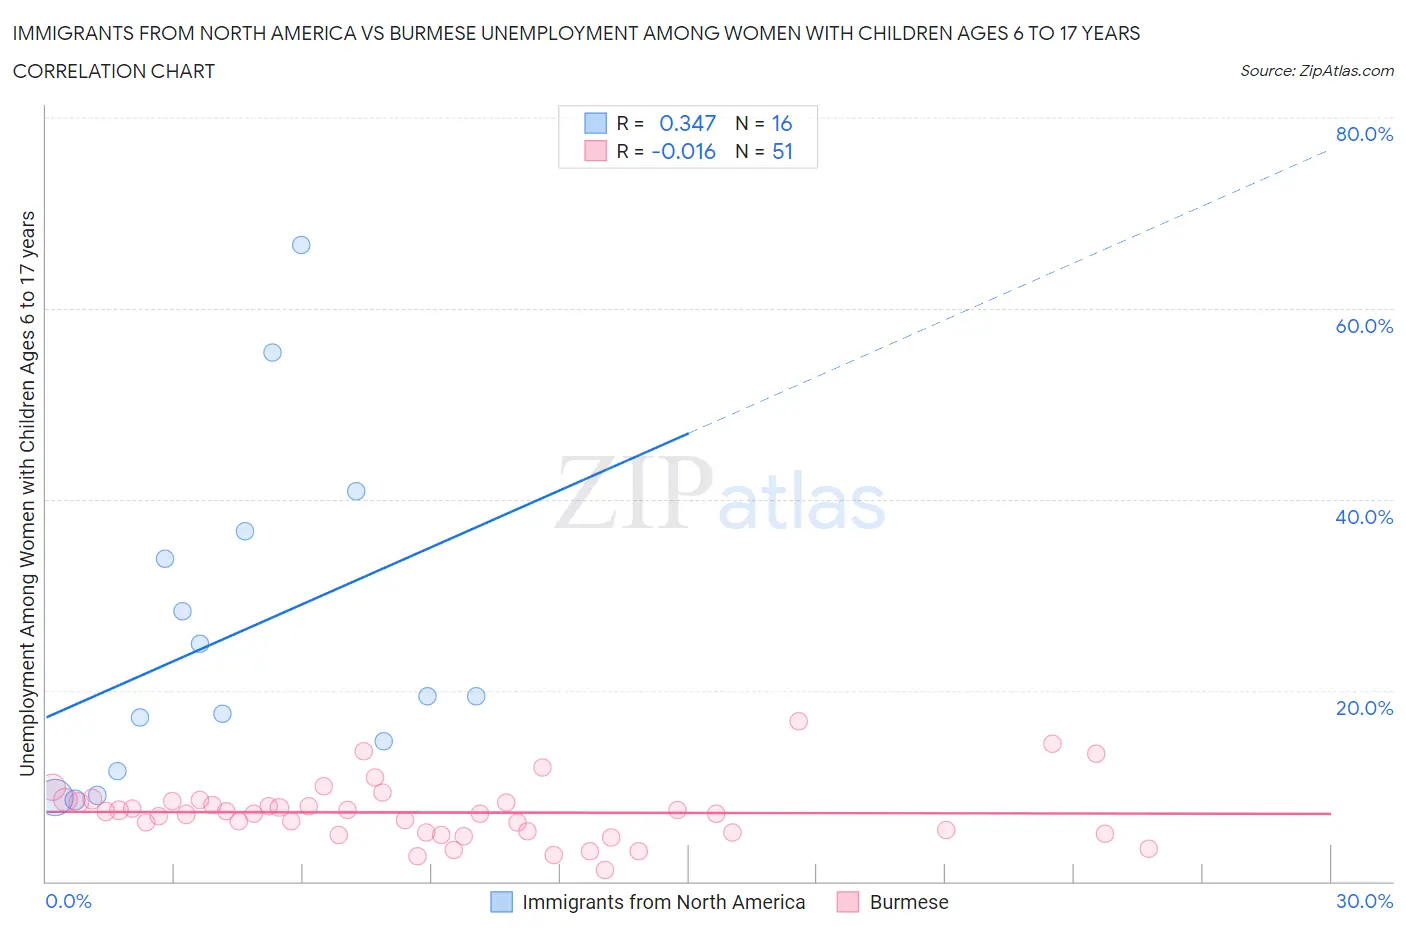
Immigrants from North America vs Burmese Unemployment Among Women with Children Ages 6 to 17 years Correlation Chart
The statistical analysis conducted on geographies consisting of 313,856,079 people shows a mild positive correlation between the proportion of Immigrants from North America and unemployment rate among women with children between the ages 6 and 17 in the United States with a correlation coefficient (R) of 0.347 and weighted average of 9.2%. Similarly, the statistical analysis conducted on geographies consisting of 320,179,112 people shows no correlation between the proportion of Burmese and unemployment rate among women with children between the ages 6 and 17 in the United States with a correlation coefficient (R) of -0.016 and weighted average of 8.0%, a difference of 15.1%.
Unemployment Among Women with Children Ages 6 to 17 years Correlation Summary
| Measurement | Immigrants from North America | Burmese |
| Minimum | 8.5% | 1.2% |
| Maximum | 66.7% | 16.8% |
| Range | 58.2% | 15.6% |
| Mean | 25.8% | 7.2% |
| Median | 19.4% | 7.1% |
| Interquartile 25% (IQ1) | 13.1% | 5.1% |
| Interquartile 75% (IQ3) | 35.2% | 8.4% |
| Interquartile Range (IQR) | 22.2% | 3.3% |
| Standard Deviation (Sample) | 17.1% | 3.1% |
| Standard Deviation (Population) | 16.6% | 3.1% |
Similar Demographics by Unemployment Among Women with Children Ages 6 to 17 years
Demographics Similar to Immigrants from North America by Unemployment Among Women with Children Ages 6 to 17 years
In terms of unemployment among women with children ages 6 to 17 years, the demographic groups most similar to Immigrants from North America are Immigrants from Western Europe (9.1%, a difference of 0.13%), Cuban (9.2%, a difference of 0.20%), Immigrants from Peru (9.2%, a difference of 0.20%), Salvadoran (9.2%, a difference of 0.21%), and Immigrants from Canada (9.1%, a difference of 0.23%).
| Demographics | Rating | Rank | Unemployment Among Women with Children Ages 6 to 17 years |
| Czechoslovakians | 20.8 /100 | #199 | Fair 9.1% |
| Trinidadians and Tobagonians | 18.2 /100 | #200 | Poor 9.1% |
| Immigrants | Trinidad and Tobago | 16.7 /100 | #201 | Poor 9.1% |
| Immigrants | Middle Africa | 15.6 /100 | #202 | Poor 9.1% |
| Maltese | 15.3 /100 | #203 | Poor 9.1% |
| Immigrants | Canada | 15.3 /100 | #204 | Poor 9.1% |
| Immigrants | Western Europe | 14.1 /100 | #205 | Poor 9.1% |
| Immigrants | North America | 12.7 /100 | #206 | Poor 9.2% |
| Cubans | 10.9 /100 | #207 | Poor 9.2% |
| Immigrants | Peru | 10.8 /100 | #208 | Poor 9.2% |
| Salvadorans | 10.7 /100 | #209 | Poor 9.2% |
| Finns | 10.0 /100 | #210 | Tragic 9.2% |
| Immigrants | Cuba | 9.6 /100 | #211 | Tragic 9.2% |
| Peruvians | 9.0 /100 | #212 | Tragic 9.2% |
| Spaniards | 8.2 /100 | #213 | Tragic 9.2% |
Demographics Similar to Burmese by Unemployment Among Women with Children Ages 6 to 17 years
In terms of unemployment among women with children ages 6 to 17 years, the demographic groups most similar to Burmese are Asian (8.0%, a difference of 0.030%), Immigrants from South Central Asia (7.9%, a difference of 0.080%), Native Hawaiian (7.9%, a difference of 0.18%), Alsatian (8.0%, a difference of 0.36%), and Immigrants from Korea (7.9%, a difference of 0.47%).
| Demographics | Rating | Rank | Unemployment Among Women with Children Ages 6 to 17 years |
| Thais | 100.0 /100 | #29 | Exceptional 7.8% |
| Immigrants | Iran | 100.0 /100 | #30 | Exceptional 7.9% |
| Laotians | 100.0 /100 | #31 | Exceptional 7.9% |
| Immigrants | Cambodia | 100.0 /100 | #32 | Exceptional 7.9% |
| Immigrants | Korea | 100.0 /100 | #33 | Exceptional 7.9% |
| Native Hawaiians | 100.0 /100 | #34 | Exceptional 7.9% |
| Immigrants | South Central Asia | 100.0 /100 | #35 | Exceptional 7.9% |
| Burmese | 100.0 /100 | #36 | Exceptional 8.0% |
| Asians | 100.0 /100 | #37 | Exceptional 8.0% |
| Alsatians | 100.0 /100 | #38 | Exceptional 8.0% |
| Somalis | 100.0 /100 | #39 | Exceptional 8.0% |
| Immigrants | Zimbabwe | 100.0 /100 | #40 | Exceptional 8.0% |
| Iranians | 100.0 /100 | #41 | Exceptional 8.0% |
| Immigrants | Somalia | 100.0 /100 | #42 | Exceptional 8.0% |
| Bhutanese | 100.0 /100 | #43 | Exceptional 8.1% |